Food Delivery Time Prediction

Background
Retail food delivery is a courier service in which food is delivered to a customer by a restaurant, store, or independent food delivery company. An order is often placed on a restaurant's website or over the phone, or through a meal delivery service. Entrees, sides, drinks, desserts, and grocery goods are among the products often provided in boxes or bags. In most cases, larger cities where residences and restaurants are closer together, the delivery person may ride bicycles or motorized scooters. Customers can pay online or in person, using cash or card, depending on the delivery company. Customers are frequently charged a flat rate delivery fee in addition to their purchases. Catering and wholesale food service deliveries by foodservice distributors to restaurants, cafeterias, health care facilities, and caterers are further types of food delivery.Food delivery services have significant advantages: it extends the customer base, enhances revenue, provides consumers with a range of options, and also provides unrivaled convenience.A successful business is built on delivering food on time.On-time delivery promotes improved customer collaboration, delivery reliability, and, most importantly, customer loyalty. Customers anticipate that the food delivery service will arrive on schedule. It's critical to set and meet the correct expectations with customers.Customer satisfaction and retention are dependent on the ability to accurately forecast delivery timings. On the supply side, time forecasts are also crucial since we use them to determine the time it takes to dispatch delivery partners.
There are numerous challenges when it comes to predicting food delivery time :
- It's all about finding the right balance between ensuring correct delivery time and not discouraging customers from placing orders.
- It's also about giving customers a large selection of restaurants, but only enough so that we can calculate their delivery timings as rapidly as possible.
- Estimating food preparation time is again tricky as it depends on the type of item, number of items and load at the restaurant.
- Assigning a delivery executive who can fulfill the order
- Time taken by the delivery executive to arrive at the restaurant
- Food preparation time
- Time taken by the delivery executive to reach the customer from the restaurant
Objective
This usecase helps predict the food delivery time based on the customers, orders and restaurant datasets. The challenge here is finding just the right time to ensure delivery, not too high to discourage customer from placing an order and not too low to not be able to meet the set expectations.
Relevance of Xceed Analytics
Xceed Analytics provides a single integrated data and AI platform that reduces friction in bring data and building machine models rapidly. It further empowers everyone including Citizen Data Engineers/Scientist to bring data together and build and delivery data and ml usecases rapidly. It's Low code/No code visual designer and model builder can be leveraged to bridge the gap and expand the availability of key data science and engineering skills.
This usecase showcases how to create, train/test and deploy a Food delivery time prediction regression model. The datasets were built by Xceed.These include customers dataset,orders datase and restaurant dataset. Xceed will provide a NO-CODE environment for the end-to-end implementation of this project, starting with the uploading of datasets from numerous sources to the deployment of the model at the end point. All of these steps are built using Visual Workflow Designer, from analyzing the data to constructing a model and deploying it.
Data Requirements
This usecases utilizes the following datasets:
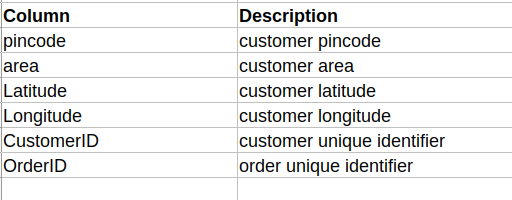
- Customers dataset : contains information about the customers
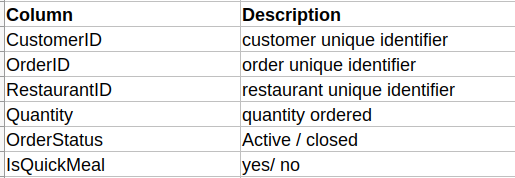
- Orders dataset : contains order related information
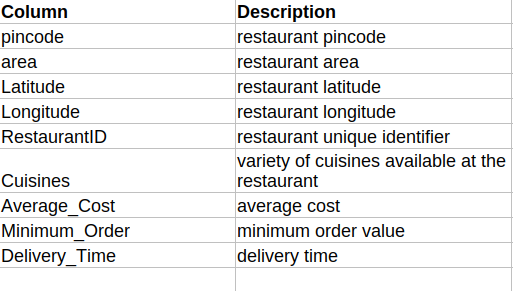
- Restaurant dataset : contains restaurant related information
Columns of interest in the datasets :
Customers dataset :
Orders dataset :
Restaurant dataset:
Model Objective
Understanding trends in food delivery time and predicting the delivery time by analysing the underlying data, constructing a regression machine learning model, and implementing it after defining the model's major features.
Steps followed to develop and deploy the model
- Upload the data to Xceed Analytics and create a dataset
- Create the Workflow for the experiment
- Perform initial exploration of data columns.
- Perform Cleanup and Tranform operations
- Build/Train a regression Model
- Review the model output and Evaluate the model
Upload the data to Xceed Analytcs and Create the dataset
- From the Data Connections Page, upload the three datasets to Xceed Analytics: customers, orders and restaurants. For more information on Data Connections refer to Data Connections
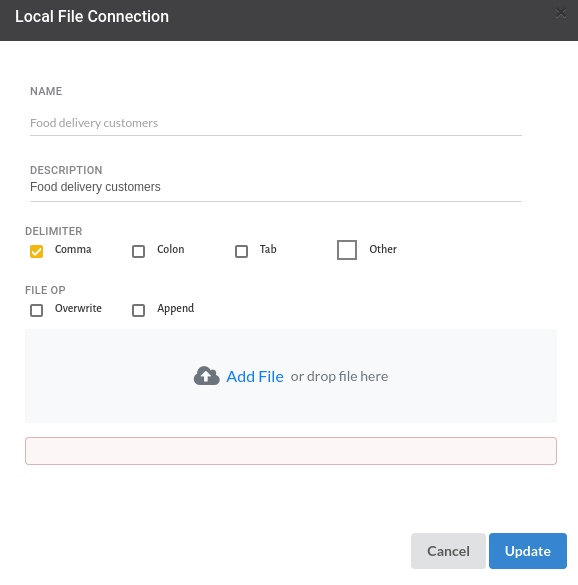
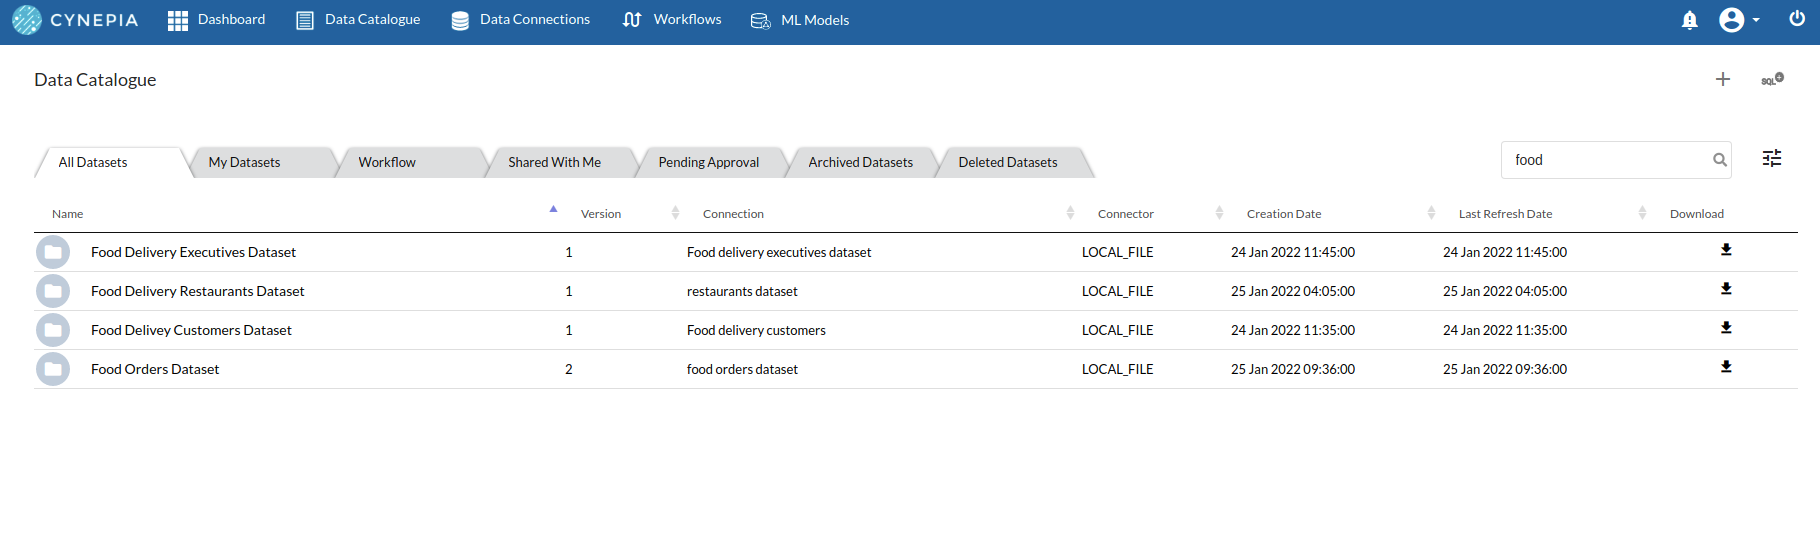
- Create a dataset for each dataset from the uploaded datasource in the data catalogue. Refer to Data Catalogue for more information on how to generate a dataset.
Create the Workflow for the experiment
- Lets Create our Workflow by going to the Workflows Tab in the Navigation. Create Workflow has more information on how to create a workflow.
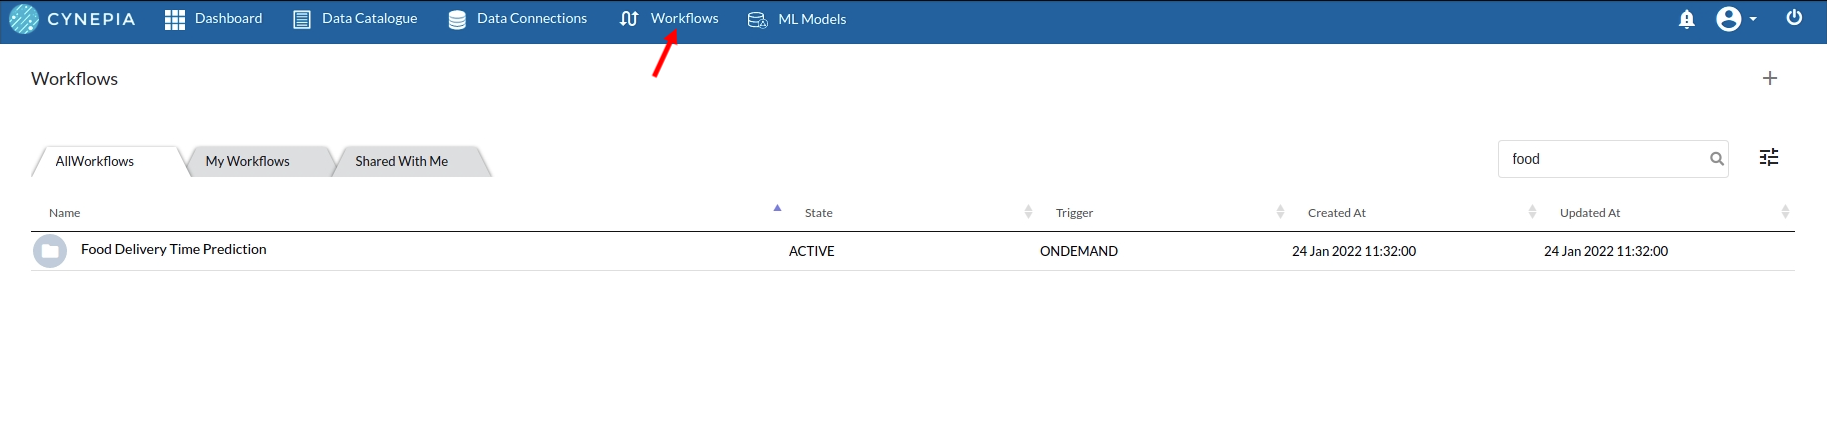
- You will see an entry on the workflow's page listing the created workflow once it's been created.
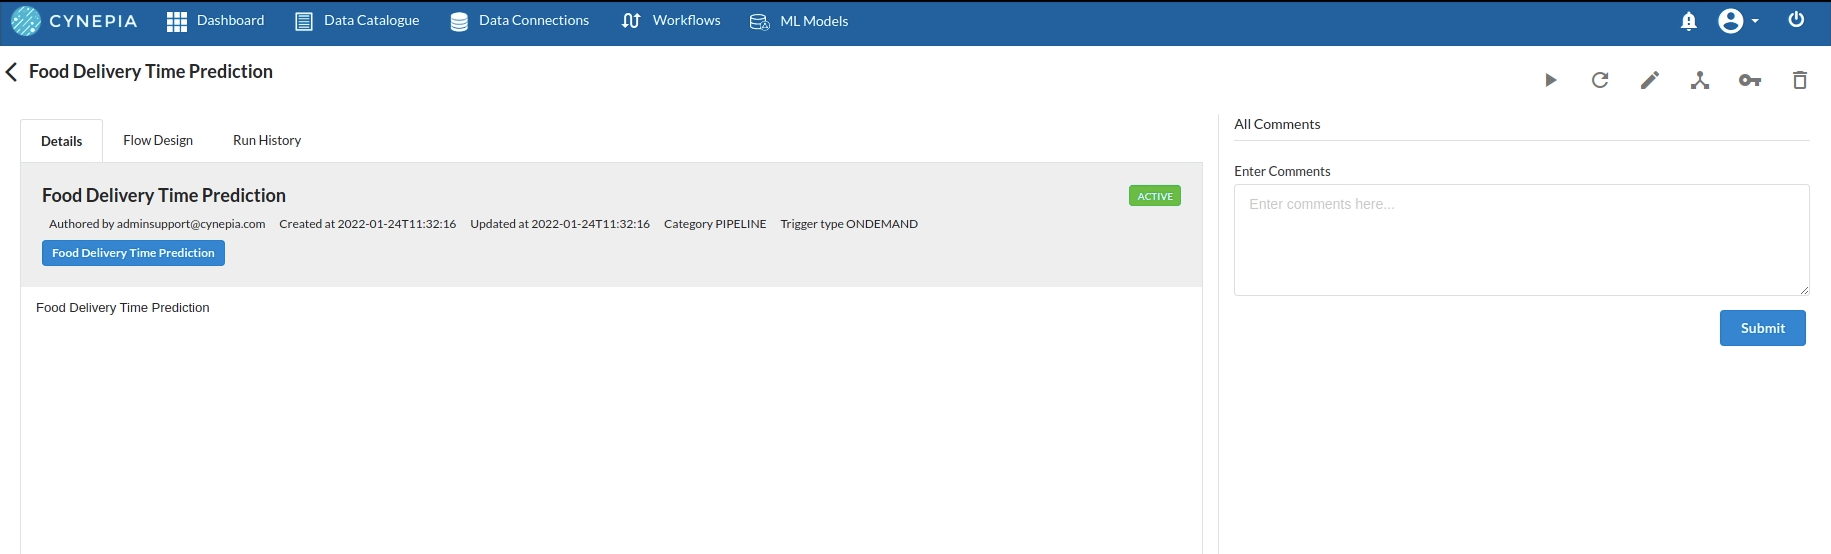
- To navigate to the workflow Details Page, double-click on the Workflow List Item and then click Design Workflow. Visit the Workflow Designer Main Page for additional information.
- By clicking on + icon you can add the Input Dataset to the step view. The input step will be added to the Step View.
Perform initial exploration of data columns.
- Examine the output view with Header Profile, paying special attention to the column datatypes. Refer to Output Window for more information about the output window.
- Column Statistics Tab (Refer to Column Statistics for more details on individual KPI)
Perform Cleanup and Transform Operations
- Final Join
The processor used in this step is Join Tables
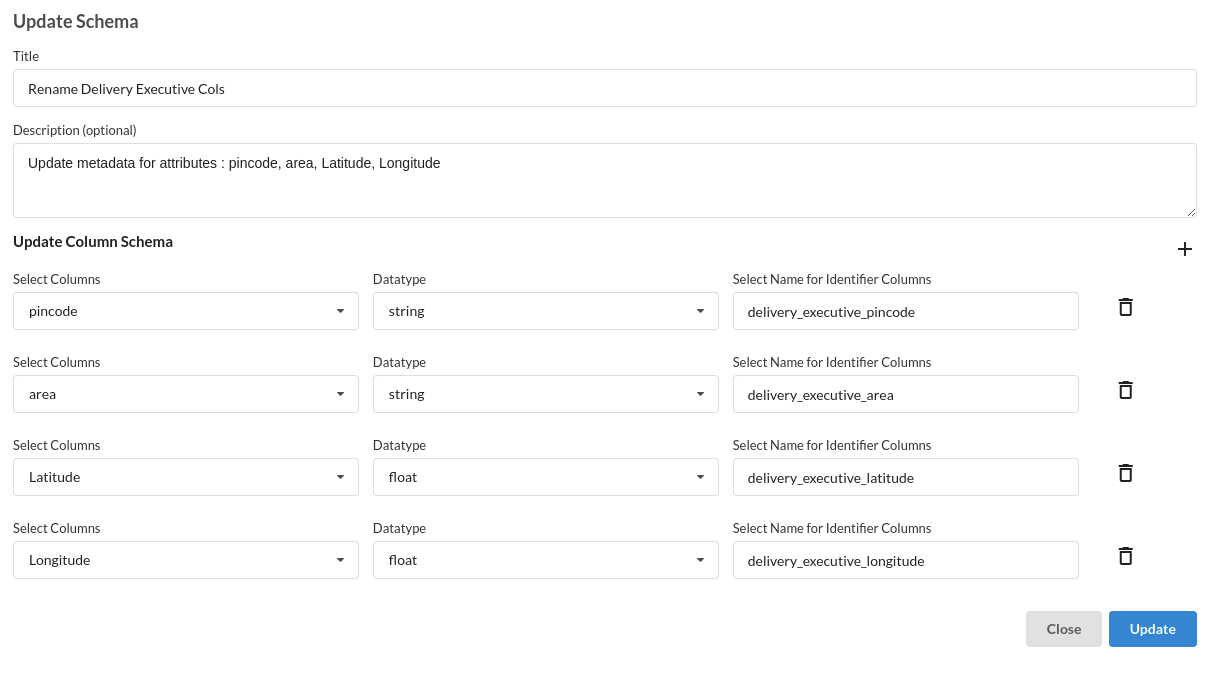
- Rename Columns
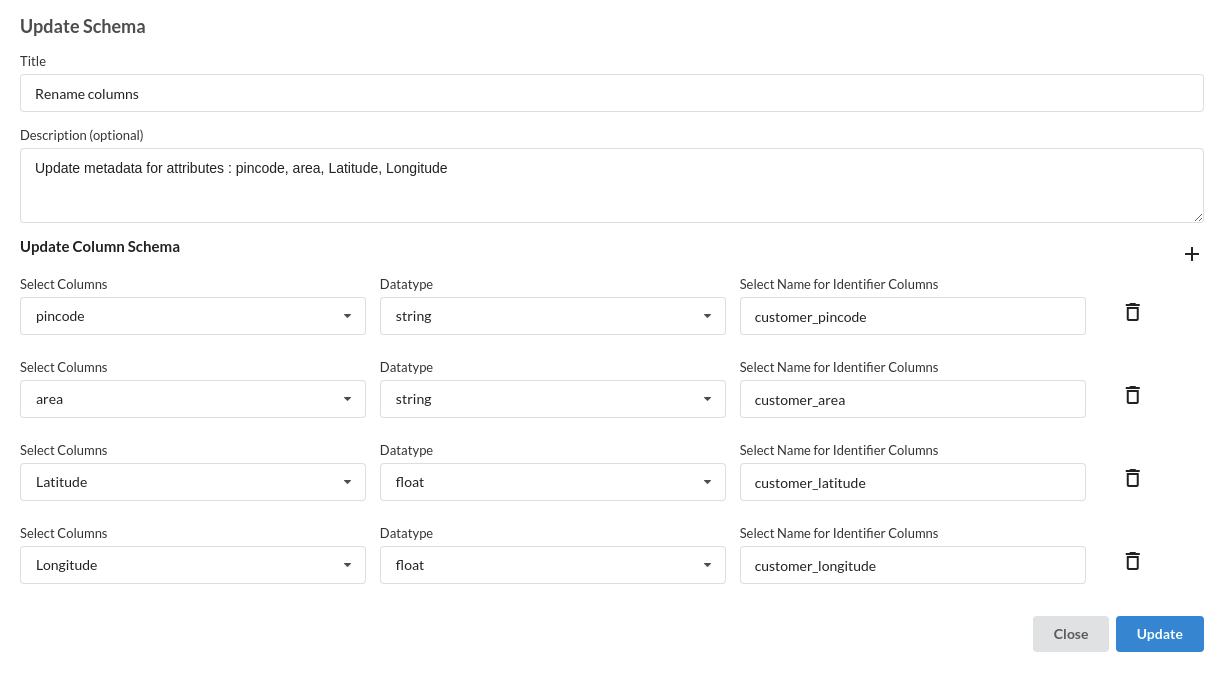
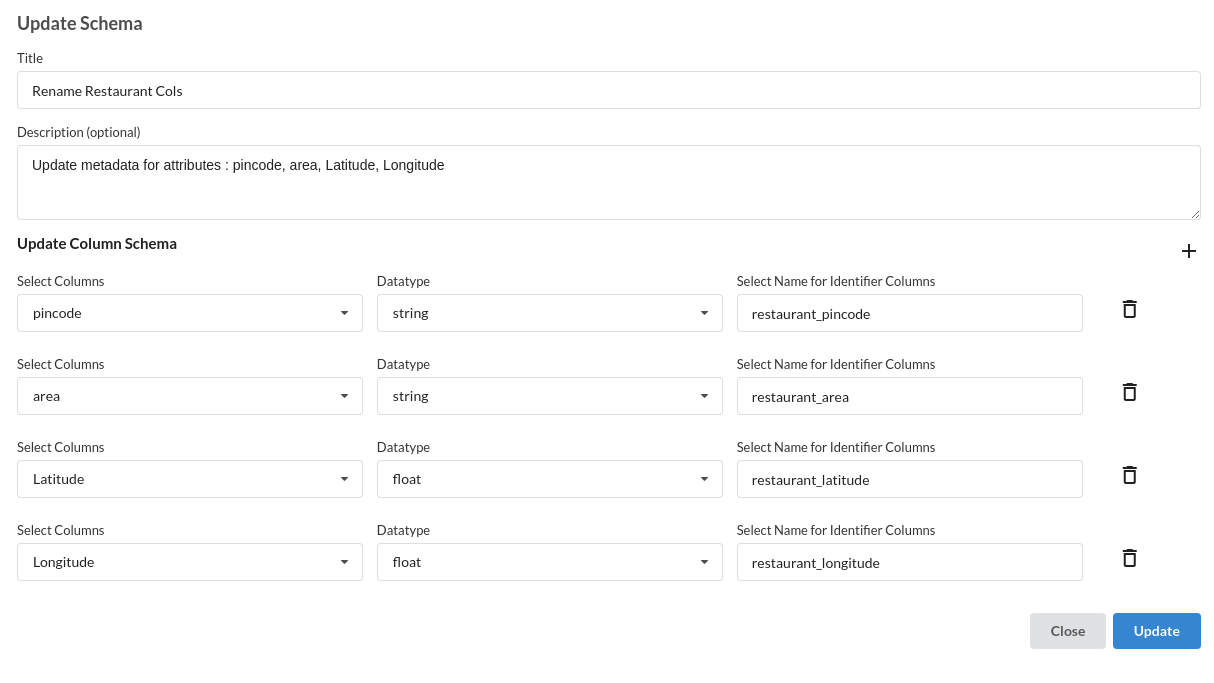
In two different recipes you will have to rename few columns. The processor to used for renaming columns is Update Schema and to navigate through all the recipes you can use the Command Tool Bar
- Drop duplicates
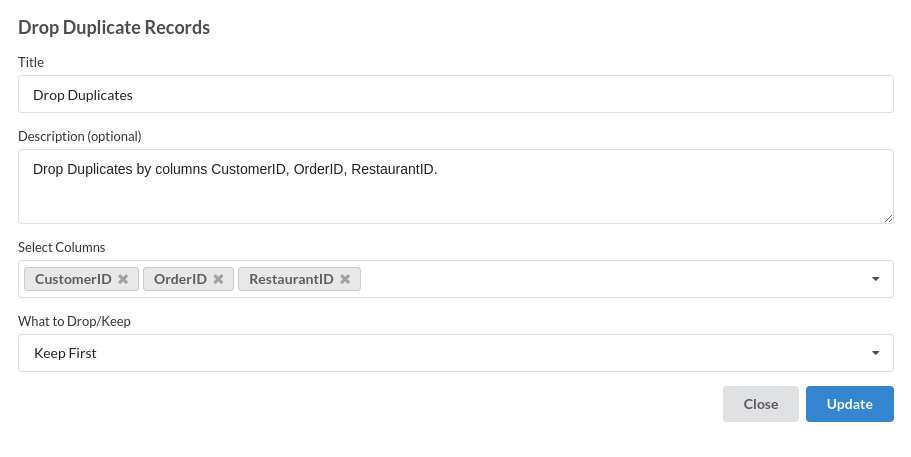
The processor used in this step is Drop Duplicates
- Find and Replace
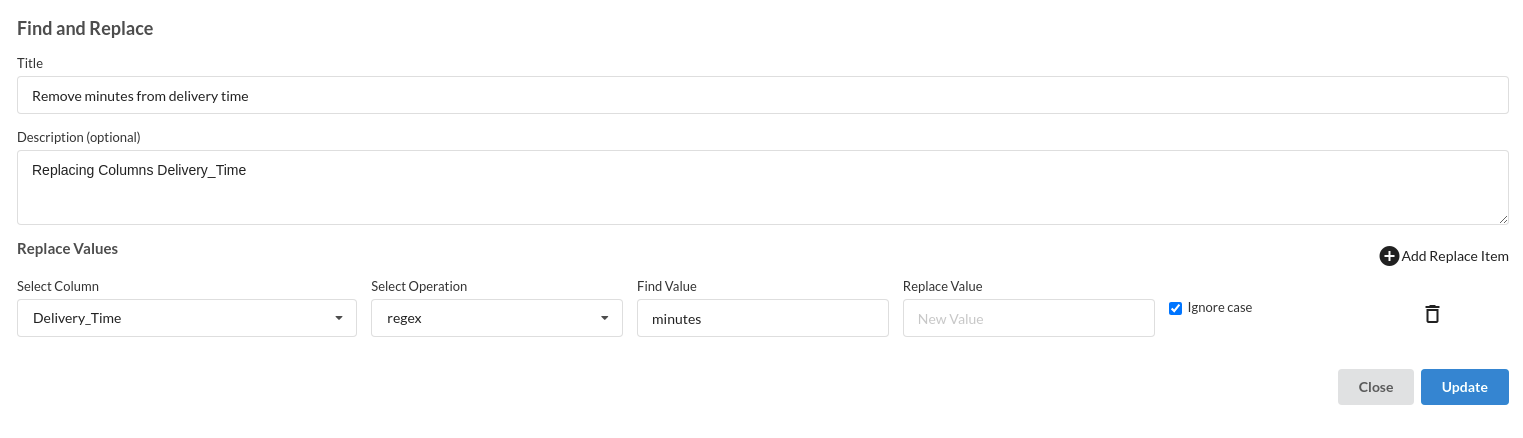
The processor used in this step is Find and Replace
- Update schema
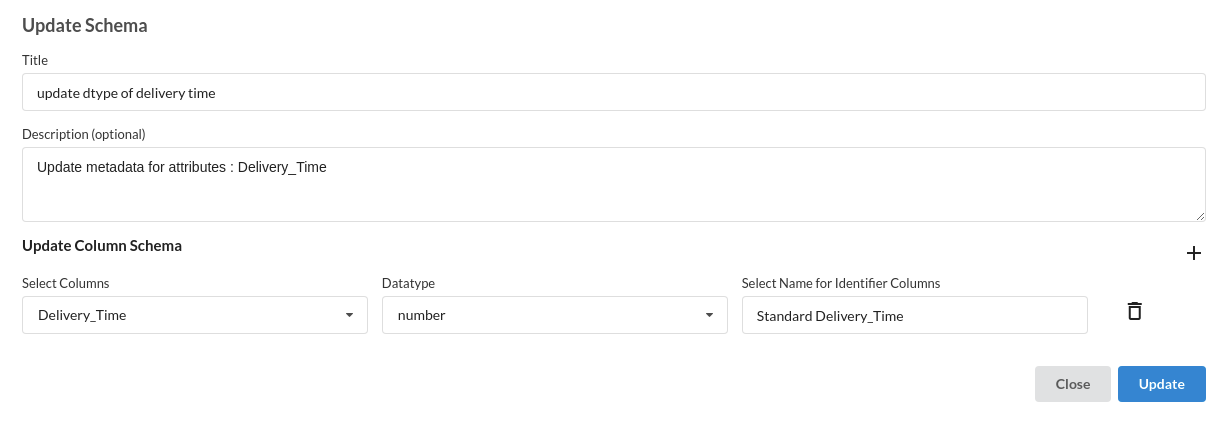
The processor used in this step is Update Schema
- Create Computed Column - Distance
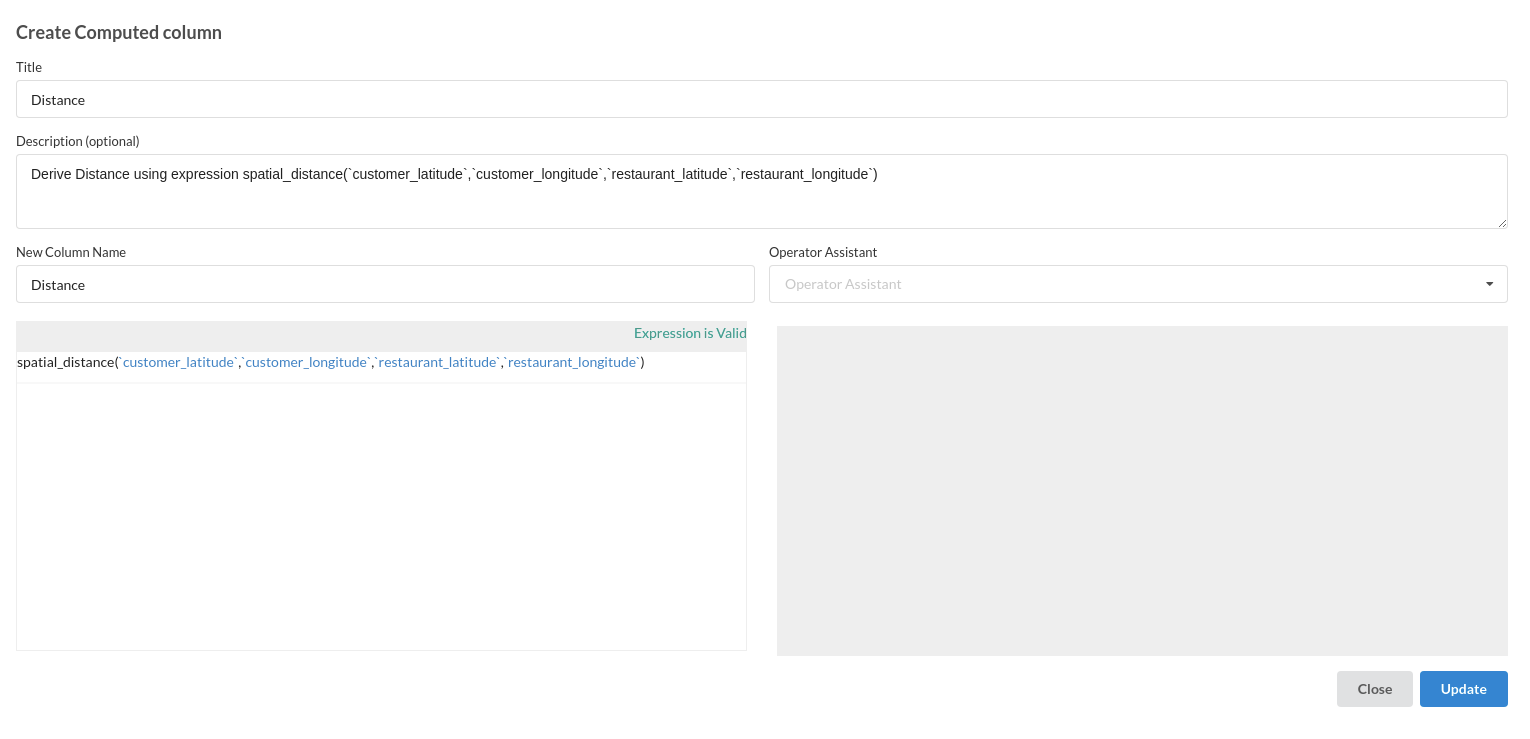
The processor used in this step is a calculate processor and the function used in this processor is Calculate -Spatial Distance
- Add Conditional Columns
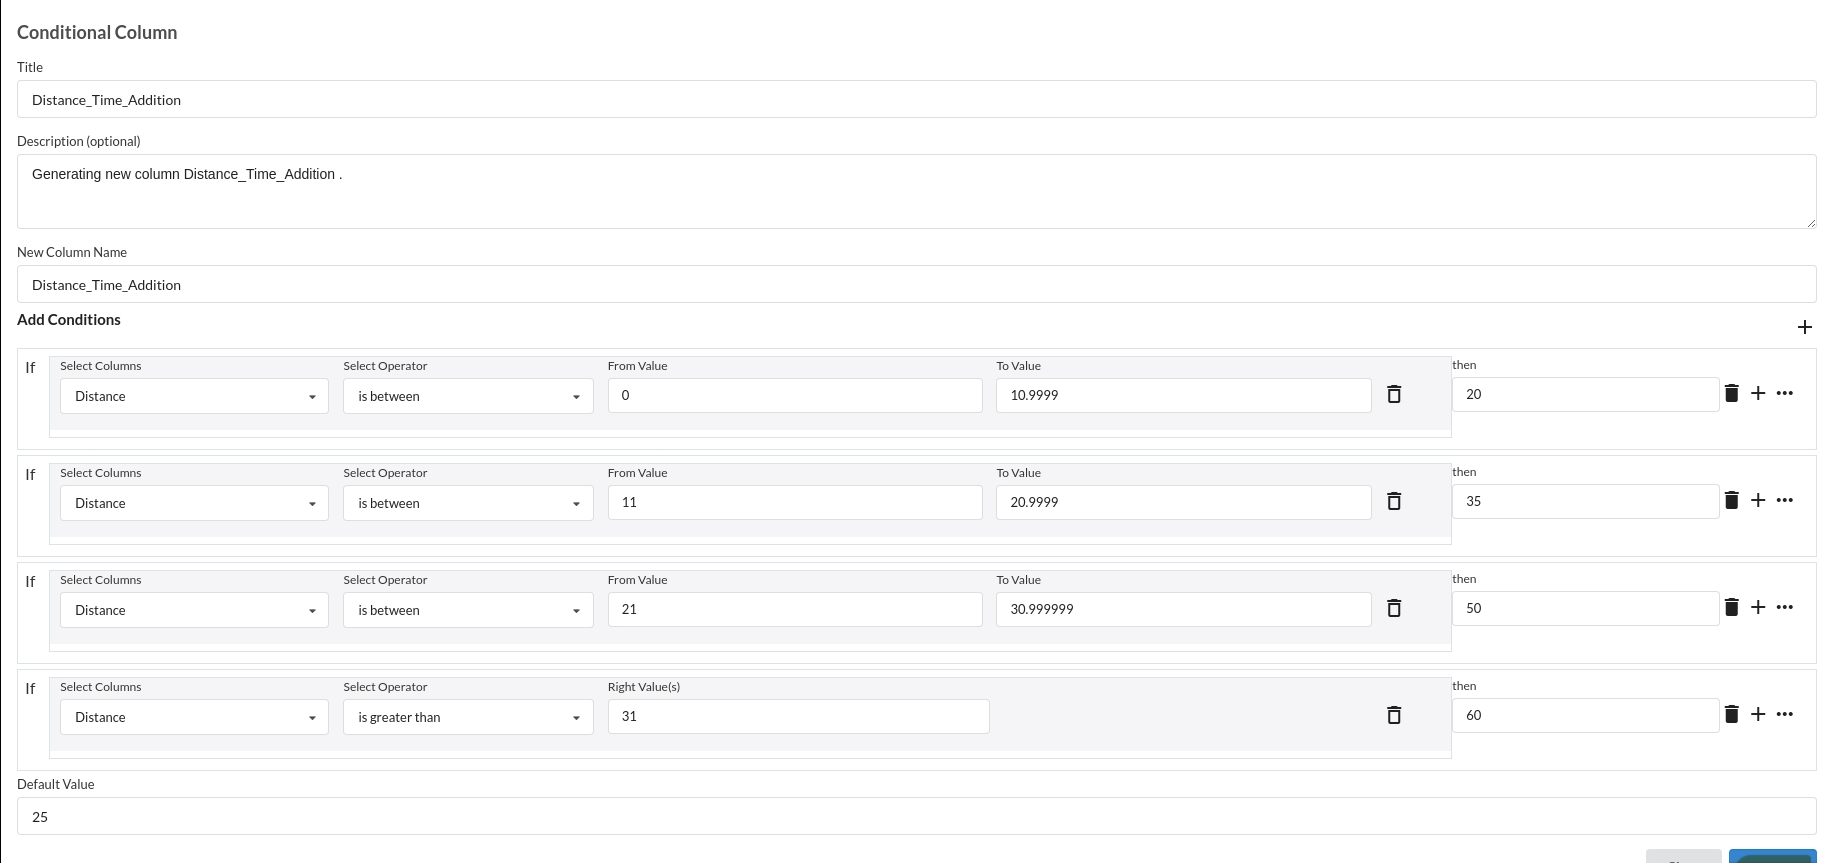
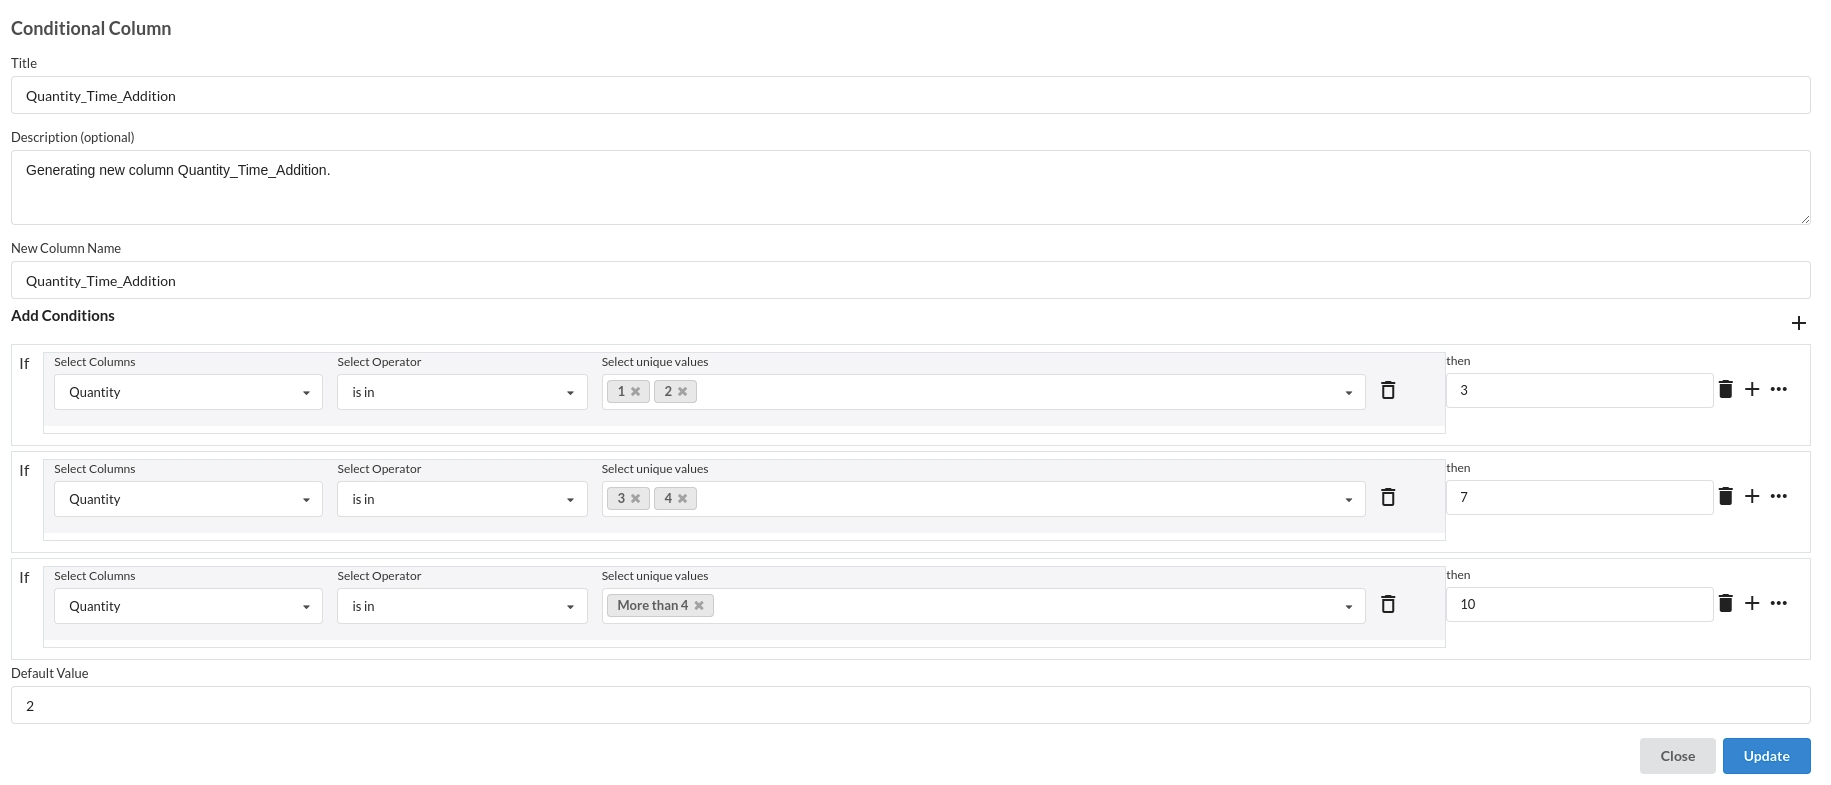
The processor used in this step is Conditional Column
- Create Computed Column - Expected Delivery Time
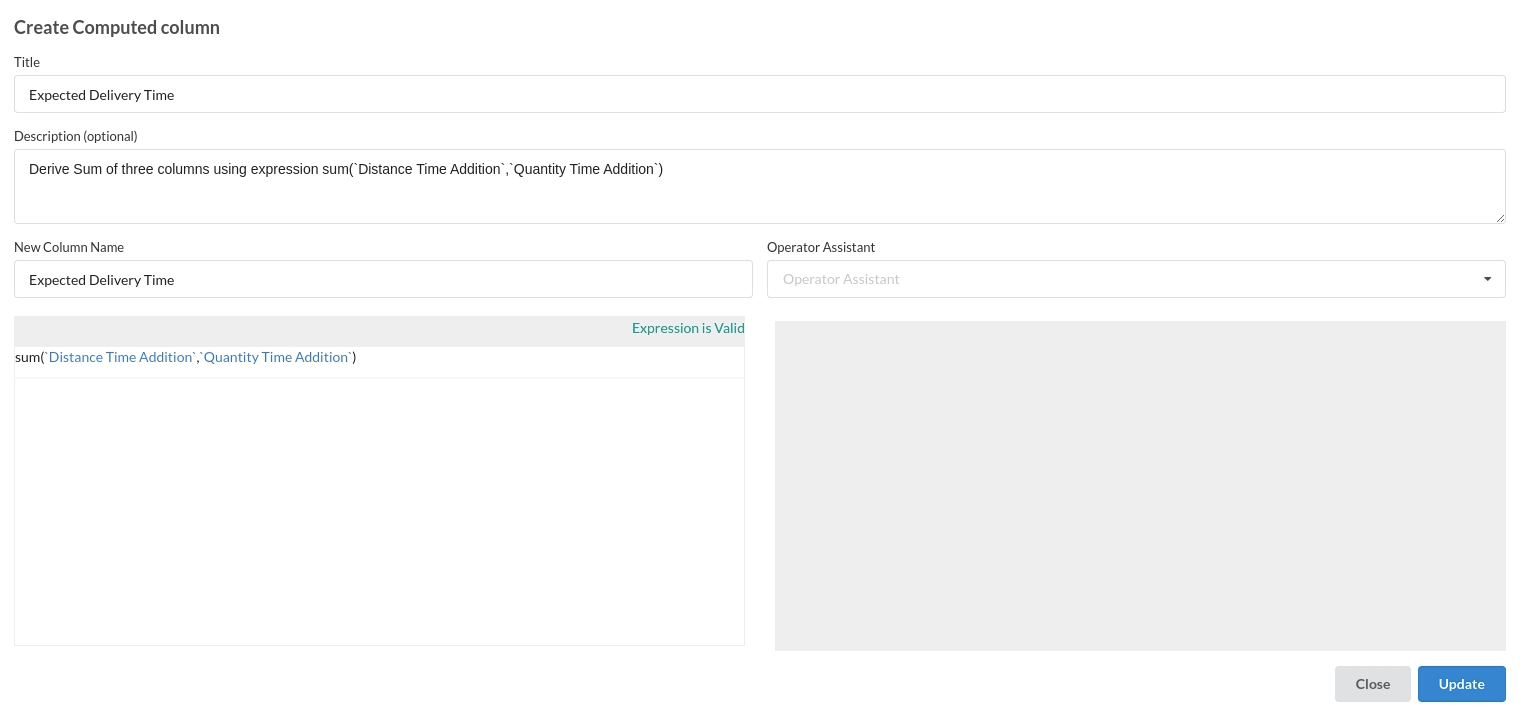
The processor used in this step is Calculate and the function used in this processor is Add
Build/Train a regression Model
- You now have a dataset to work with in order to create a regression model. Some of the actions to take before developing a model are listed below.
- Feature Selection
- Feature Encoding
- Choose the algorithm and train the model.
Feature Selection
- Go to the Column Profile View and select Multi-variate profile to construct a correlation matrix to manually identify the features of interest. The peason correlation is shown by Xceed Analytics. Select all of the columns that are strongly correlating to the target feature.
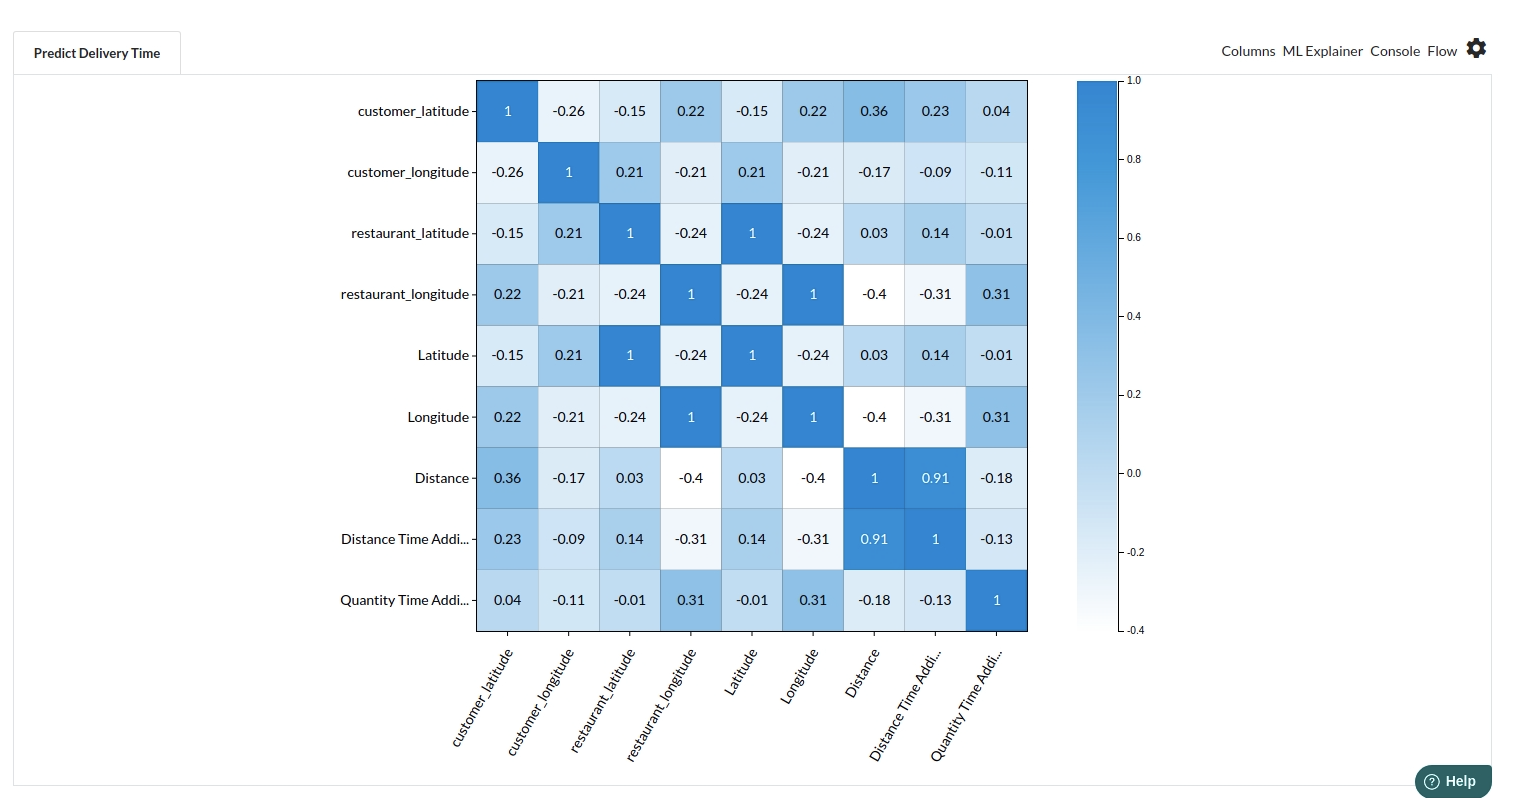
- Some of the features we chose that can explain our target variable based on the observed correlation are:
- customer latitude
- customer longitude
- restuarant latitude
- restuarant longitude
- distance
- distance time addition
- quantity time addition
Feature Encoding
- All features are continuous, so no encoding is required.
Choose the algorithm and train the model.
- Because you will be estimating a continuous variable- production for the prediction model. From the Transformer View, select Regression(auto pilot) and put in the relevant information. Refer to Regression for more information on model parameters (autopilot)
Review the model output and Evaluate the model
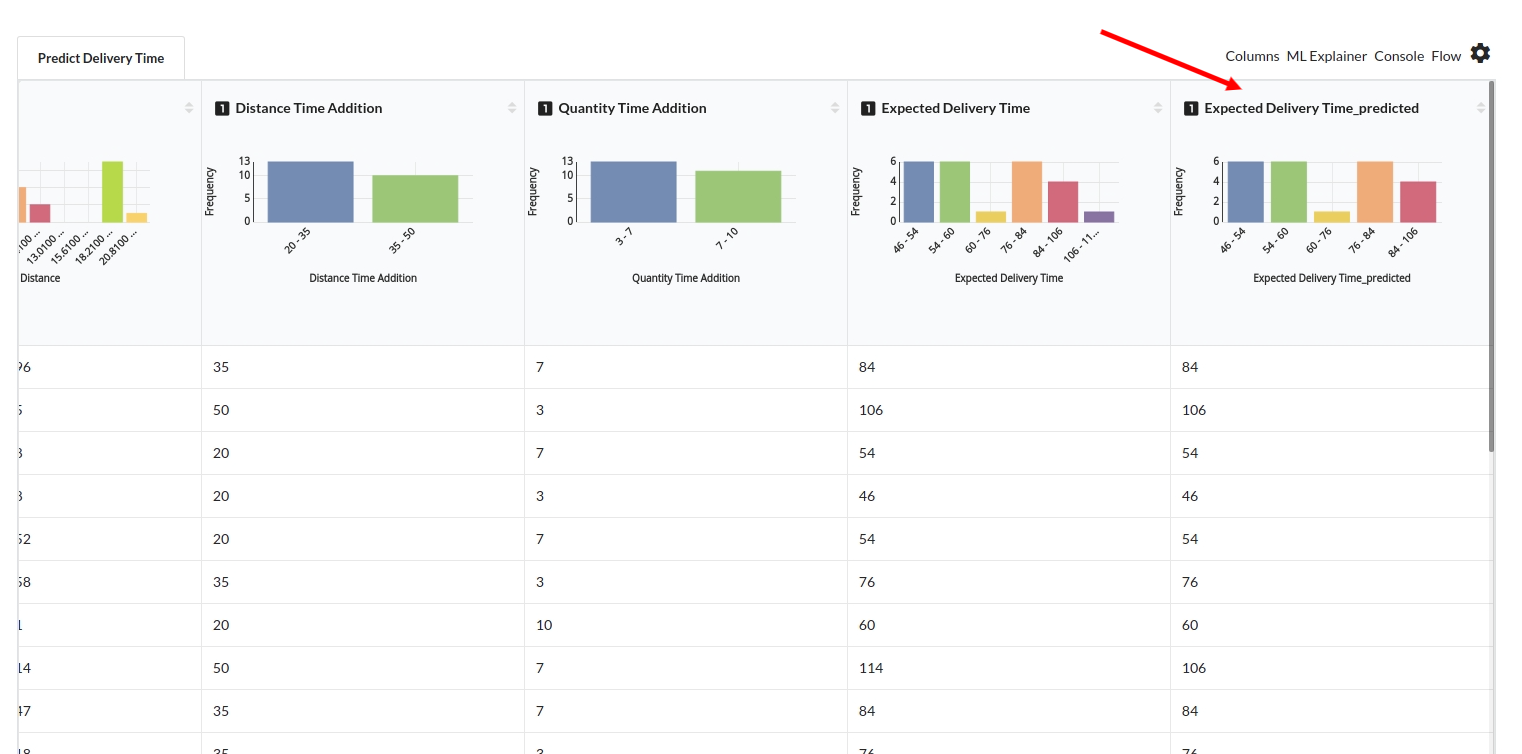
After you finish building the model, it is time to review the model output. Look at the output window to first review your predicted results .Since this is a regression problem you will get a new column in the view like the one below.
When you finish building your model you will see another tab in the view called Ml explainer . Click on that to evaluate your model.
- The first view you see when you click on ML explainer is the Summary view
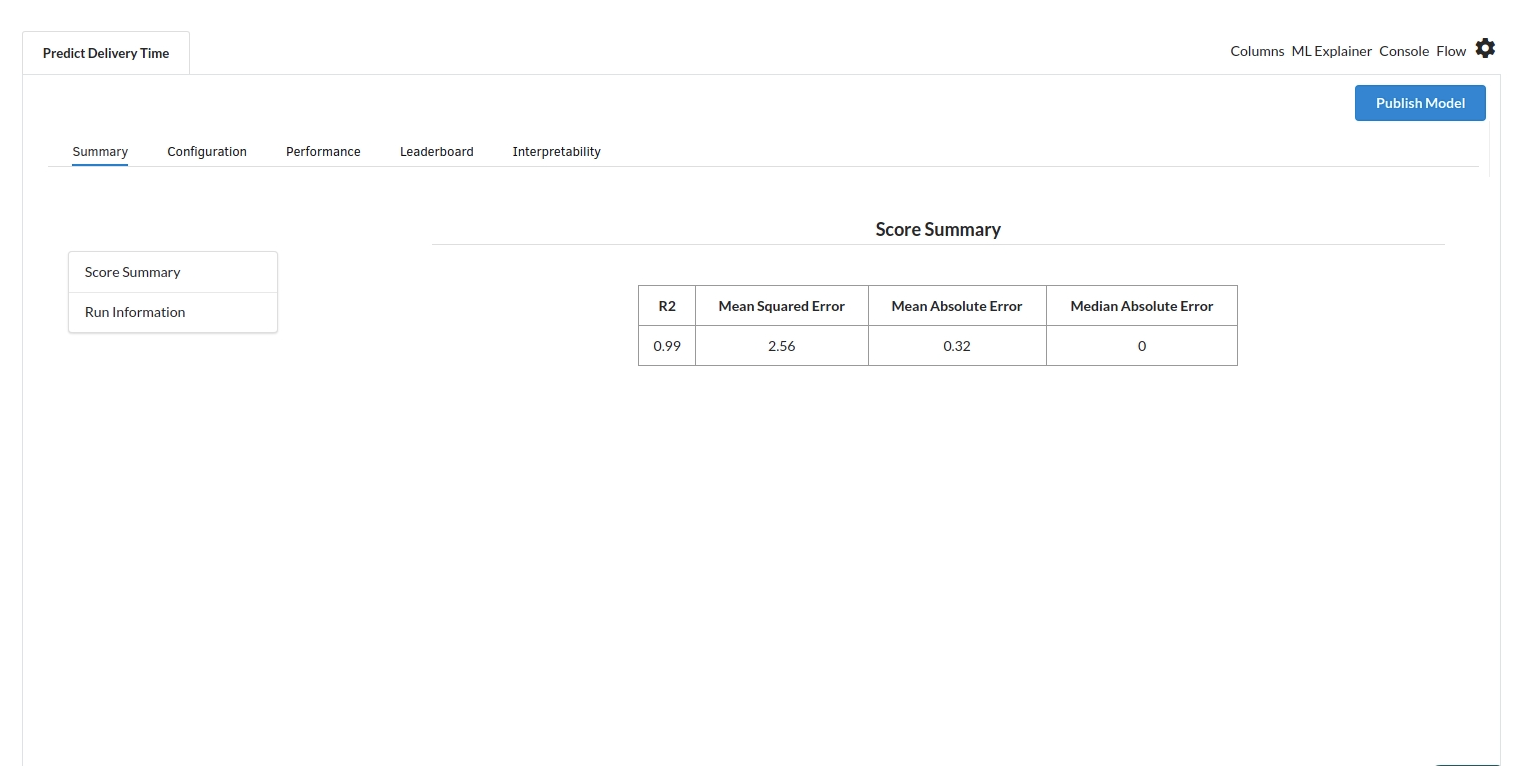
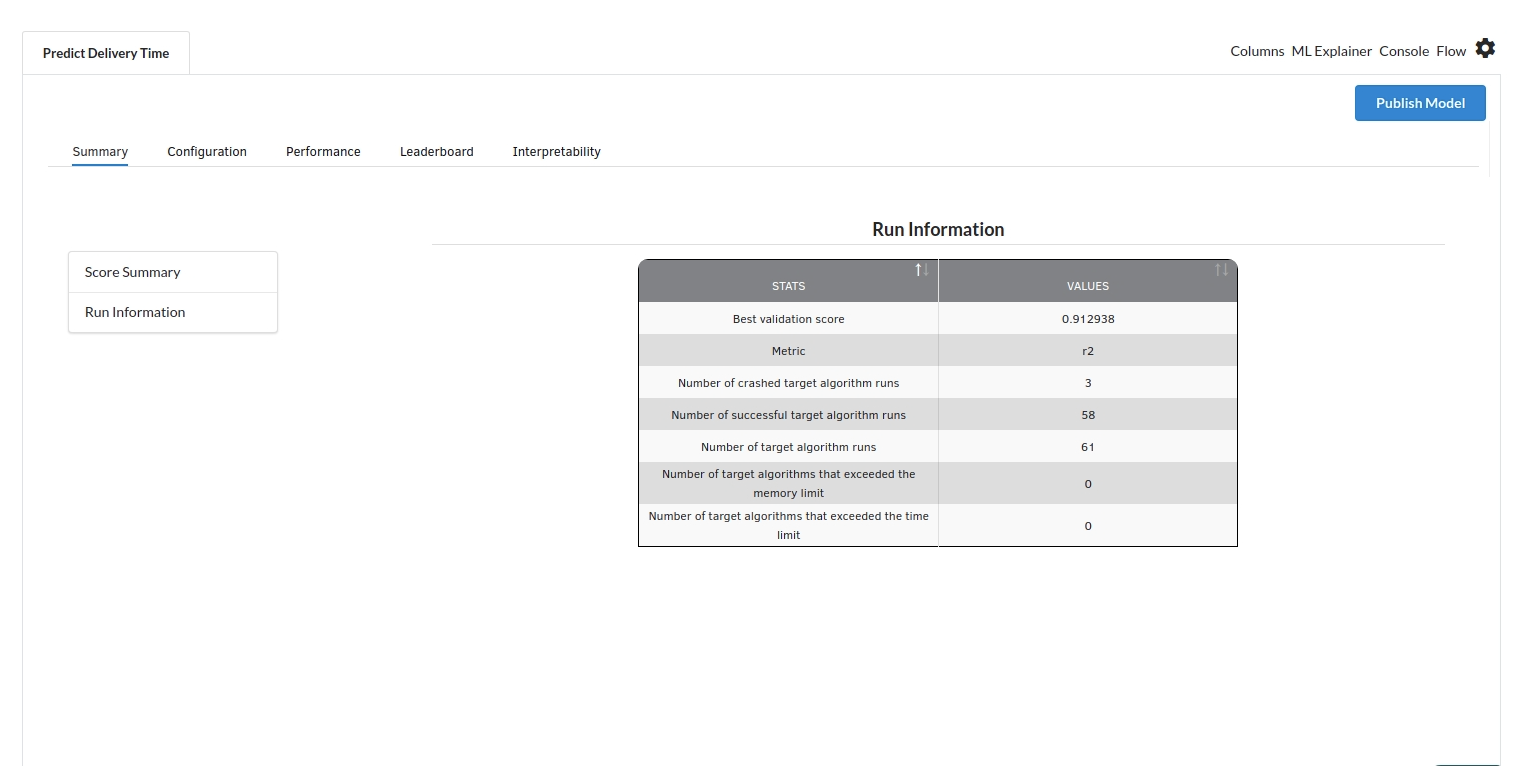
Look at the metrics score and the Run summary stats. Based on your calculations decide if the R2, mean Sqaured Error and Mean Absolute Error are according to your expecation. if not this will be your first step to rethink the training process.
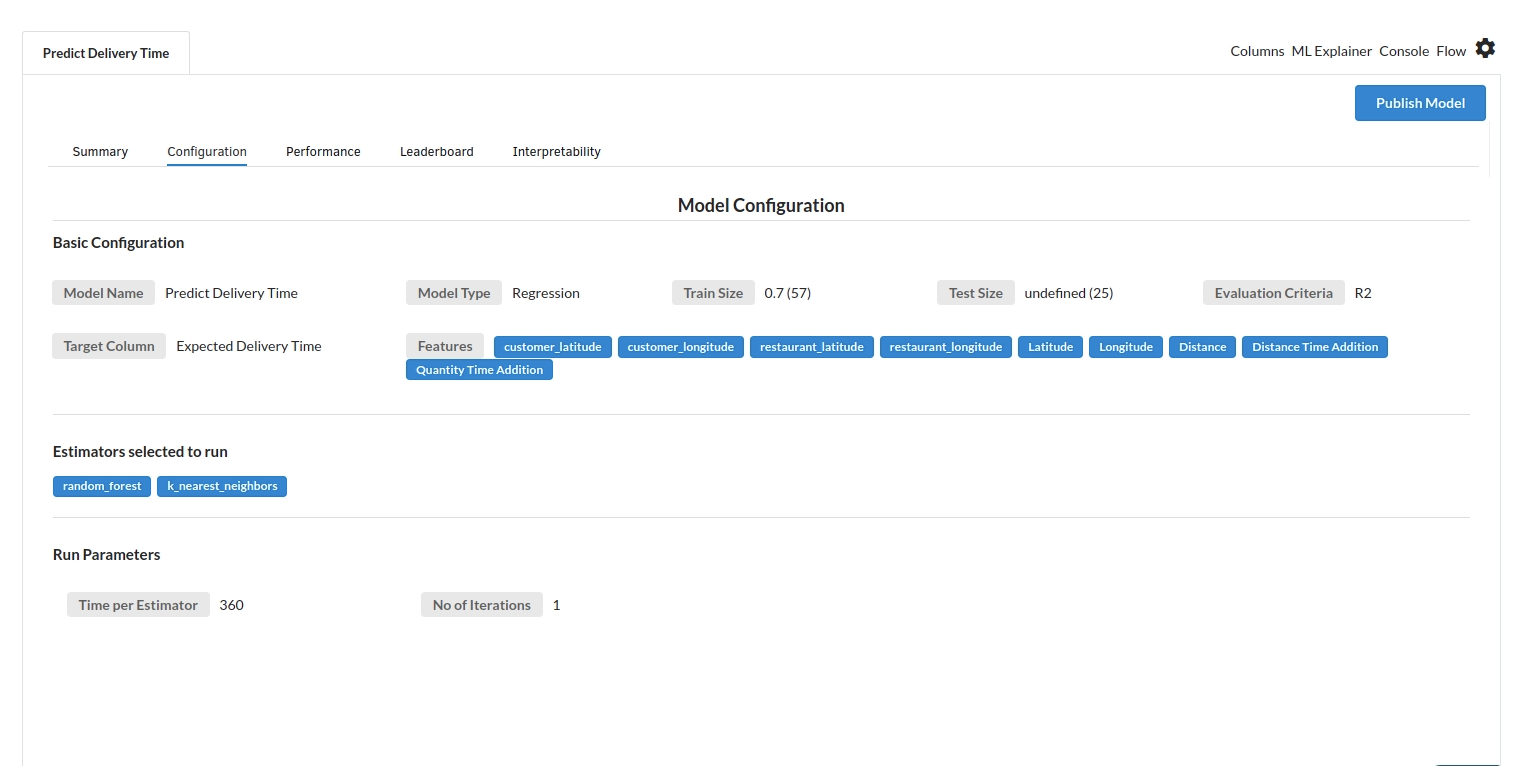
- The second view under Ml explainer is configuration view
The configuration view will give you the information about the step you filled in the Regression step . The view would look like the one below.
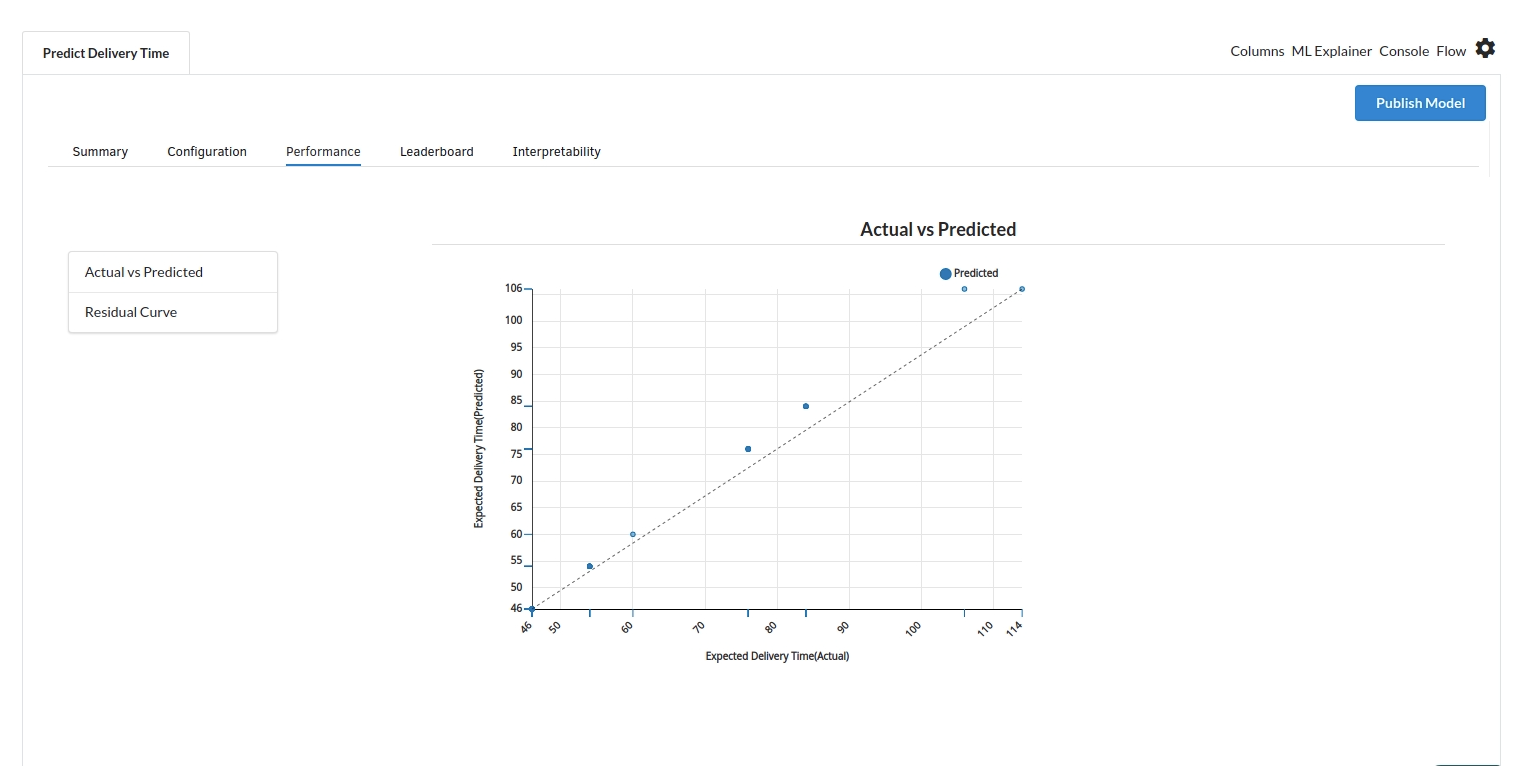
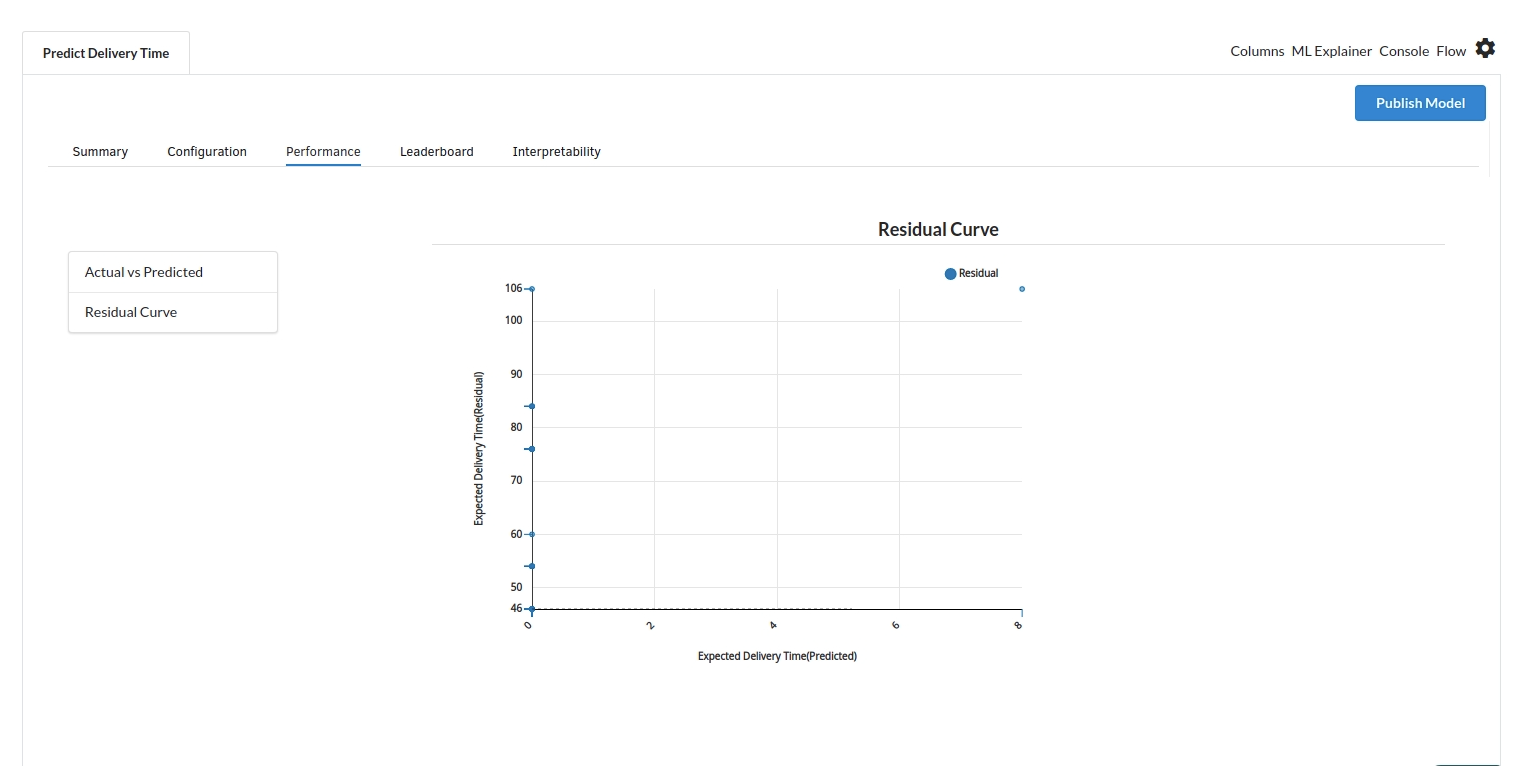
- The third view under Ml explainer is Performance View . You can see the actual vs predicted and the residual curve charts for regression. Look at the built charts and decide if the charts are good enough for your model. The actual vs predicted chart is a good indicator to understand how well your model was trained .
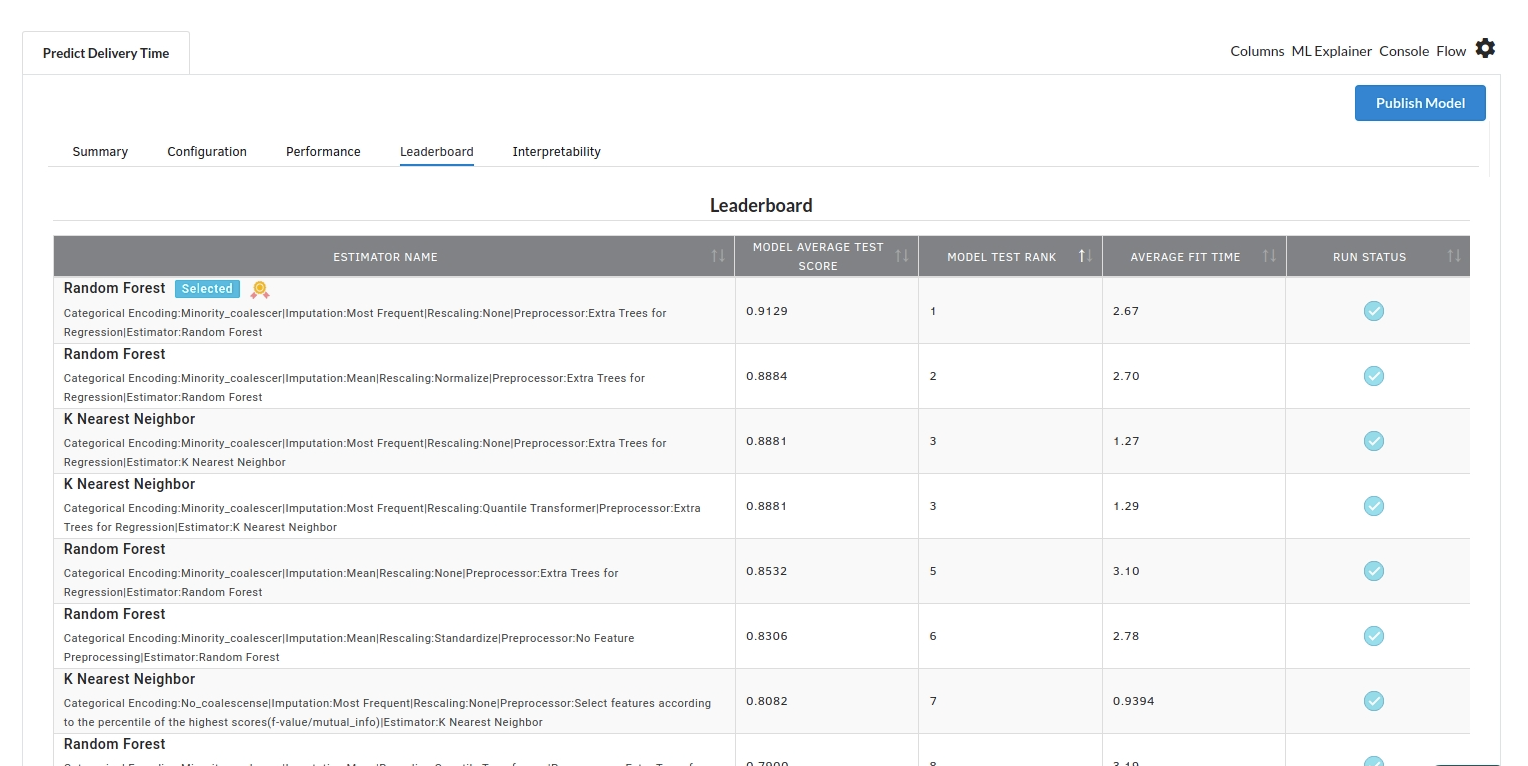
- The fourth view under Ml explainer is Leaderboard . In this view you can see the number of algorithms trained and all the feature engineering done on the algorithms used with ranking system to rank the best algorithm trained.
- The last view you see under ML explainer is Interpretability . In this view you will be able to interpret your model in simple terms where you will be getting results pertaining to feature importance , PDP Plots , Sub Population Analysis , Independant Explanation , Interactive Scoring . for more infomation on these results , refer to Interpretability . The Interpretability tab and the results under this tab would look like the one below.
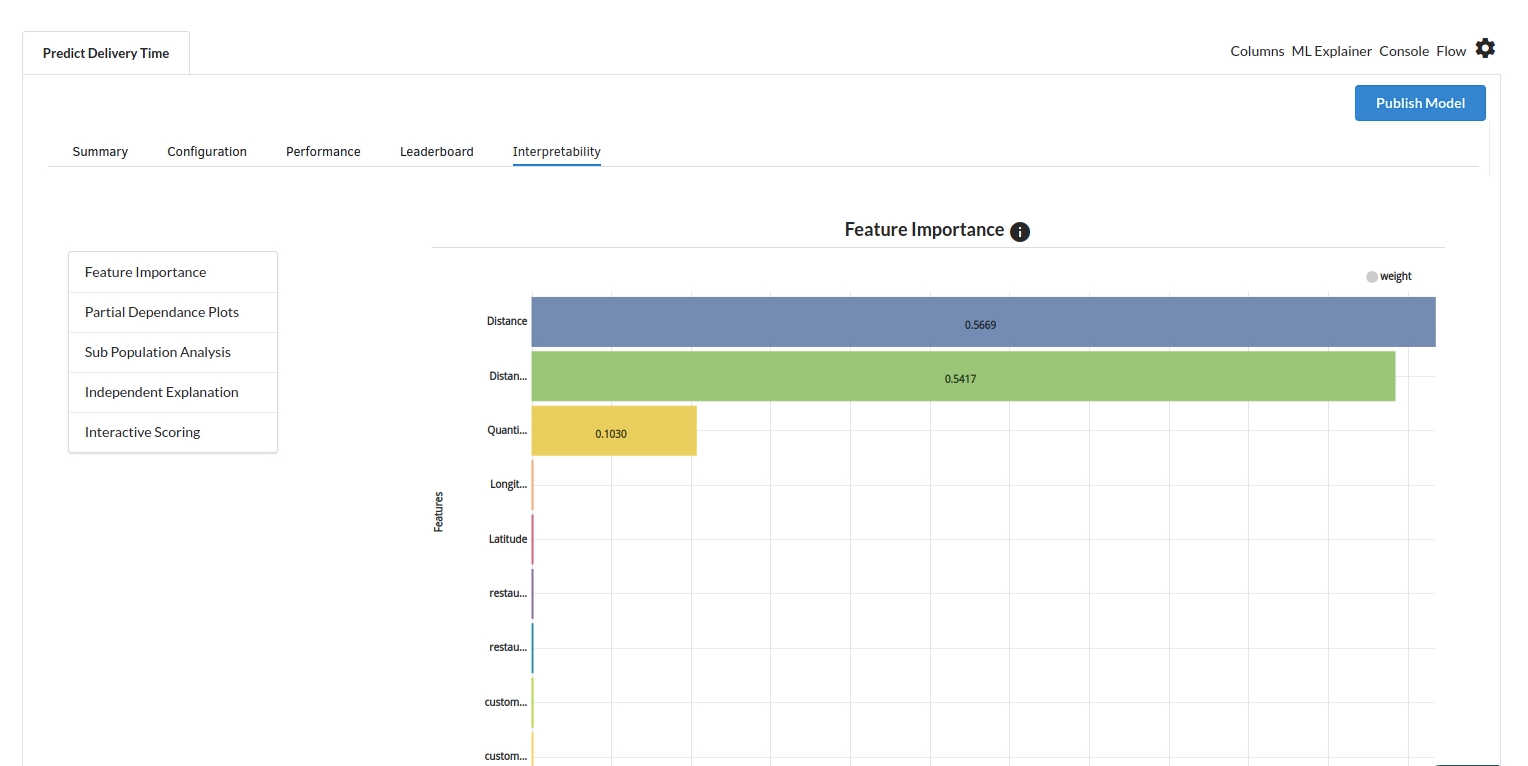
192,1 93%