Result Window
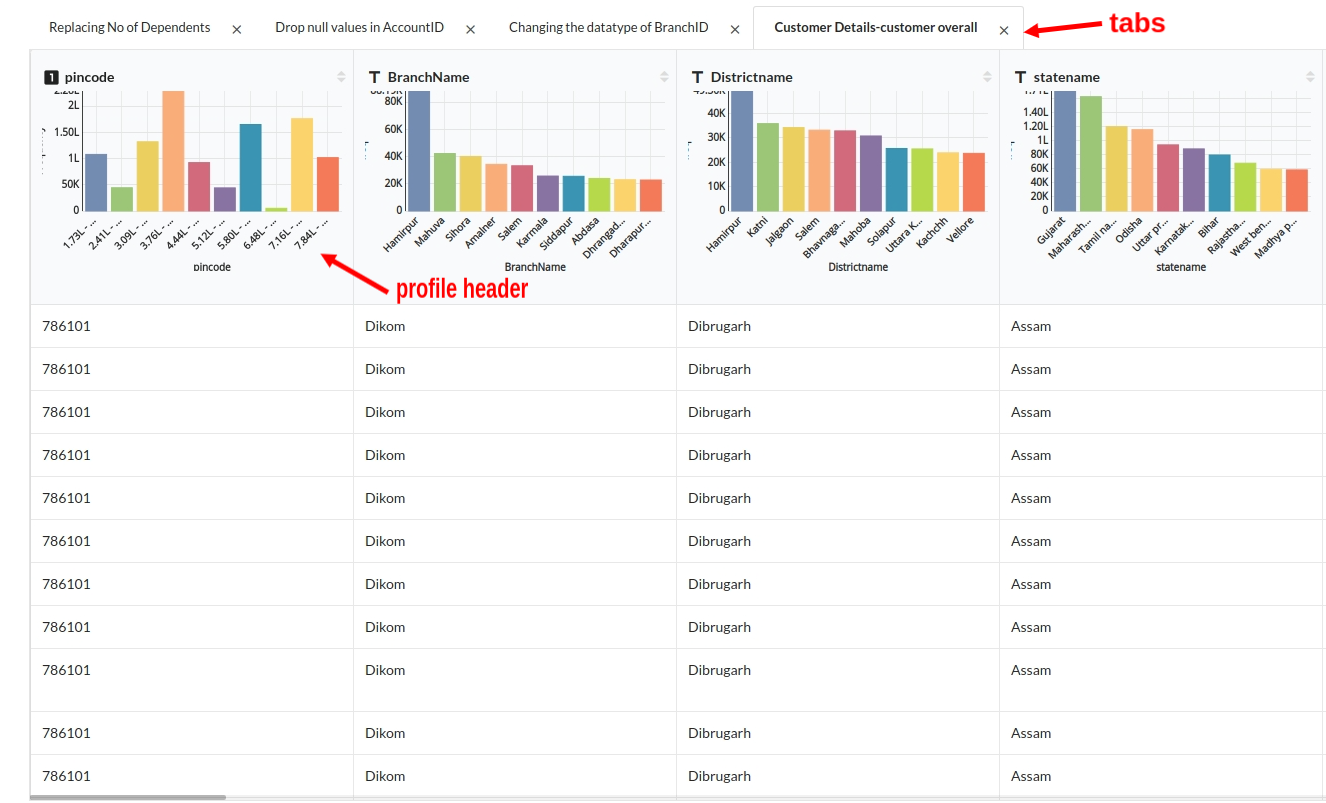
The Result Window View is where you see the dataset and all the updated results. It consists of a header profile ,tabs of all the opened datasets and column datatype.
[add output window picture]
Sub views under Output window.
Column datatype
Looking at all the columns you will be able to differentiate the column datatype .
- For a Numerical column the datatype symbol is the 1 which is seen beside the column name.
- For a Categorical column the datatype symbol is T which is seen beside the column name.
- For Datetime column you see a calendar symbol beside the column name.
Profile Header
This section of the result window which helps you understand the distribution of the data through bars charts, frequency i.e count of a certain value in a column .
- Most of the values you see in numerical columns are binned in equal distributions.
- In Categorical columns you will see the top 5 or to 10 frequently seen values with their count.
[gif of the profile header with cat and num variables]