Introduction To Designer Main Page
This is the main designer page where you design your recipe flow to create new output datasets. The designer page is partitioned into various sub-sections. These sub-sections are as below:
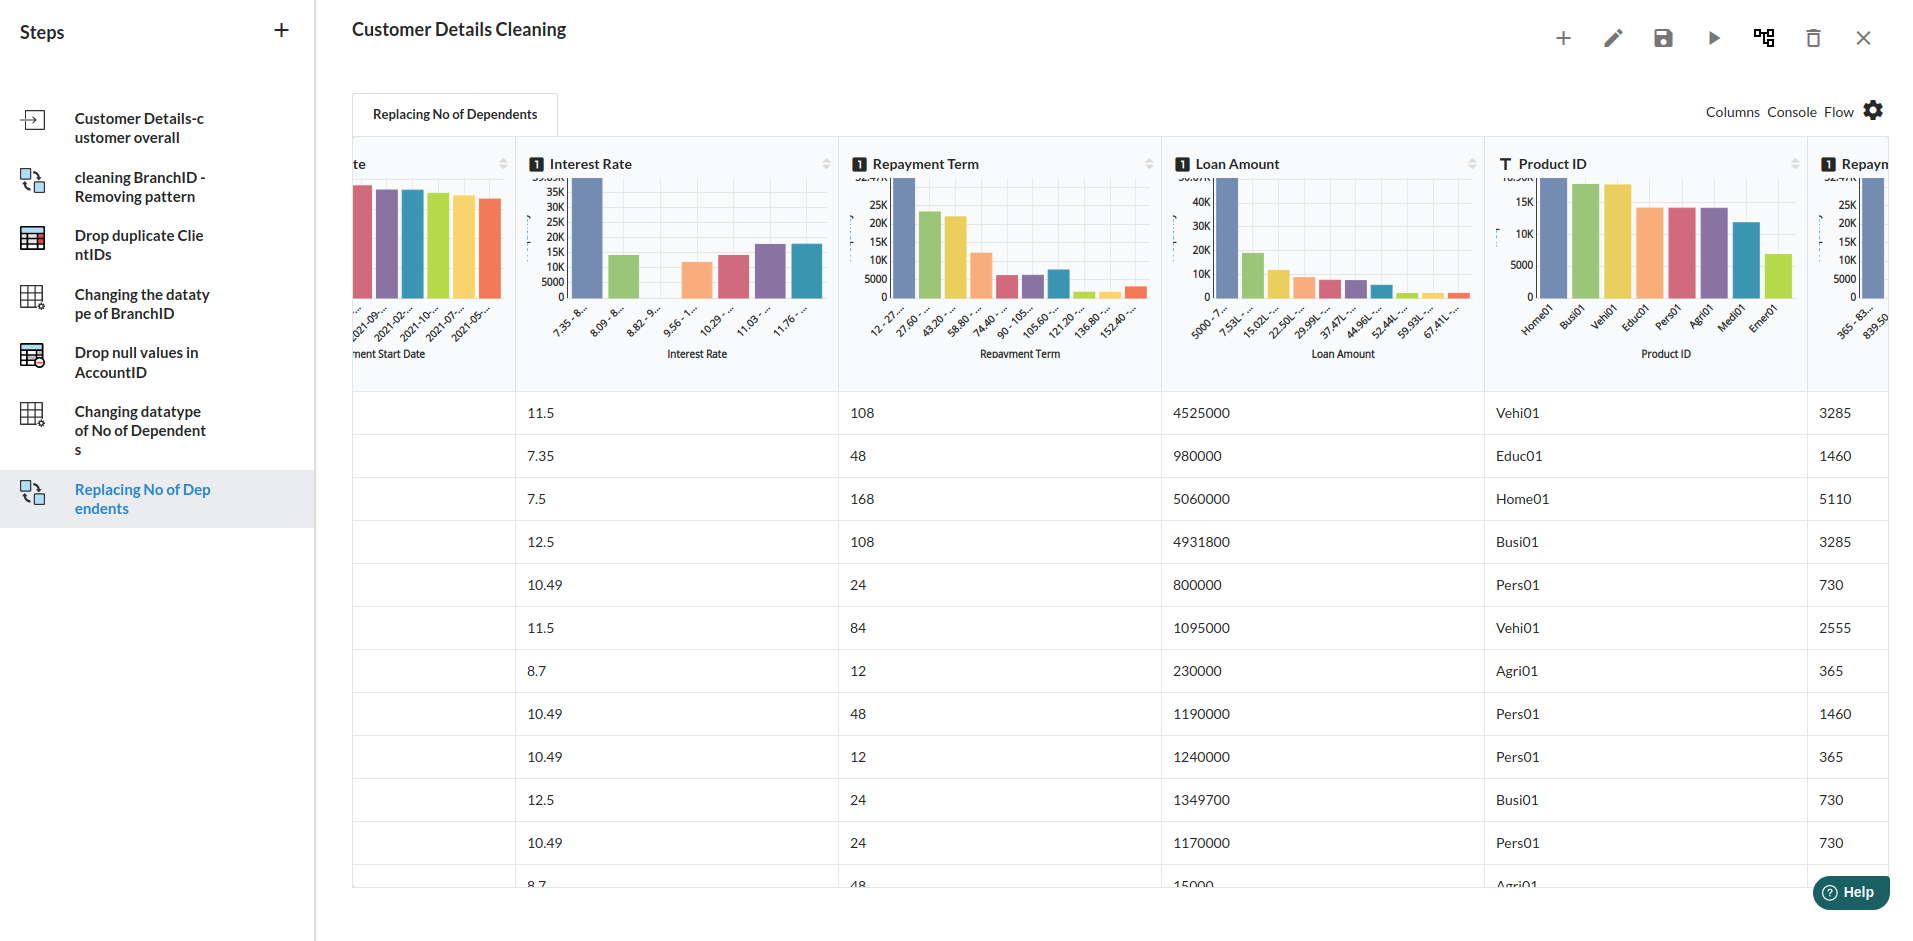
Steps View
Steps View is the left-most pane of the designer page. It lists all the steps that are part of this recipe flow. There are various operations that you can perform at a given step. To see the operations you can perform at a given step, hover on the step. You will see three dots(...) next to the step. Click on the (...). You will see the operations as shown below:
For more details on Step View Operations, refer to Steps View
Command Tool Bar
Command Tool bar is the top right pane of the designer page. It lists the options that you perform at the global workflow level, such as save the workflow, add a new recipe, edit a recipe etc. For more details on Command Tool Bar, refer to Command Tool Bar

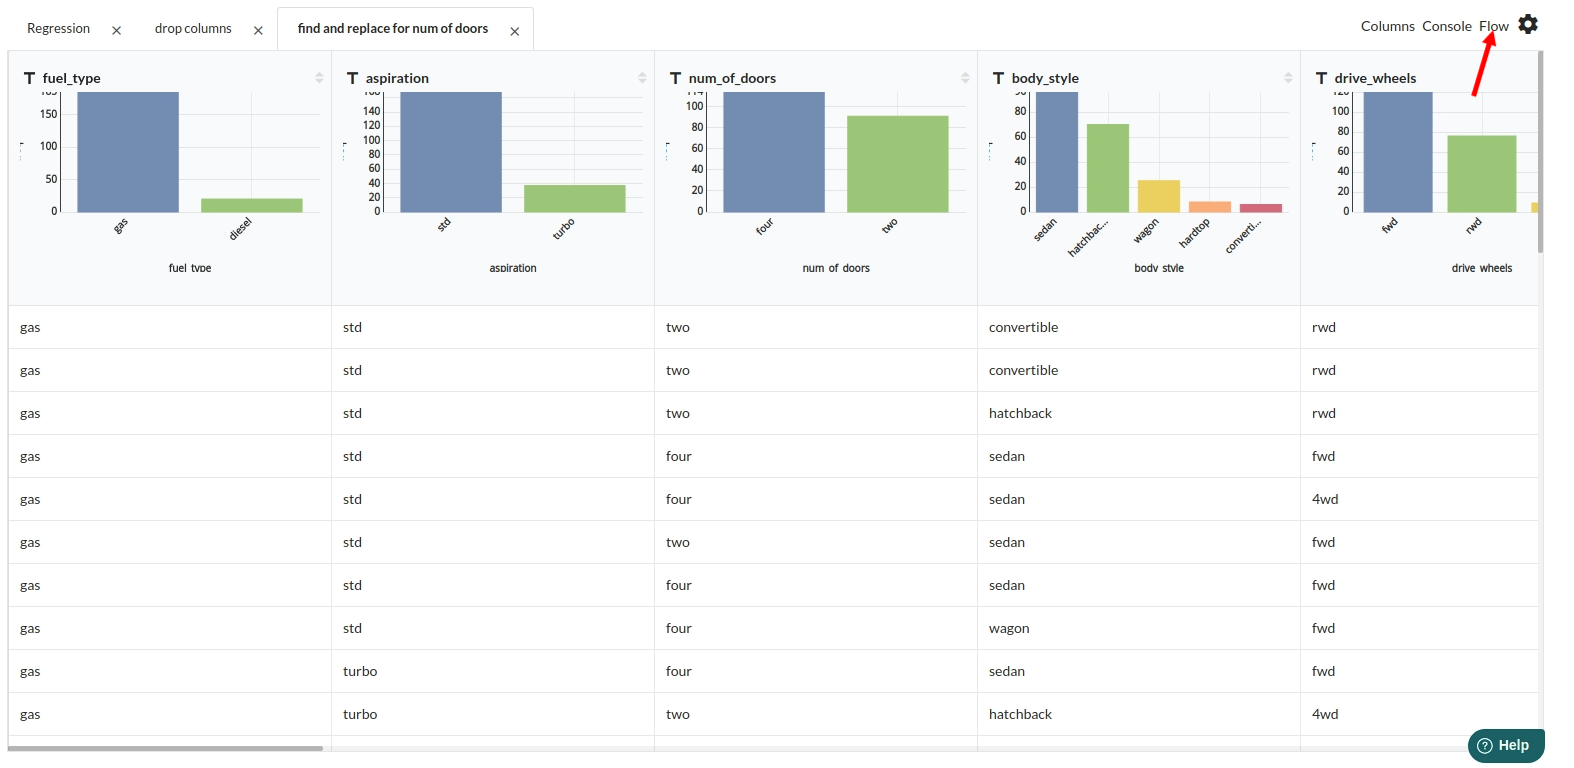
Output Window
Output Window is the central panel of the designer page. Output Window Constitues the following widgets:
- Tabbed View - Lists a set of open processor result view tabs. By default, it lists the current step result in the result view.
- Columns - Lists the columns in the step and enables you to review univariate and multi-variate statistics
- Console - Lists the overall workflow run logs. The logs can help you isolate steps in case of error.
- Transformer Panel - A list of Transformers that can be included in the recipe flow.
- Flow - Visual flow representation of the recipe using block presentation.
- Result View - This view is updated based on the tab selected above. By Default it shows a preview output dataset for that step. The tabular view seen in the result view, represents the resultant dataset from the step. The tabular view also shows column histogram in the header rwo of the view.
For more information on Result View view, refer to Result View
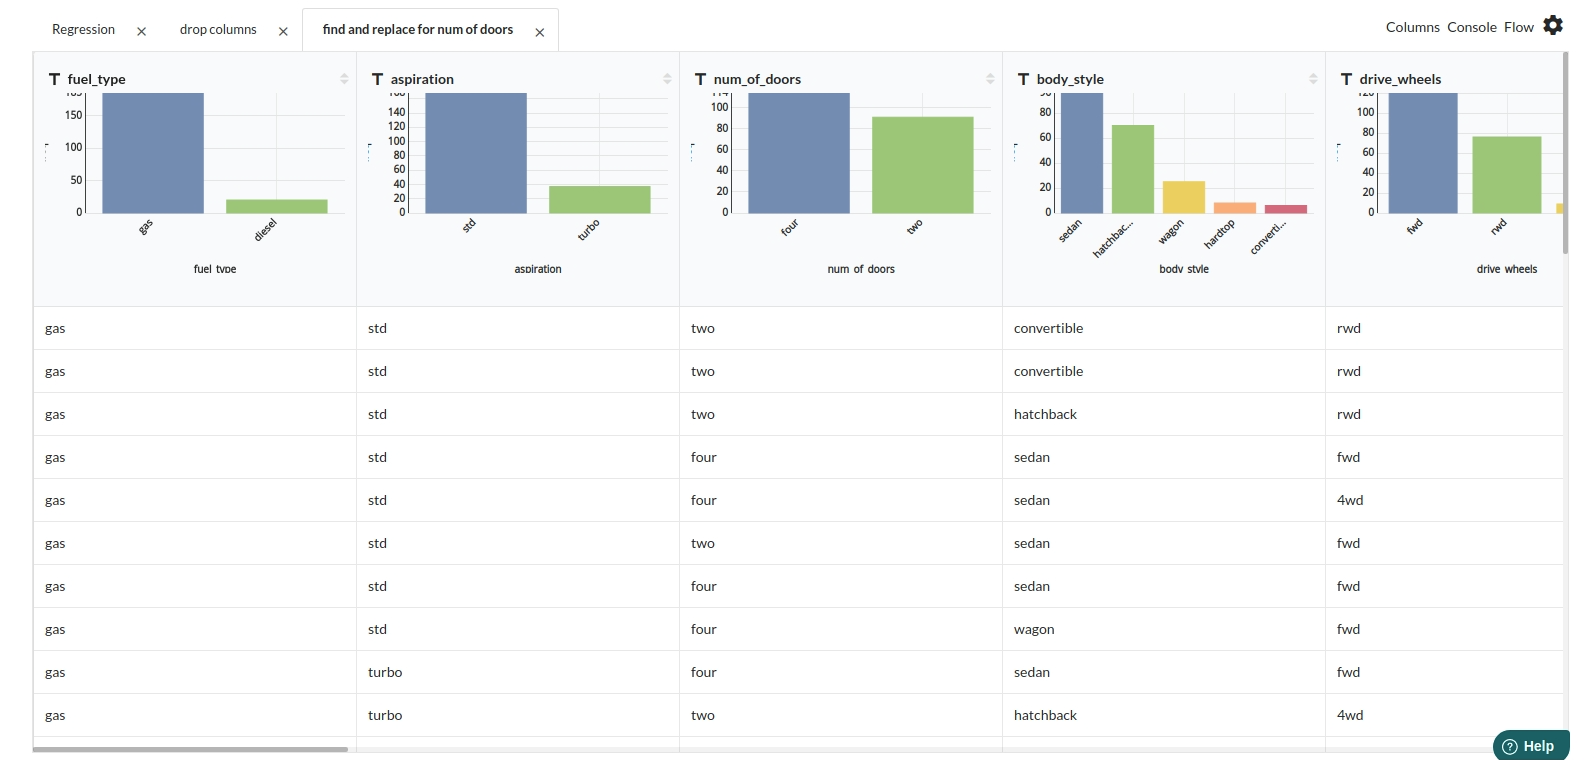
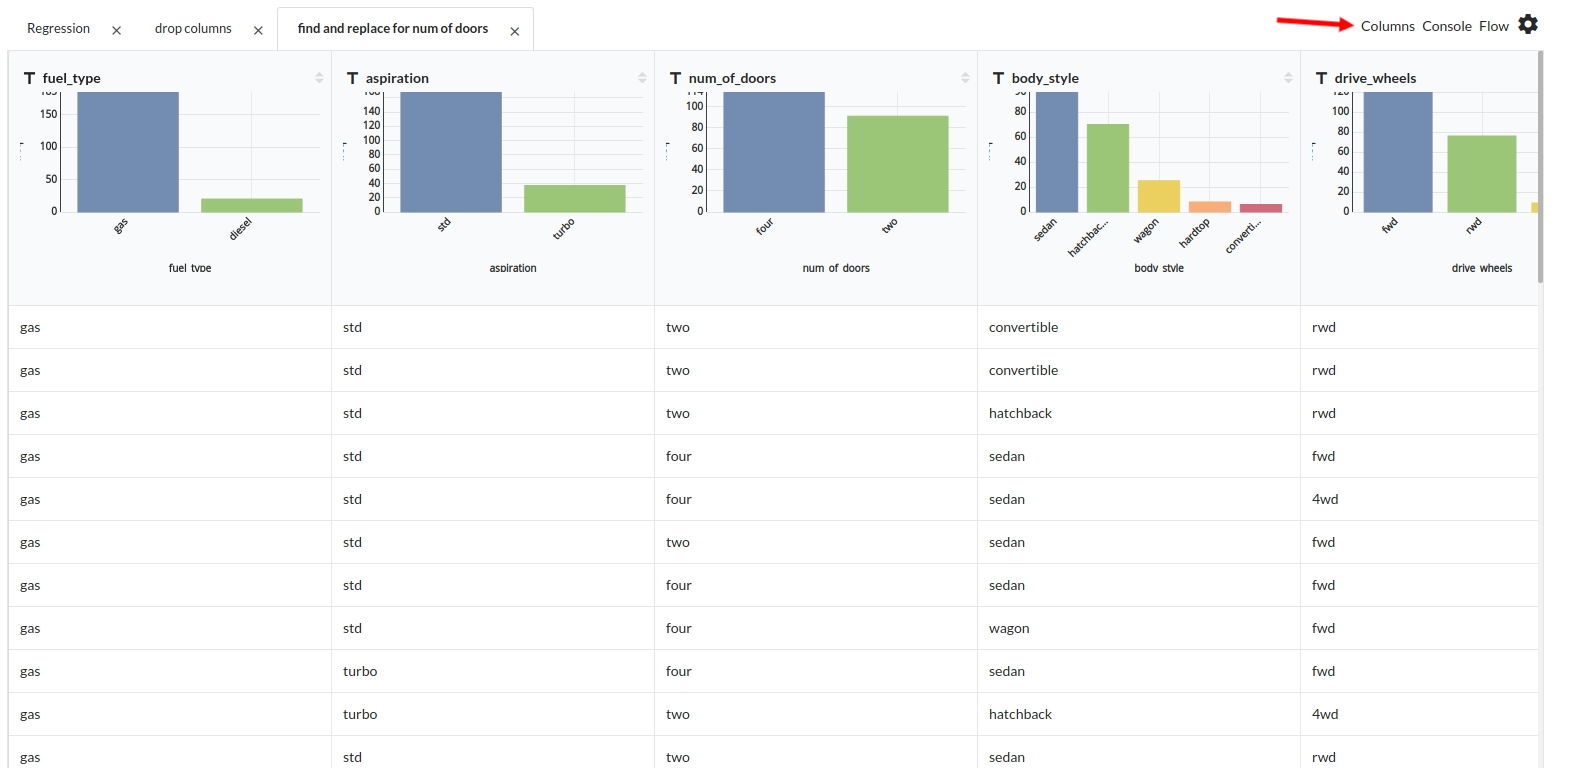
Columns
IF you click on the Columns Button, It shall change the result view to show display the column statistics. You can choose to select between univariate and multi-variate analysis. For more information on Columns view, refer to Columns
Flow
This section contains the visual flow representation of the current recipe. User can review the recipe flow at any point in time during the design.
For more information on Flow view, refer to Recipe Flow
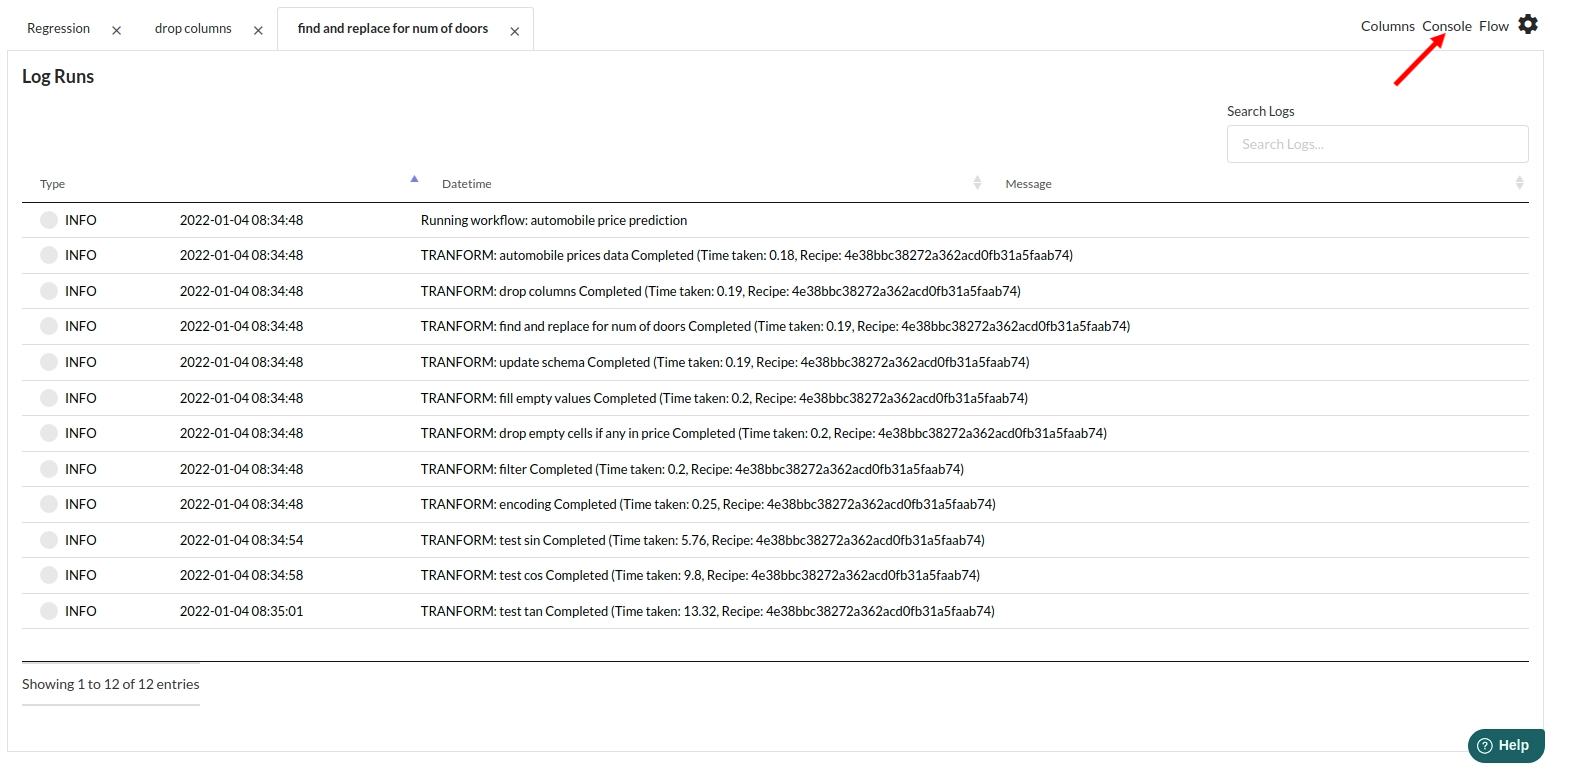 Click on the console button in the main page and you will directed to this page.
Each log message that is listed under the console messages has the following information:
- Type : INFO or ERROR
- Datetime : When was the step created or ran
- Message : This shows what step ran which will have the title of steps and time taken for execution of that step.
Messages are displayed as Red or Grey depending on the type of message.
- Red : (ERROR) Tells you if there cis any error that occured while creating any steps.
- Grey :(INFO) Tells you that the step ran without any hassle .