Getting Started - Business Analyst
Xceed analytics offers a host of tools that make business/data analyst job easier. These include
- Data Connections to upload common files such as csv, tsv, dsv for analysis and use existing data sources
- Xceed Analytics Data Catalog for discovering datasets/tables created by Data Engineers
- SQL Explorer to perform adhoc-queries and create both materialized and non-materialized views.
- Dashboards to create datastories from the available datasets.
Bring your own data
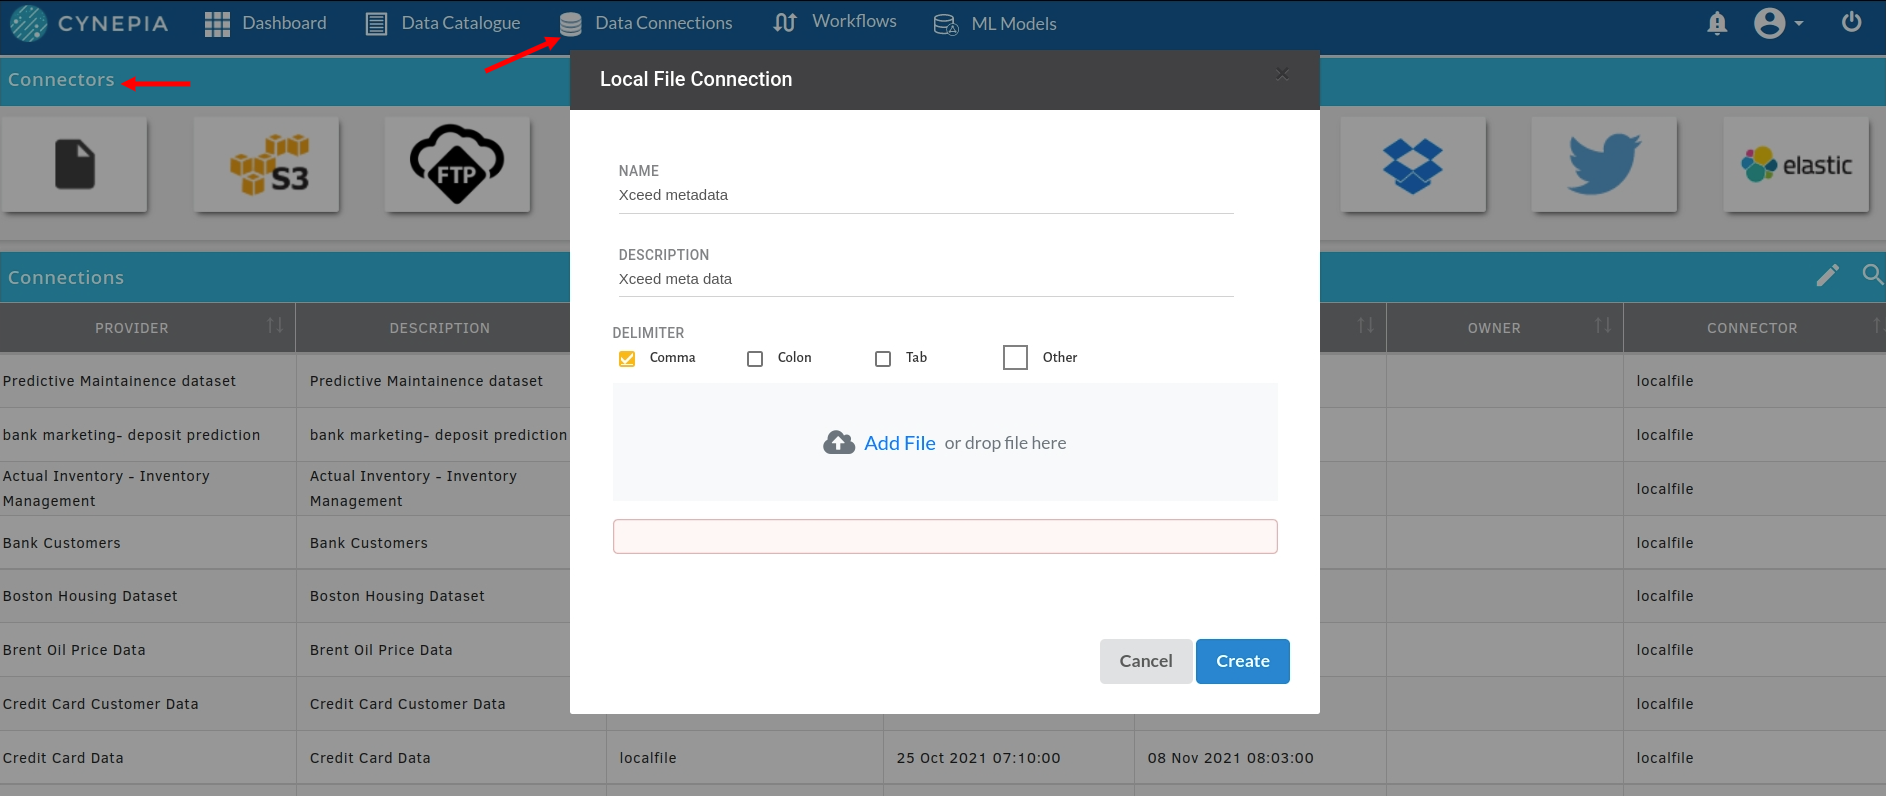
Visit Data Connectors section in your Xceed Analytics app. Here you can see a list of connections available to you.
You can create a new connections to various kinds of connectors by choosing from the list on top. View supported connectors.
- Click on a data connector icon
- Enter the endpoint information and credentials required
- Name the connection you’re creating as per your preference
Once you finish, the new connection will be listed under Connections on your screen. You can now create datasets using this connection.
More about Managing and Creating Data Connectors
Create Datasets
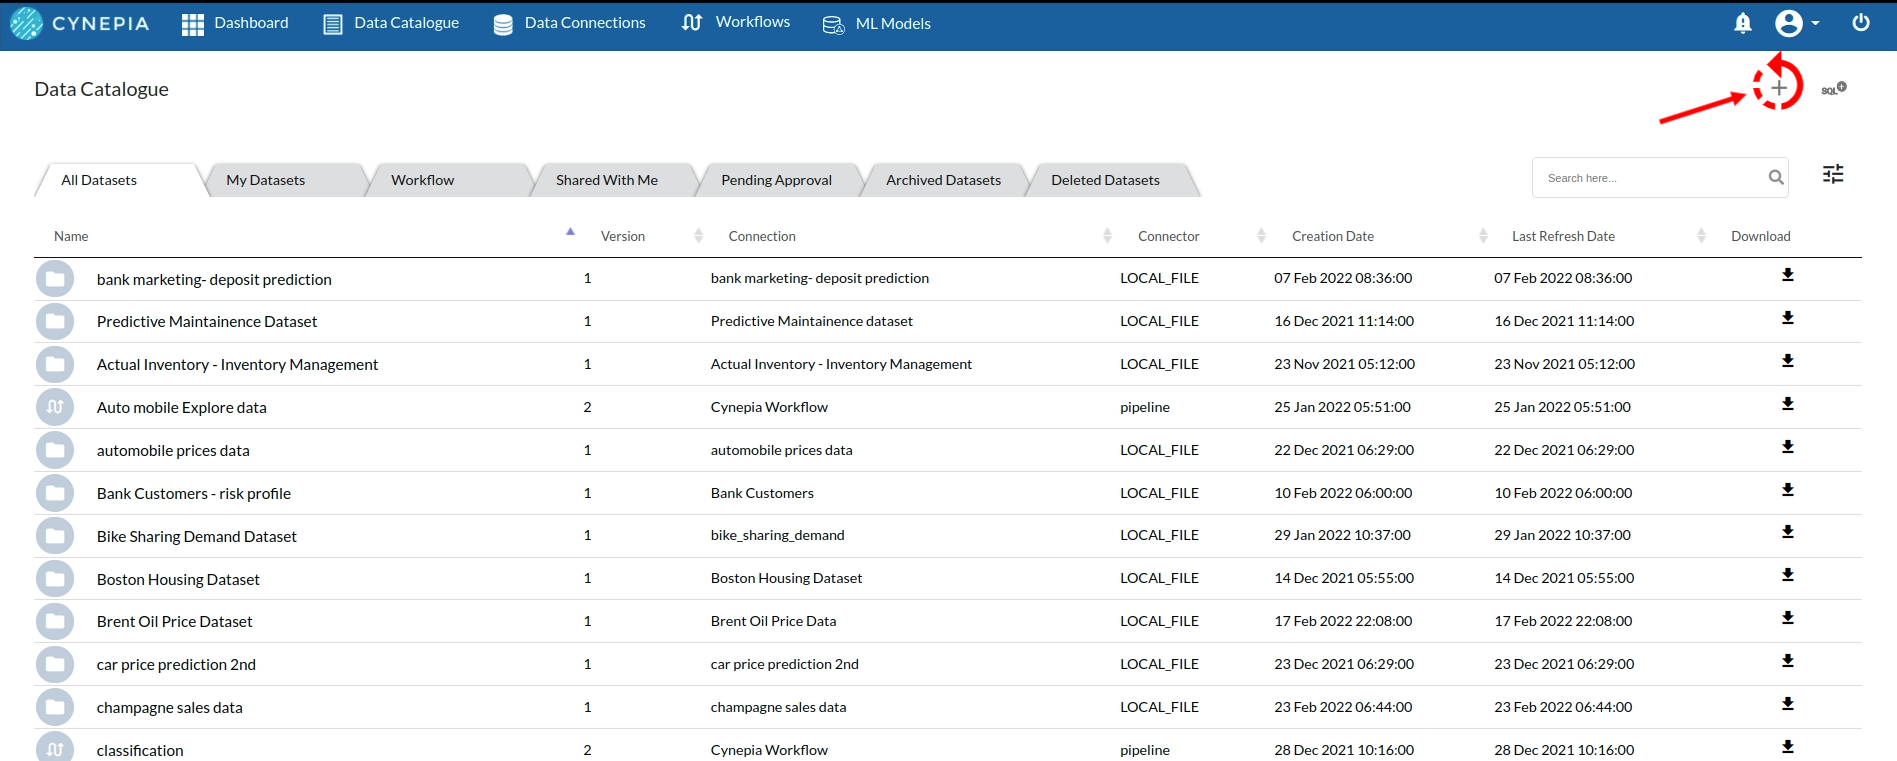
Visit Data Catalogue section in your Xceed Analytics app . Here you can see , create all the datasets which were uploaded in the Data connectors
Start creating a dataset by clicking on the + icon you see on the top right in the data catalogue view.
- View objects available under a connection and pick the one you want
- Preview the object/table you have selected
- Organize your data by updating metadata(data types of your specifics).
- Name your dataset and update any scheduling parameters if required
Your newly created dataset will now be available on the list of datasets you can access.
More about creating and managing Datasets
Create a data story
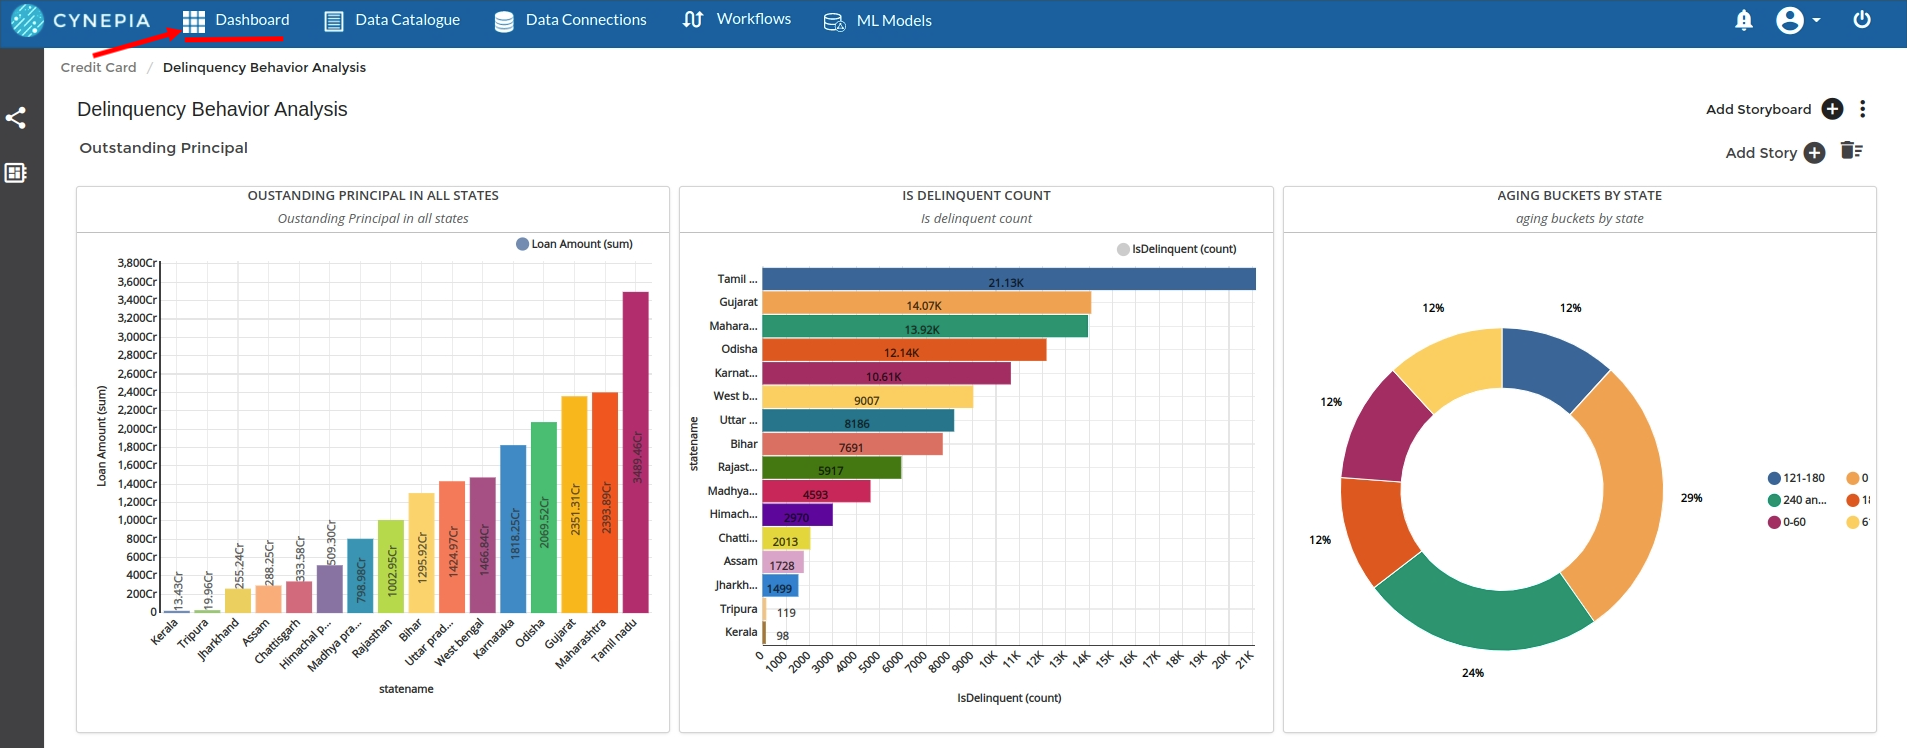
Start by creating a Dashboard on the home screen. Create a storyboard and start creating individual data stories to fill your storyboard. You can create meaningful data stories using available datasets by bringing them together in the Story Designer. Here you can review your dataset and ask relevant business questions using a combination of Dimensions, Measures, Filters and Aggregations. You can further visualize the analysis using a range of visualizations which can be a chart, widget or a map.
Subsequently, pin up the story to a storyboard that can contain multiple stories. Your storyboards can be presented on a dashboard.
Dashboard > Storyboards > Stories
Learn more about creating data stories
Organize your Dashboard
Dashboards section displays all the dashboards you have created or have access to. You can create, edit, delete or share dashboards from here. A dashboard is a collection of storyboards. Storyboards can host data stories of various sizes for better organization.
Create your dashboard in a way where all the Chart types makes sense for your business requirement