Getting Started - Data Scientist/ML Engineer
Xceed analytics offers a host of tools that make data scientist and ml engineers job easier. These include
-
Data Connections offer ready to use connectors to connect third-party data sources and schedule the periodic sync jobs.
-
Workflow to perform feature engineering and create quick ML/AutoML Experiments. Currently supported AutoML model types include: classification, regression and forecasting models with support for 40 plus algorithms.
-
Xceed Analytics Data Catalog for discovering upstream sources and publishing datasets/tables for the downstream users such as business analysts
-
SQL Explorer to perform adhoc-queries.
-
Model Catalog Manage life-cycle of an experiment including version management, deployment, experiment changes over time from model catalog.
-
Dashboards: To create datastories from the available datasets, if required.
-
Also, Xceed Analytics CLI and SDK for coding data engineering pipelines
Bring your own data
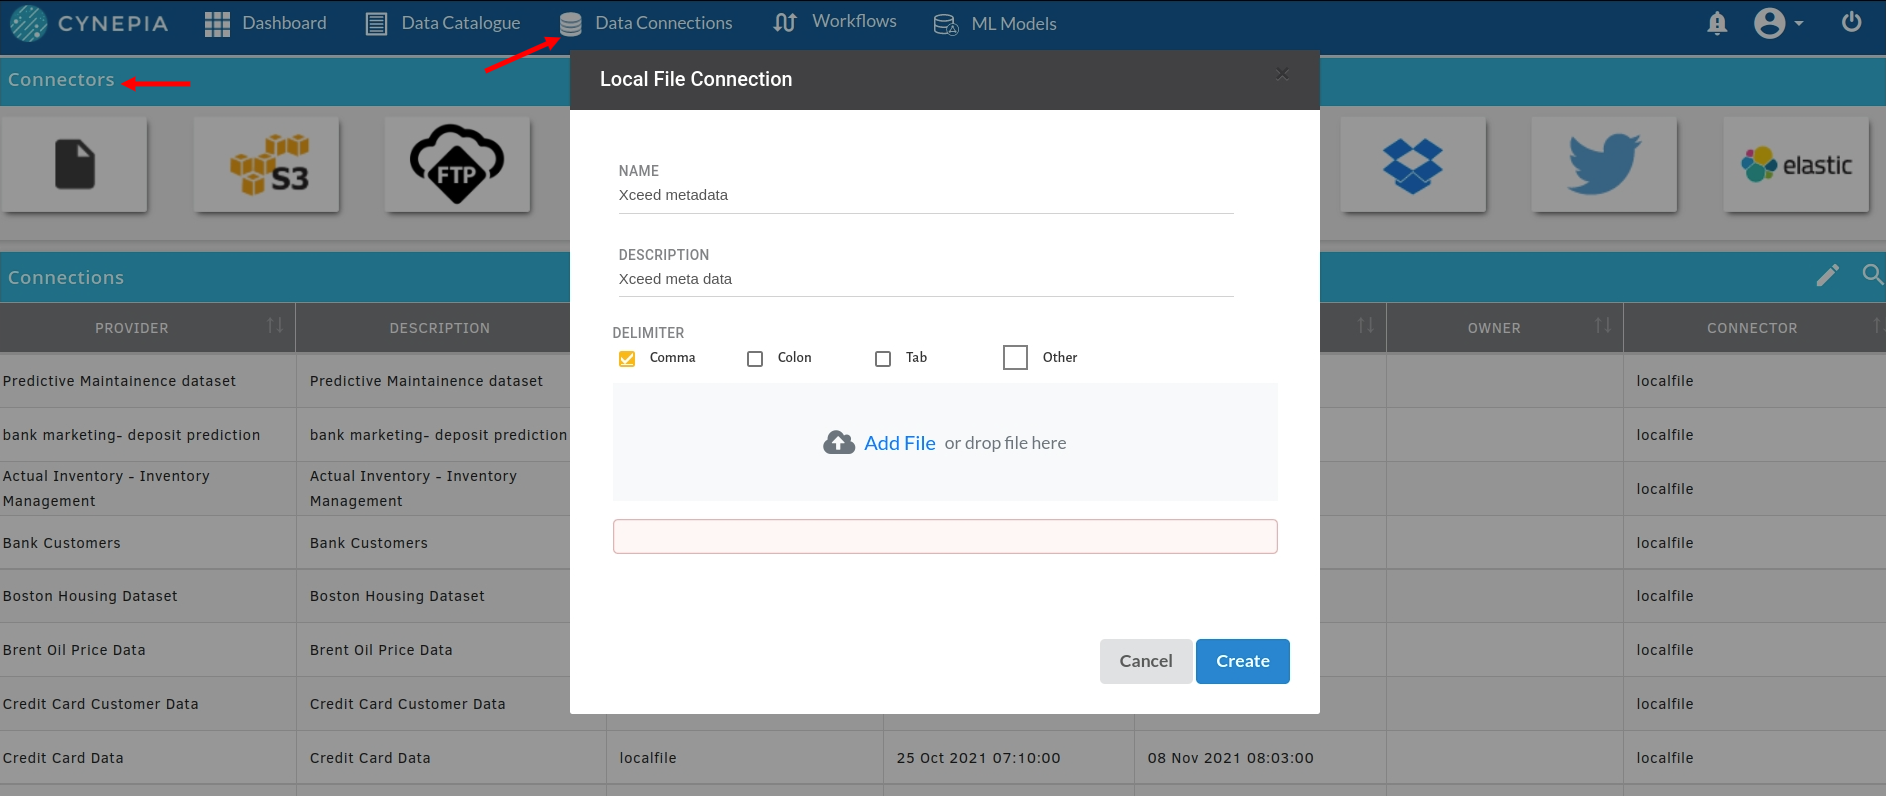
Visit Data Connectors section in your Xceed Analytics app. Here you can see a list of connections available to you.
You can create a new connections to various kinds of connectors by choosing from the list on top.
- Click on a data connector icon
- Enter the endpoint information and credentials required
- Name the connection you’re creating as per your preference
Once you finish, the new connection will be listed under Connections on your screen. You can now create datasets using this connection.
More about Managing and Creating Data Connectors
Create Datasets
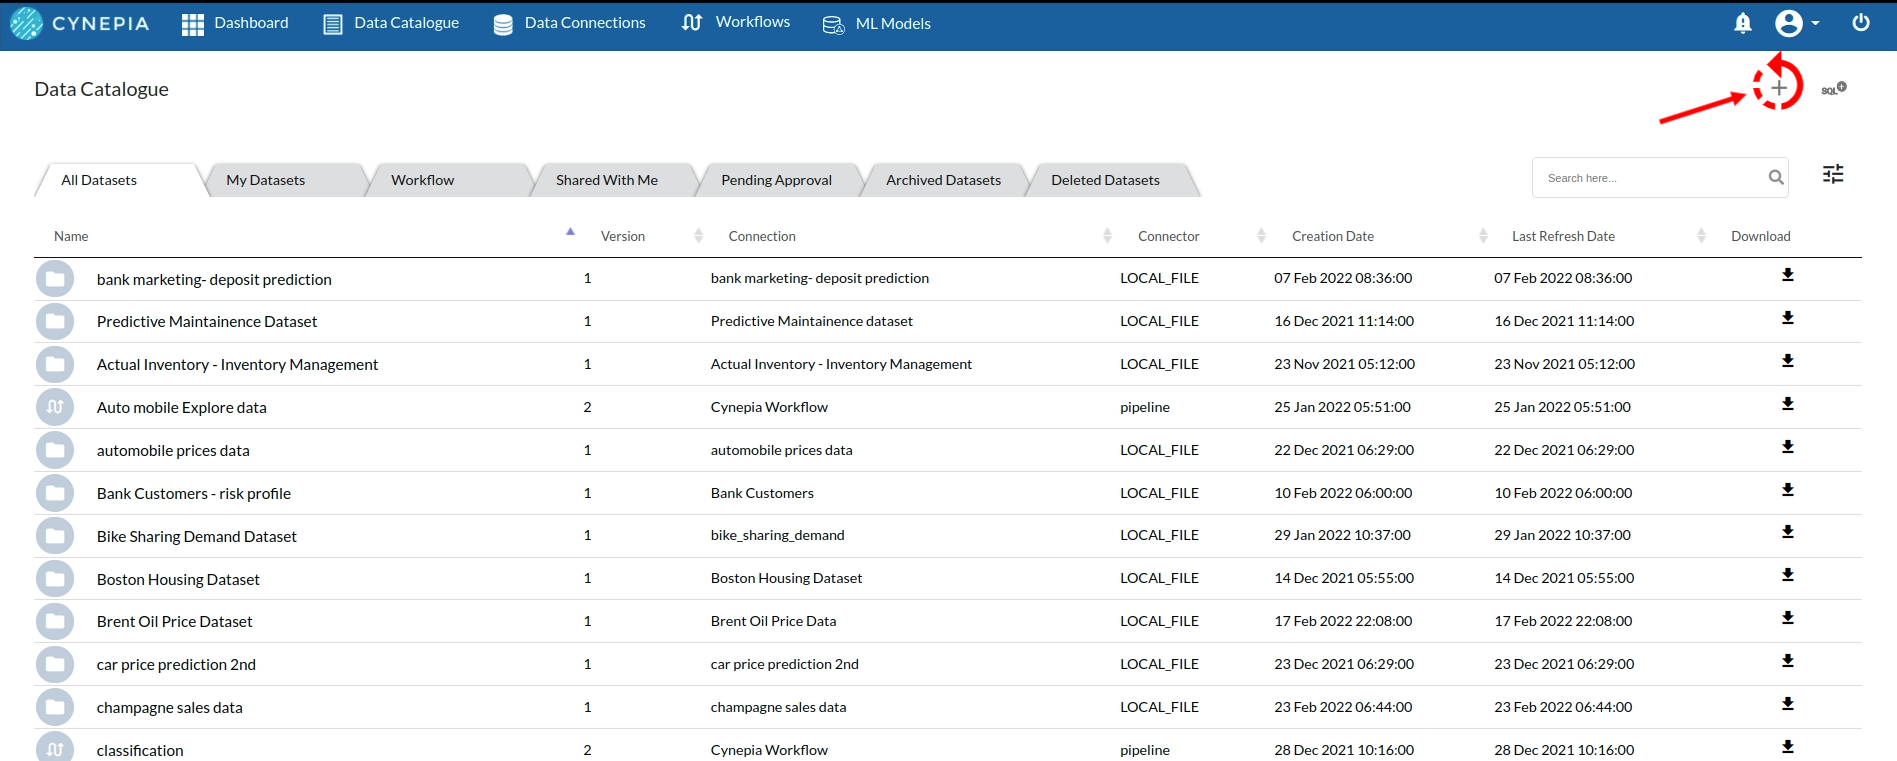
Visit Data Catalogue section in your Xceed Analytics app . Here you can see , create all the datasets which were uploaded in the Data Connectors
Start creating a dataset by clicking on the + icon you see on the top right in the data catalogue view.
- View objects available under a connection and pick the one you want
- Preview the object/table you have selected
- Organize your data by updating metadata(data types of your specifics).
- Name your dataset and update any scheduling parameters if required
Your newly created dataset will now be available on the list of datasets you can access.
More about creating and managing Datasets
Create a Workflow
Visit WORKFLOWS in your Xceed Analytics app. Here you can create a NO CODE environment based workflow for your data cleaning, KPI creation and data analysis with a visual flow and step based view.
Start by creating your workflow by clicking on + icon you see on the top right in the workflow view.
- Choose the type of your workflow
- Choose the run schedule for your worfklow
- Fill up the details and start documenting your workflow from the start.
- Create Click to finish creating your workflow.
Your newly created workflow will be seen in the workflow page
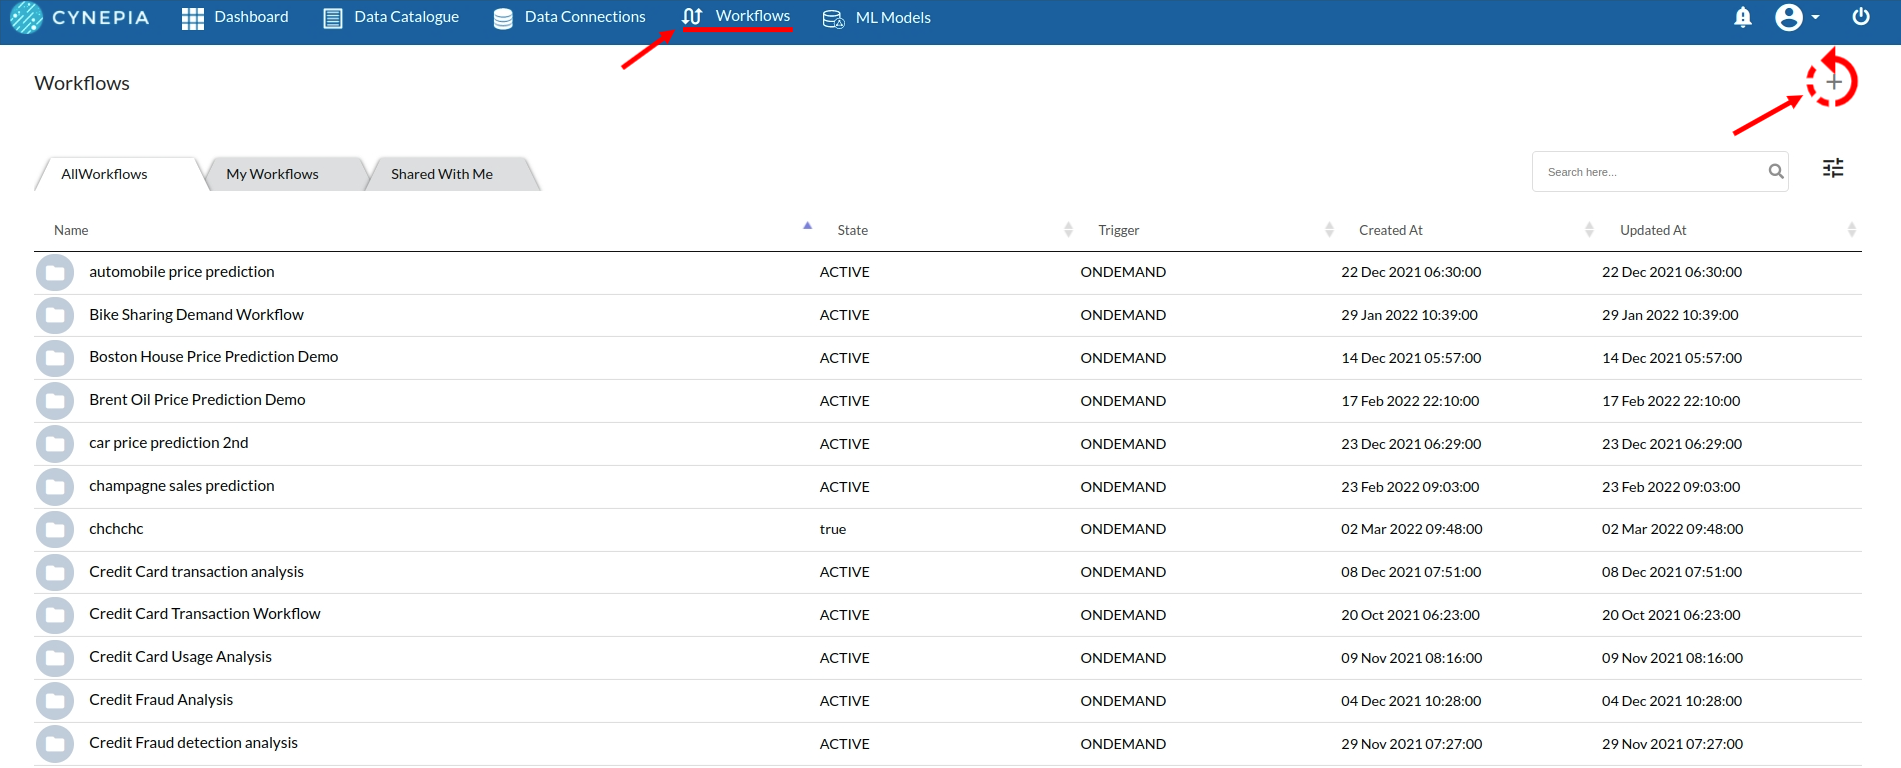
click on the newly created workflow and you will see the the workflow details page. create your workflow architecture using Commannd Tool Bar
More about creating and managing a workflow
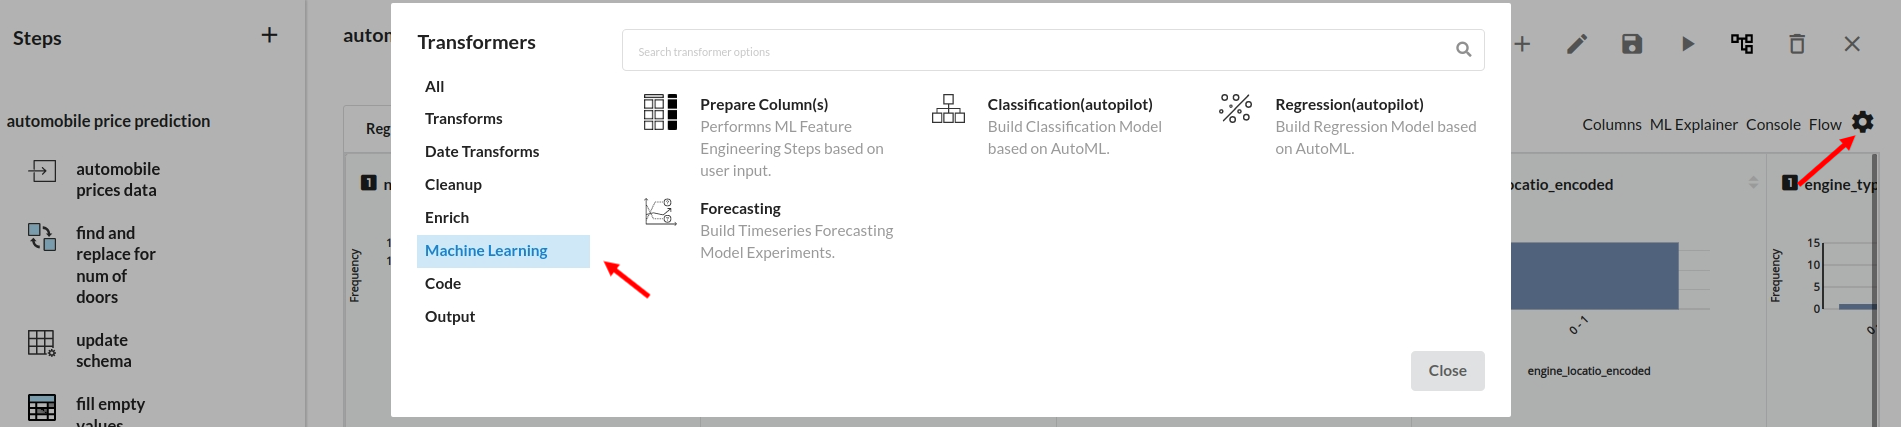
Use any or all transformers Xceed analytics supports for any of your data requirements .
![]()
Once you complete your requirement and create Output, you will see the resultant dataset in the Data Catalogue Take the resultant dataset and create a data story as your next step of your data analysis
Create a data story
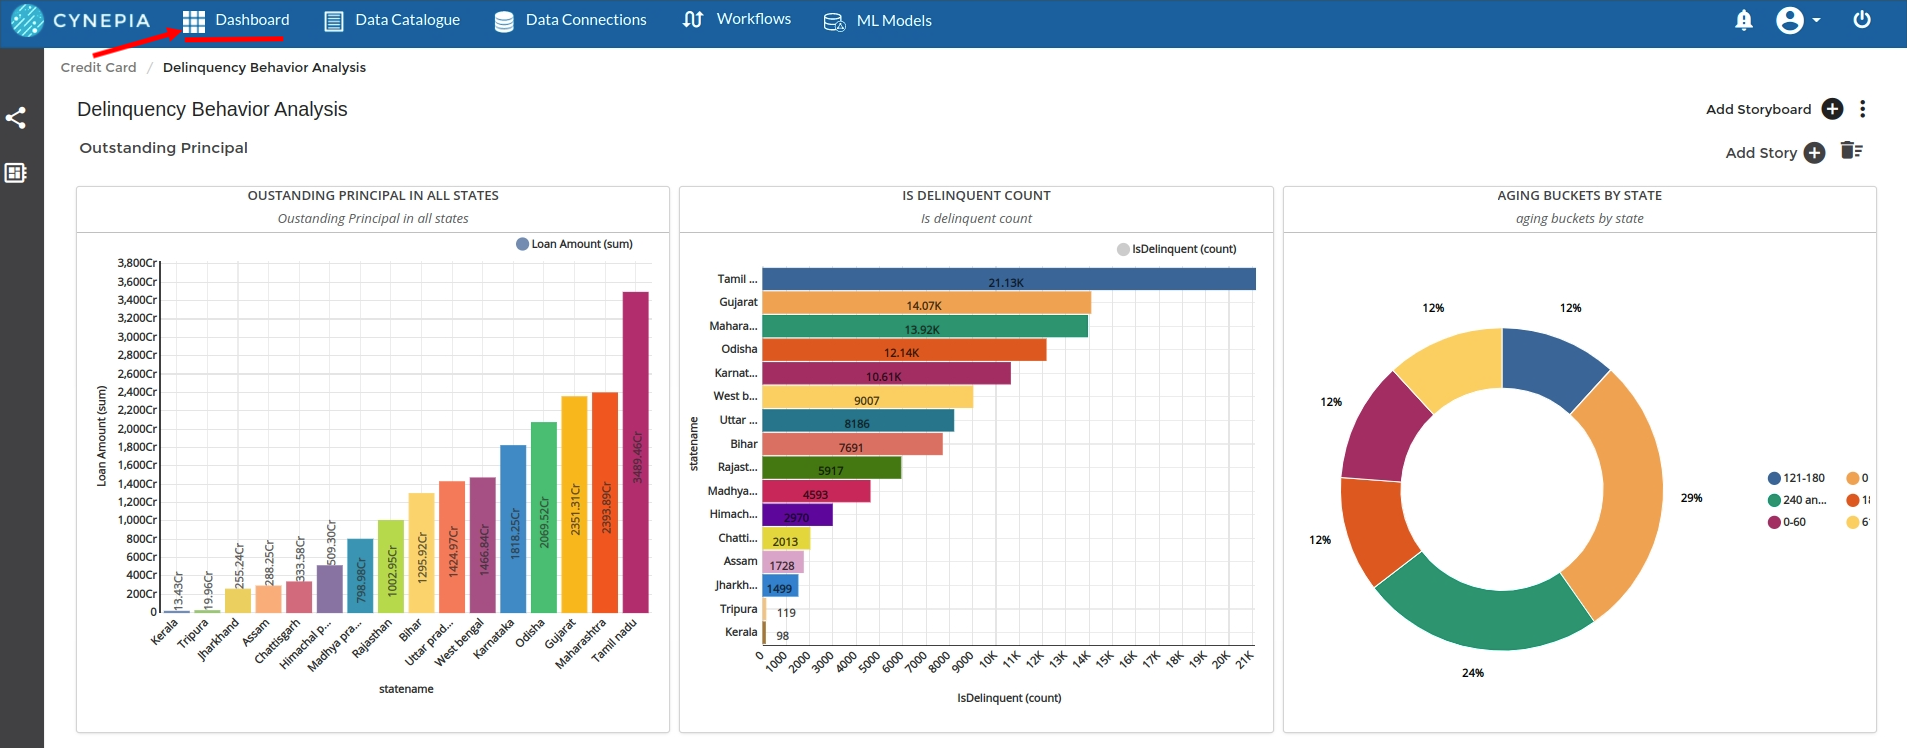
Start by creating a Dashboard on the home screen. Create a storyboard and start creating individual data stories to fill your storyboard. You can create meaningful data stories using available datasets by bringing them together in the Story Designer. Here you can review your dataset and ask relevant business questions using a combination of Dimensions, Measures, Filters and Aggregations. You can further visualize the analysis using a range of visualizations which can be a chart, widget or a map.
Subsequently, pin up the story to a storyboard that can contain multiple stories. Your storyboards can be presented on a dashboard.
Dashboard > Storyboards > Stories
Learn more about creating data stories
Organize your Dashboard
Dashboards section displays all the dashboards you have created or have access to. You can create, edit, delete or share dashboards from here. A dashboard is a collection of storyboards. Storyboards can host data stories of various sizes for better organization.
Create your dashboard in a way where all the Chart types makes sense for your business requirement
Build a Machine learning Model
As a part of the workflow designer you will get processors related to all the machine learning techniques. Xceed analytics support 31 machine learning for regression, classification and Time series forecasting respectively.
- choose any of the machine learning processor in your workflow designer.
 Refer ML Transforms for more information on these processors
2. Fill up the step based on your requirement
3. choose the ML algorithm you want to train
4. After the model is built, evaluate and interpret your model
Refer Interpretability tab for more information on evaluation an interpretation
5. deploy your model .
Refer ML Transforms for more information on these processors
2. Fill up the step based on your requirement
3. choose the ML algorithm you want to train
4. After the model is built, evaluate and interpret your model
Refer Interpretability tab for more information on evaluation an interpretation
5. deploy your model .