Getting started with Self-service BI
Xceed Self-service BI provides an extensive setup features for creating dashboards and stories using the datasets available in data catalog. Main features of Xceed self-service BI are as follows:
- Easy to use. Even a non-technical user with basic excel experience can use the same.
- Easy to organise your data stories into workspaces, dashboards and storyboards
- More than 16+ charts/maps to render your data story as you like
- Set alerts based on chart
- Automatic update of the dashboards, when the data is updated in the datalake Data Catalogue
- Ability to govern, share and collaborate on dashboard based individual roles/groups.
- Ability to give granular access to users/groups (read, edit, view, download)
Basic terminology
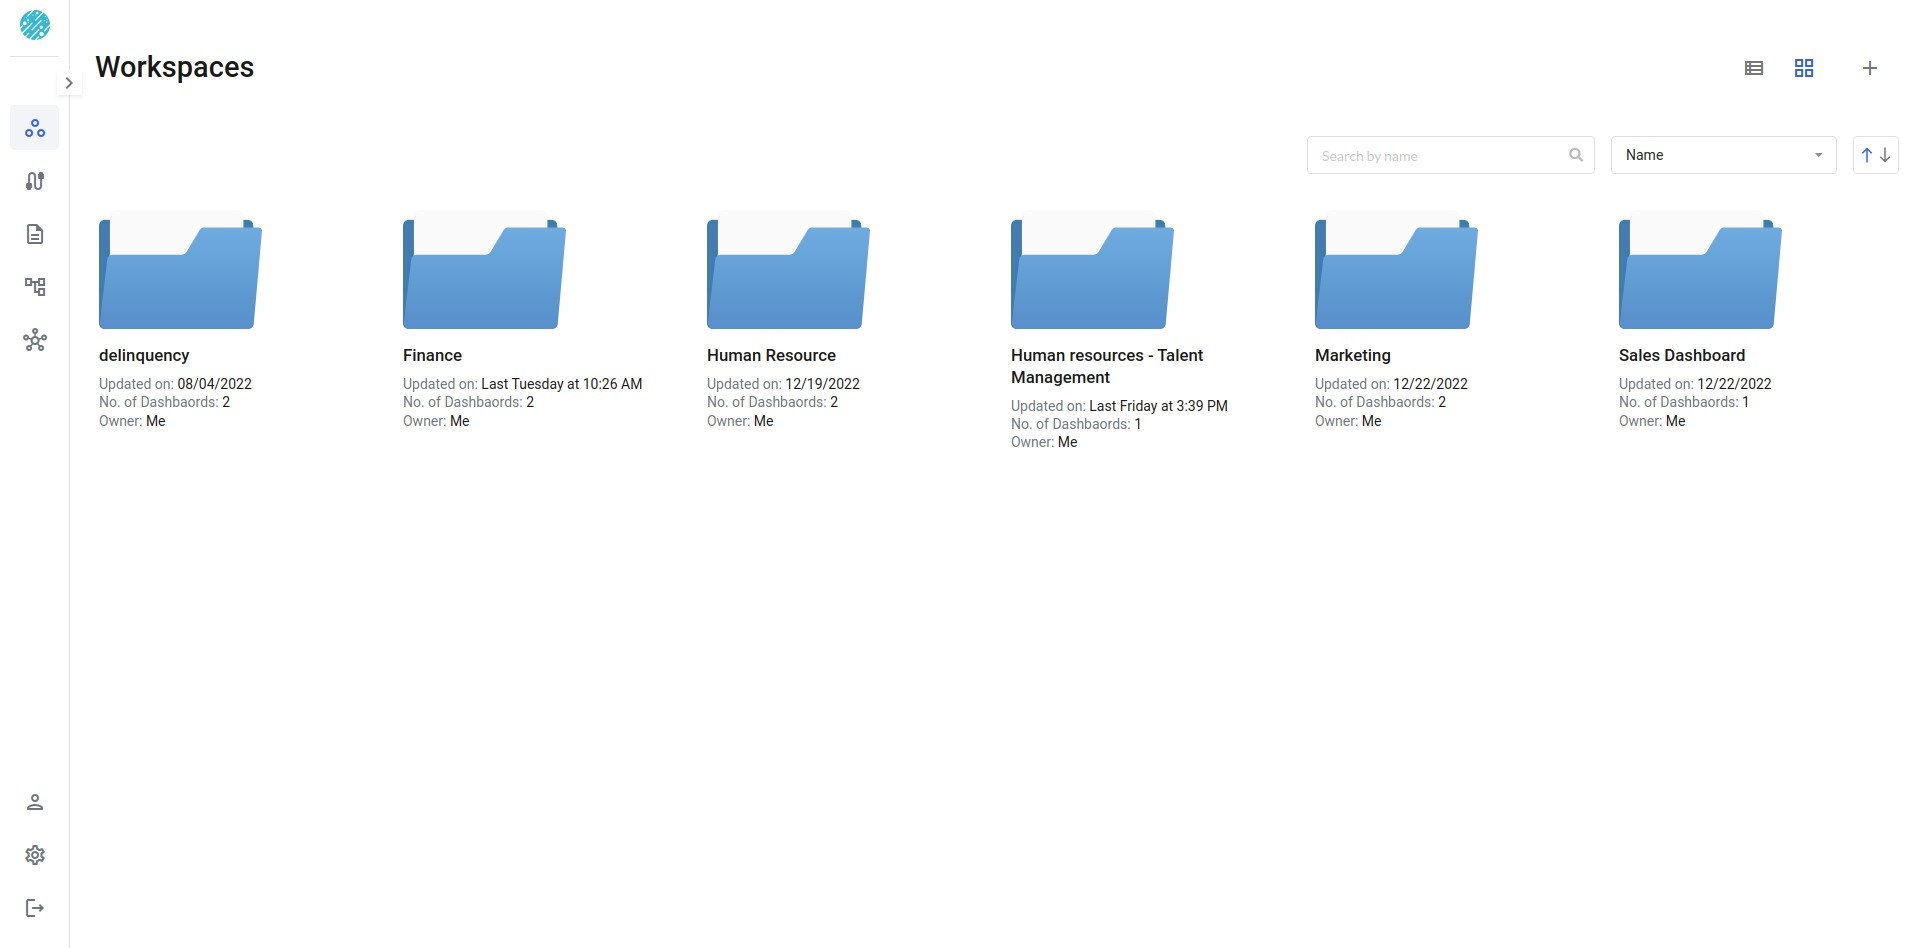
Workspaces
Spaces are akin to folders inside of which you can create multiple dashboards. An example of a space in a Financial Organisation, could be seperate space for Risk Department, Disbursements and Collections
Refer to Spaces for more information
Dashboards
Dashboards are similar to an Excel Workbook consisting of multiple storyboards (tabs). For ex. "Customer Transaction" space as shown can further be organised into multiple dashboards. Each of the dashboard inturn have multiple storyboards
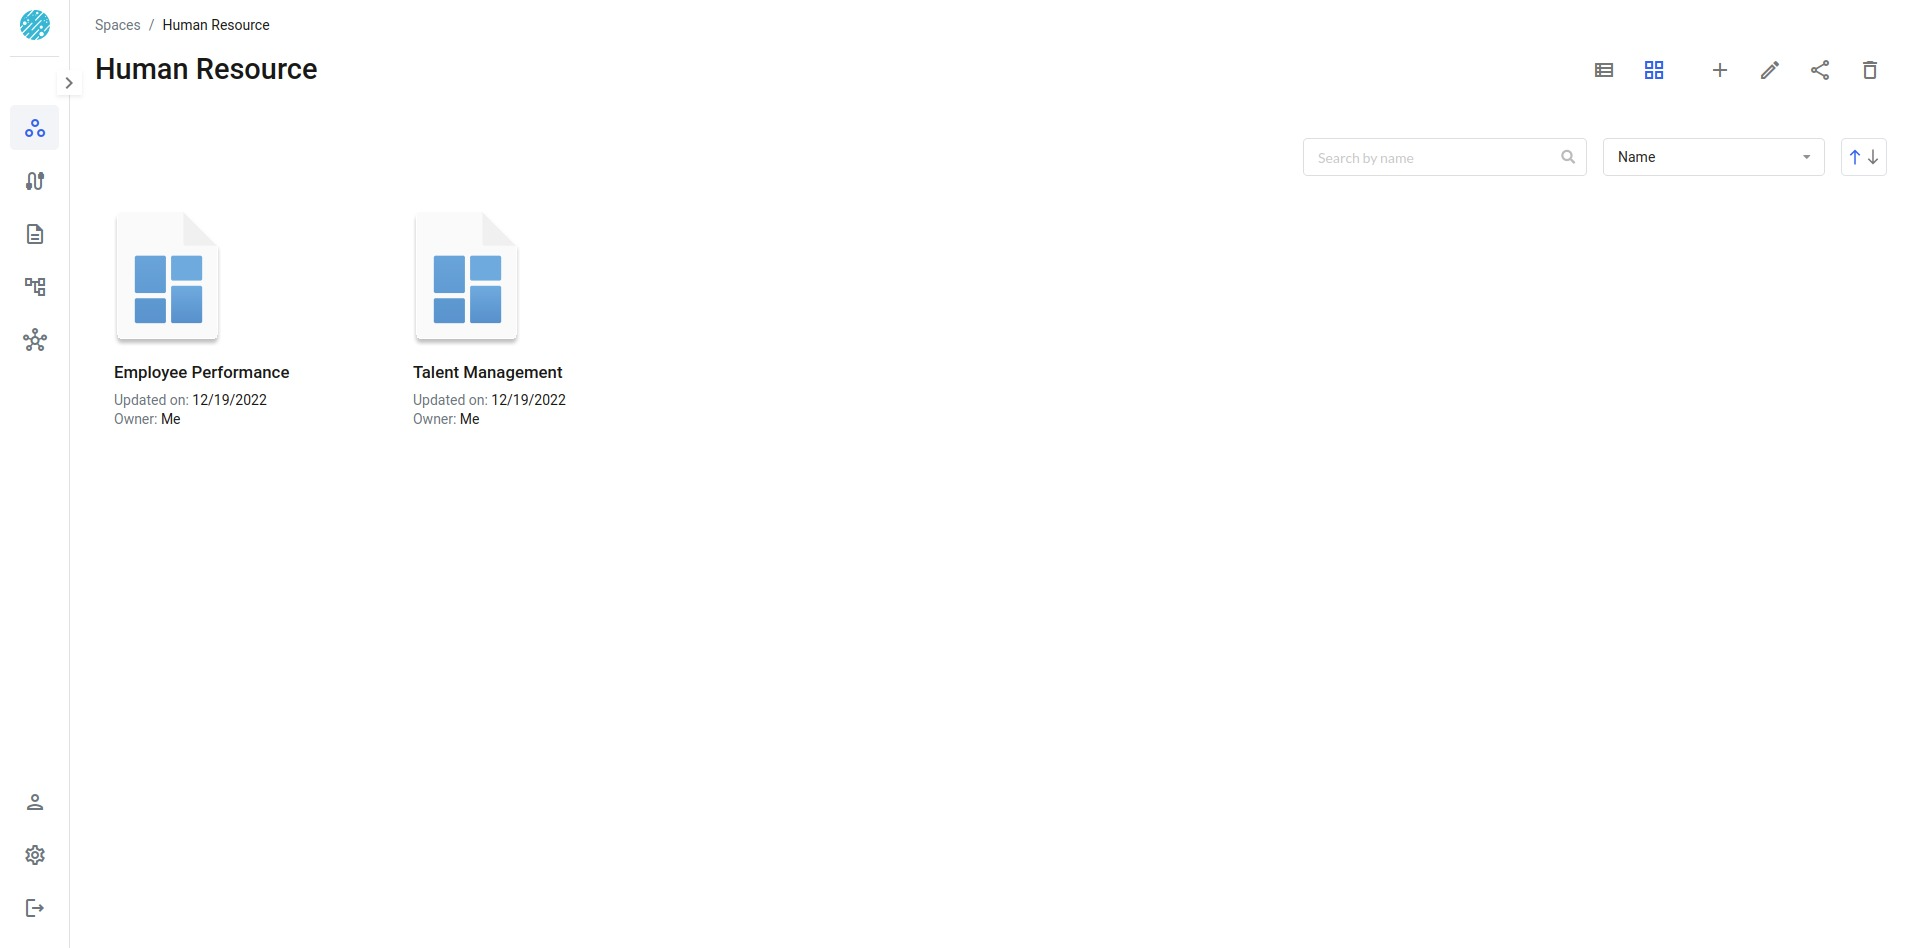
Refer to Dashboards for more information
Story boards
Each Storyboard is nothing but a collection of data stories. For example. "Customer Transaction" dashboard can contain one storyboard per region/product category.


Refer to Story Boards for more information
Stories
Stories are individual data stories/visualizations which are created based on the data from the data catalog.
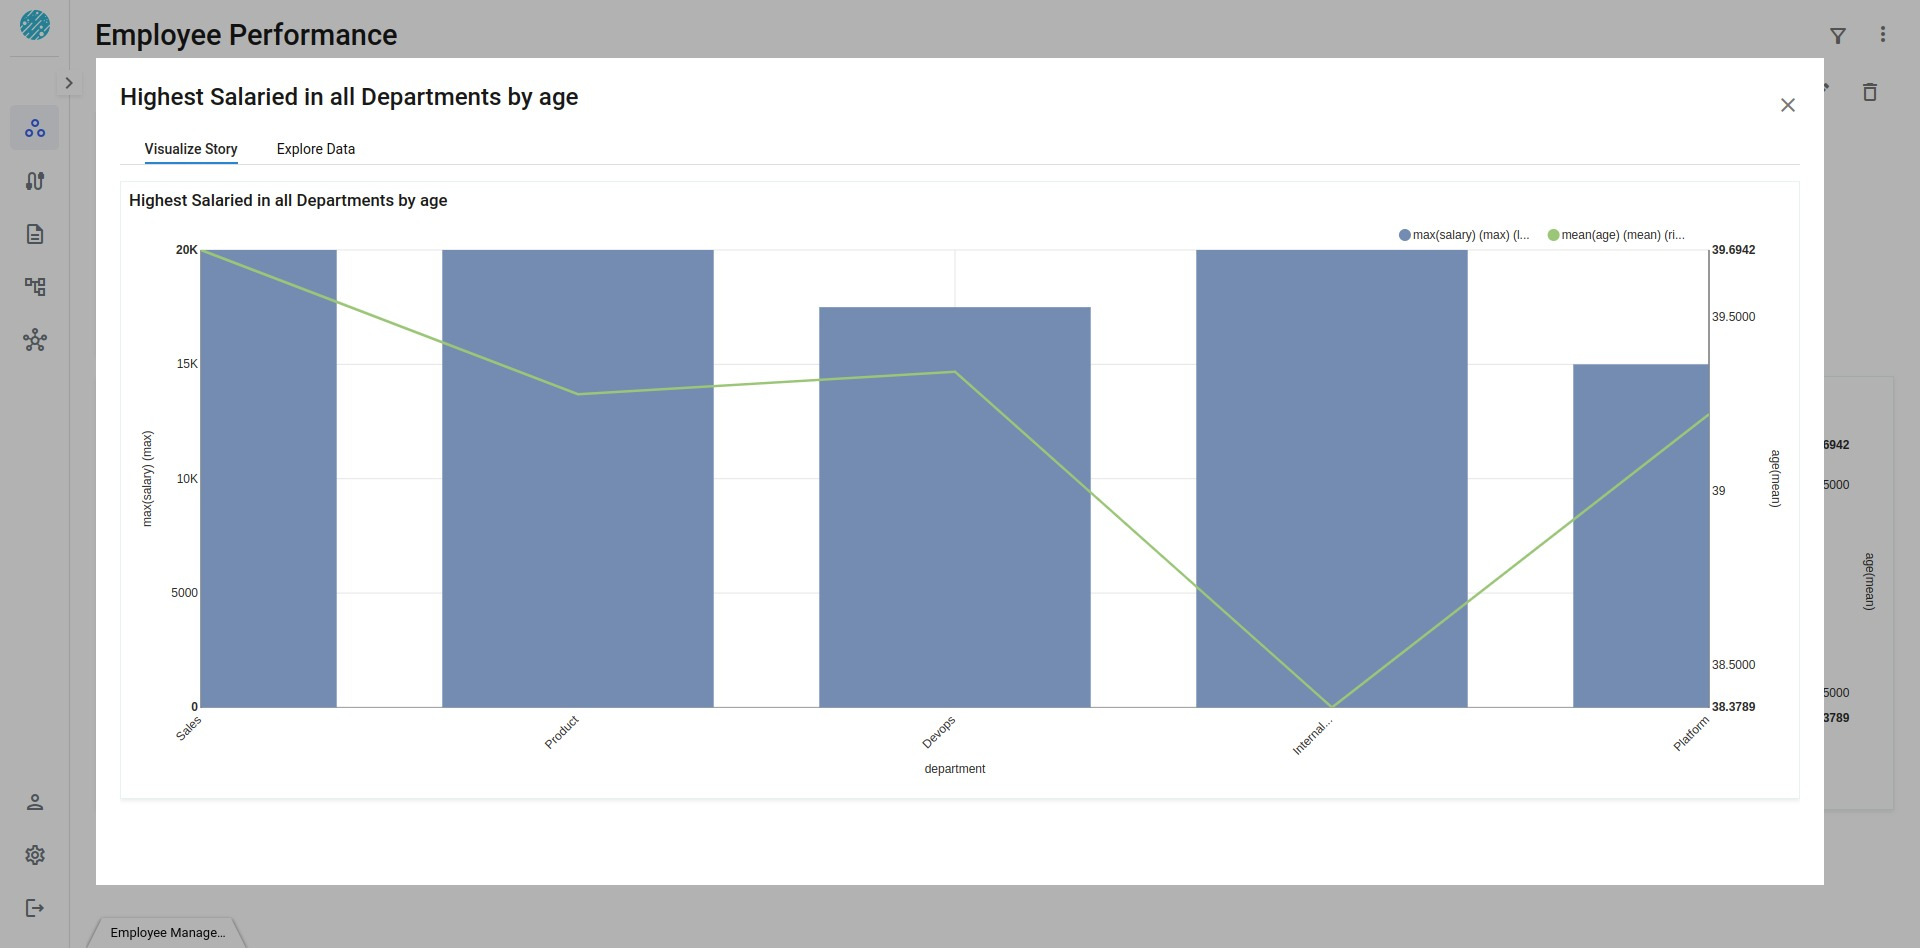
Refer to chart types for more information on the visualization types Xceed supports
Refer to Stories