Supported Charts
Xceed Analytics Supports a variety of Visualization Types. Each chart comes with it's own settings options, that help the user customise the look and feel of his/her data-story as per once requirements. Visualization Types included in Xceed Analytics are as below:
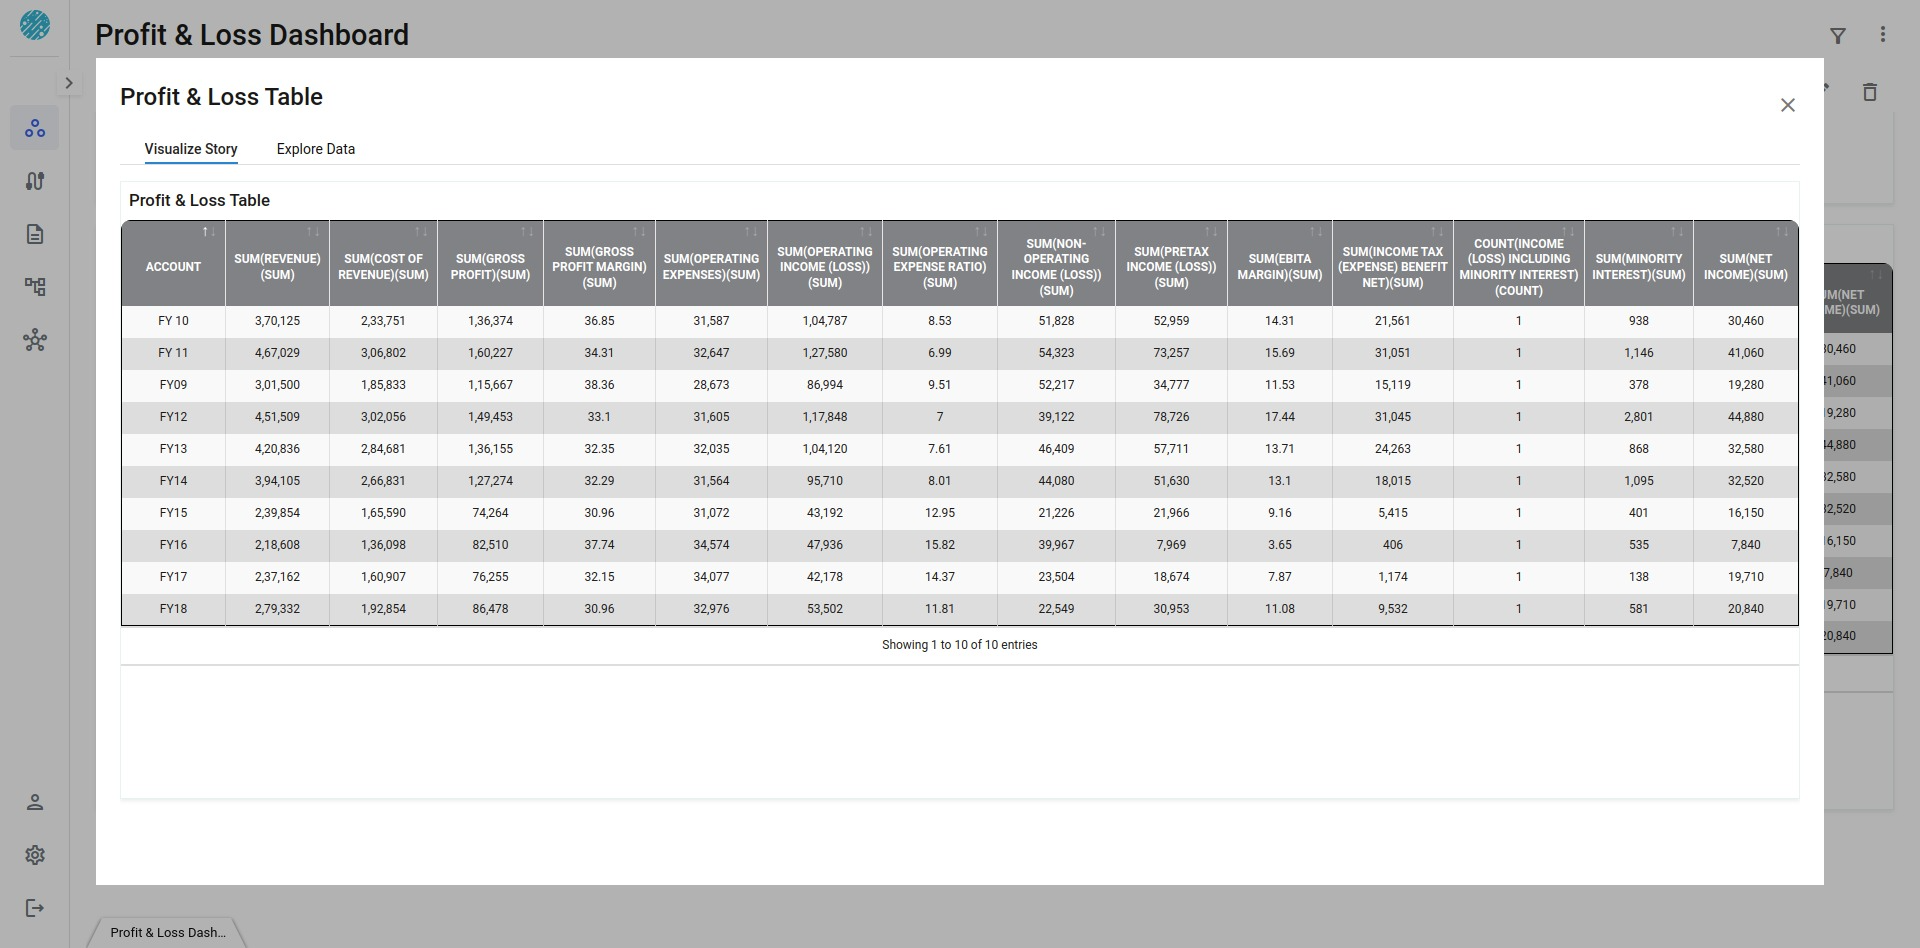
Table
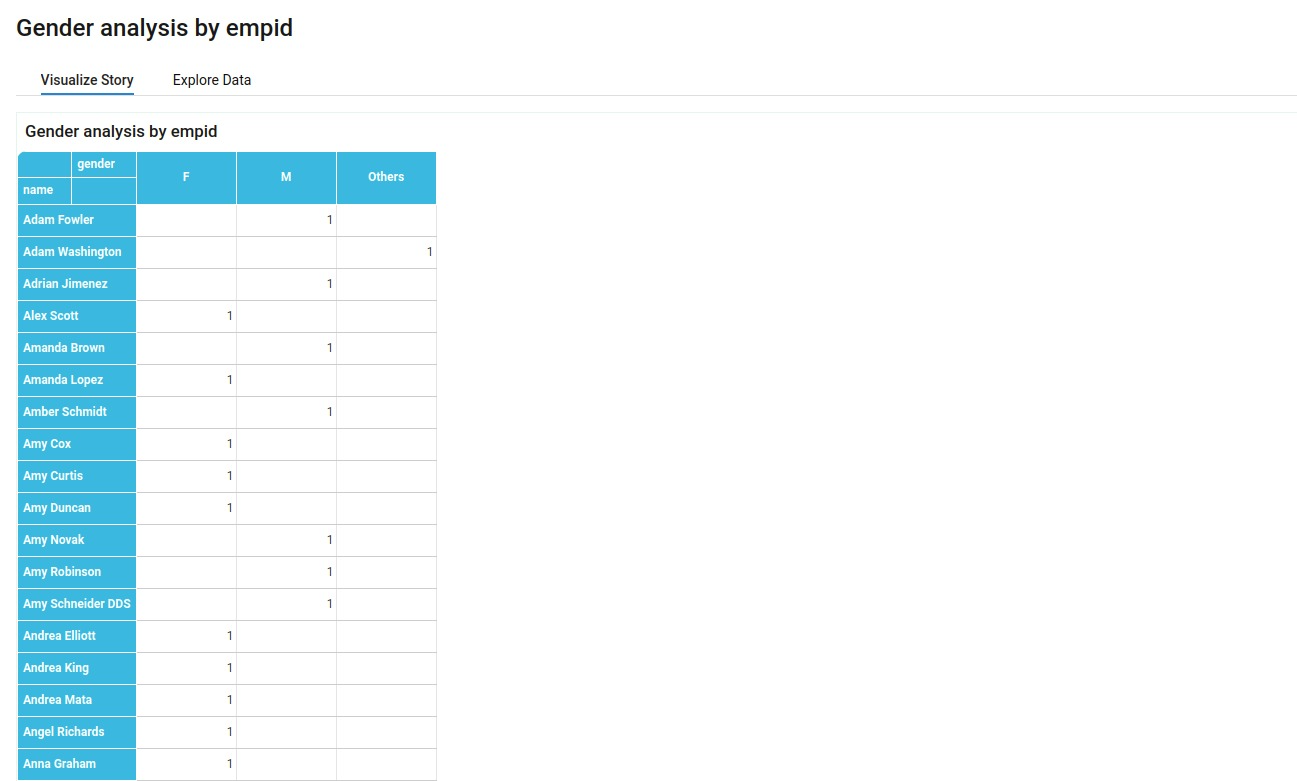
Pivot Table
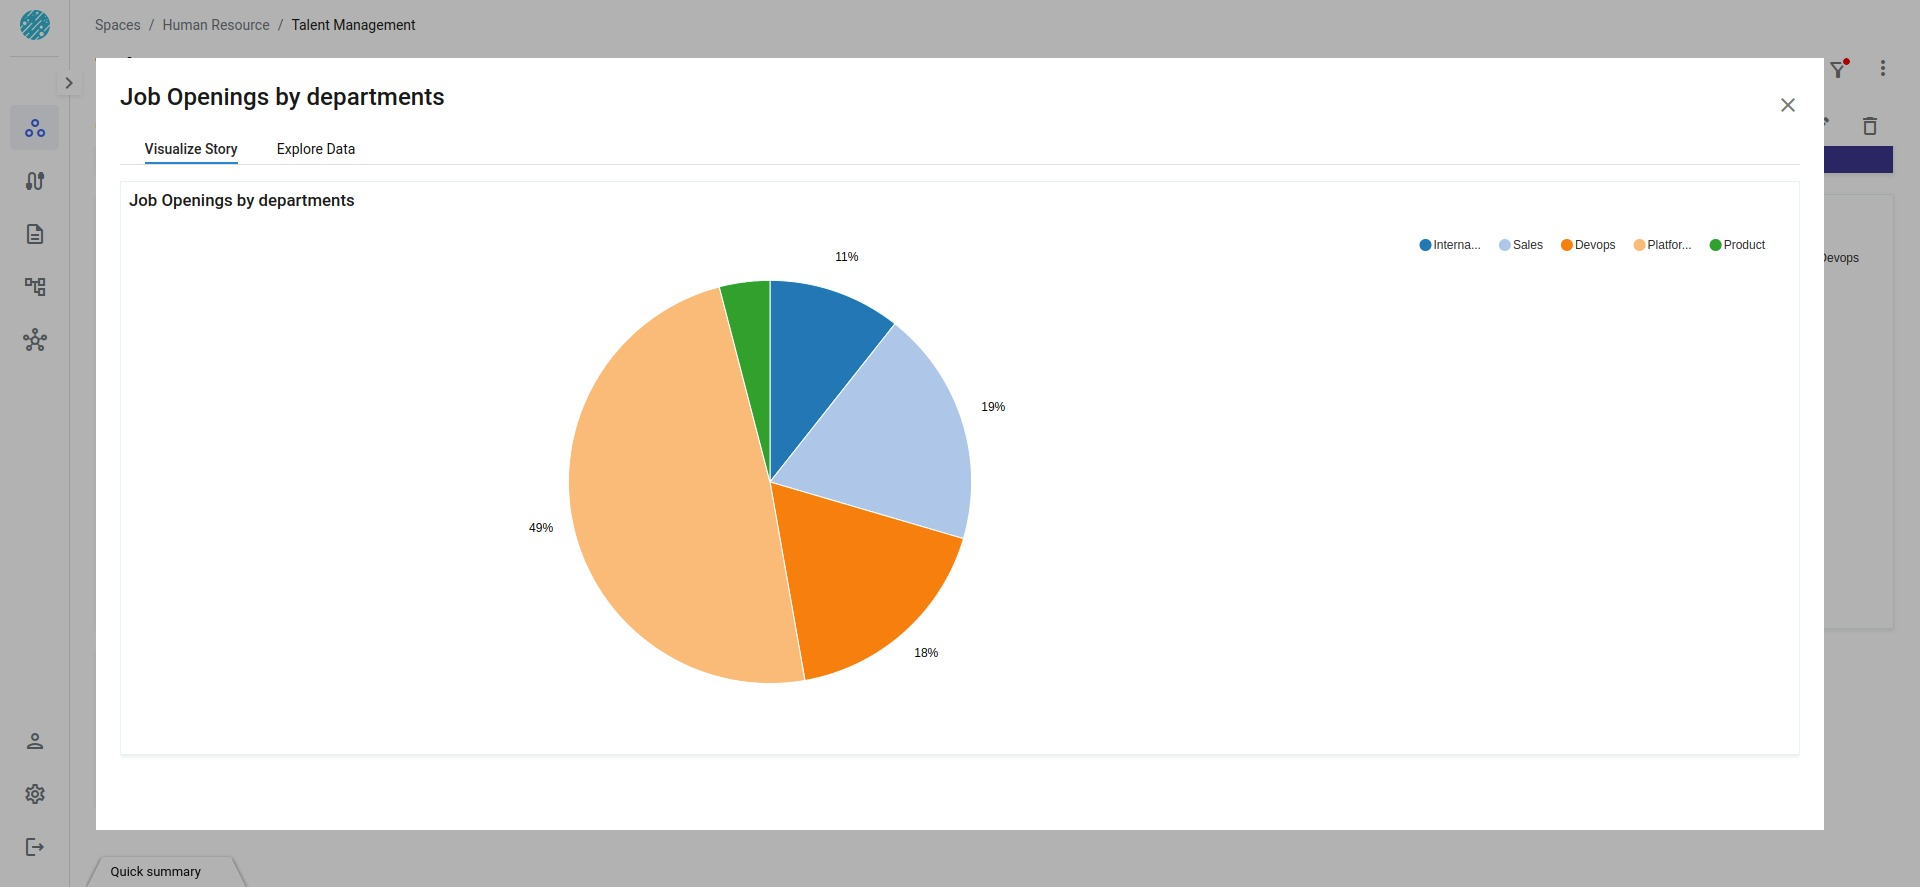
Pie
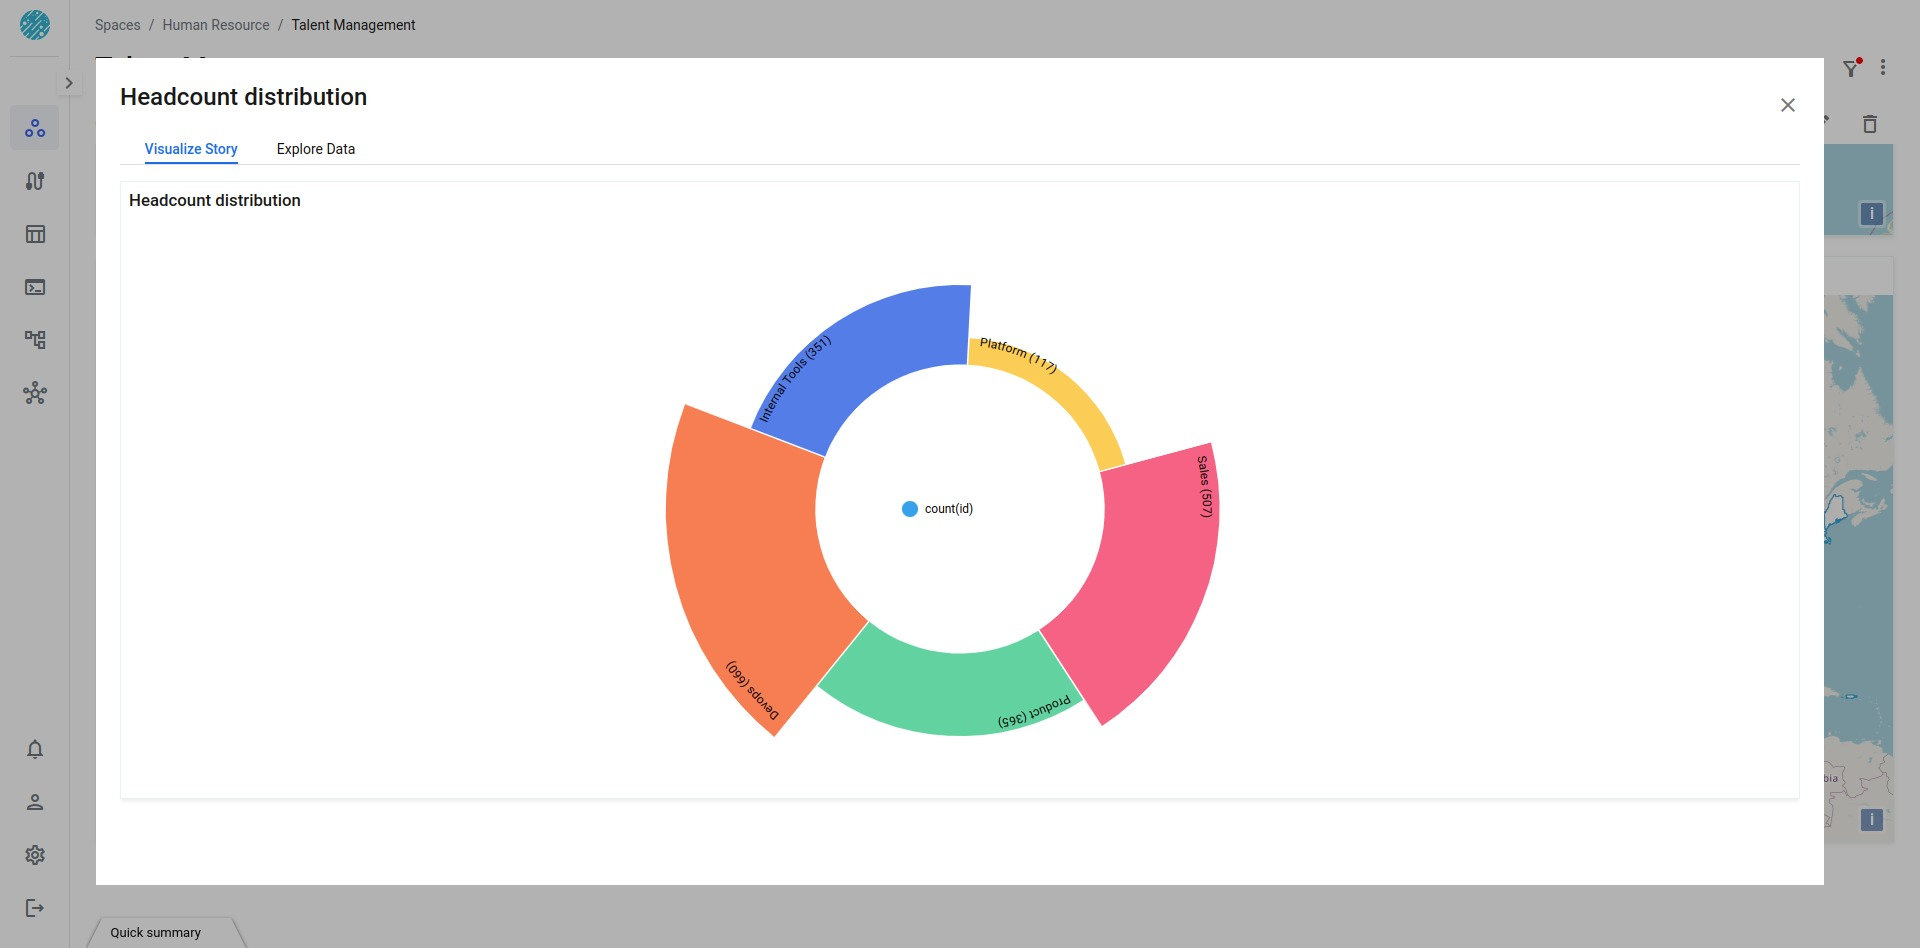
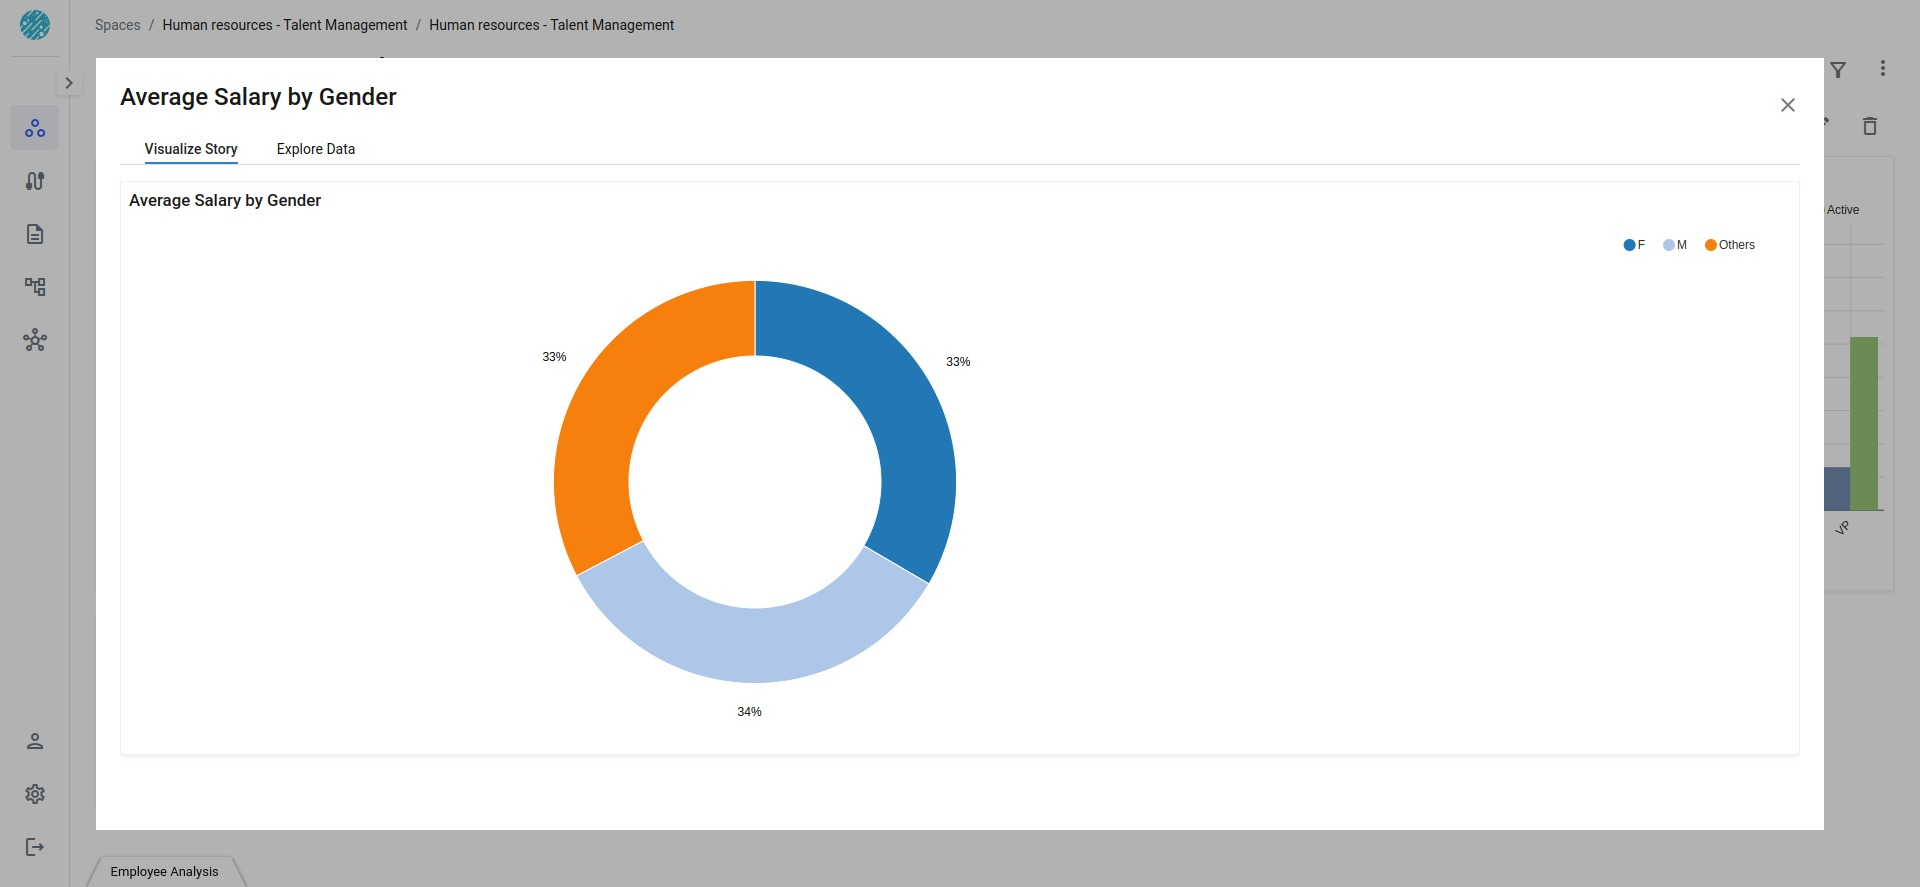
Donut
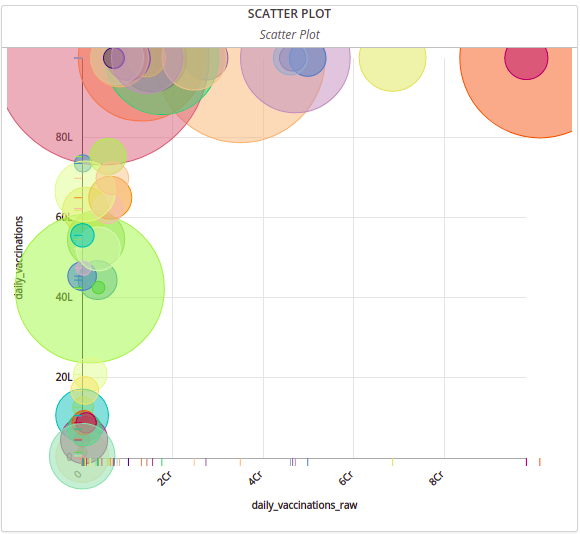
Scatter
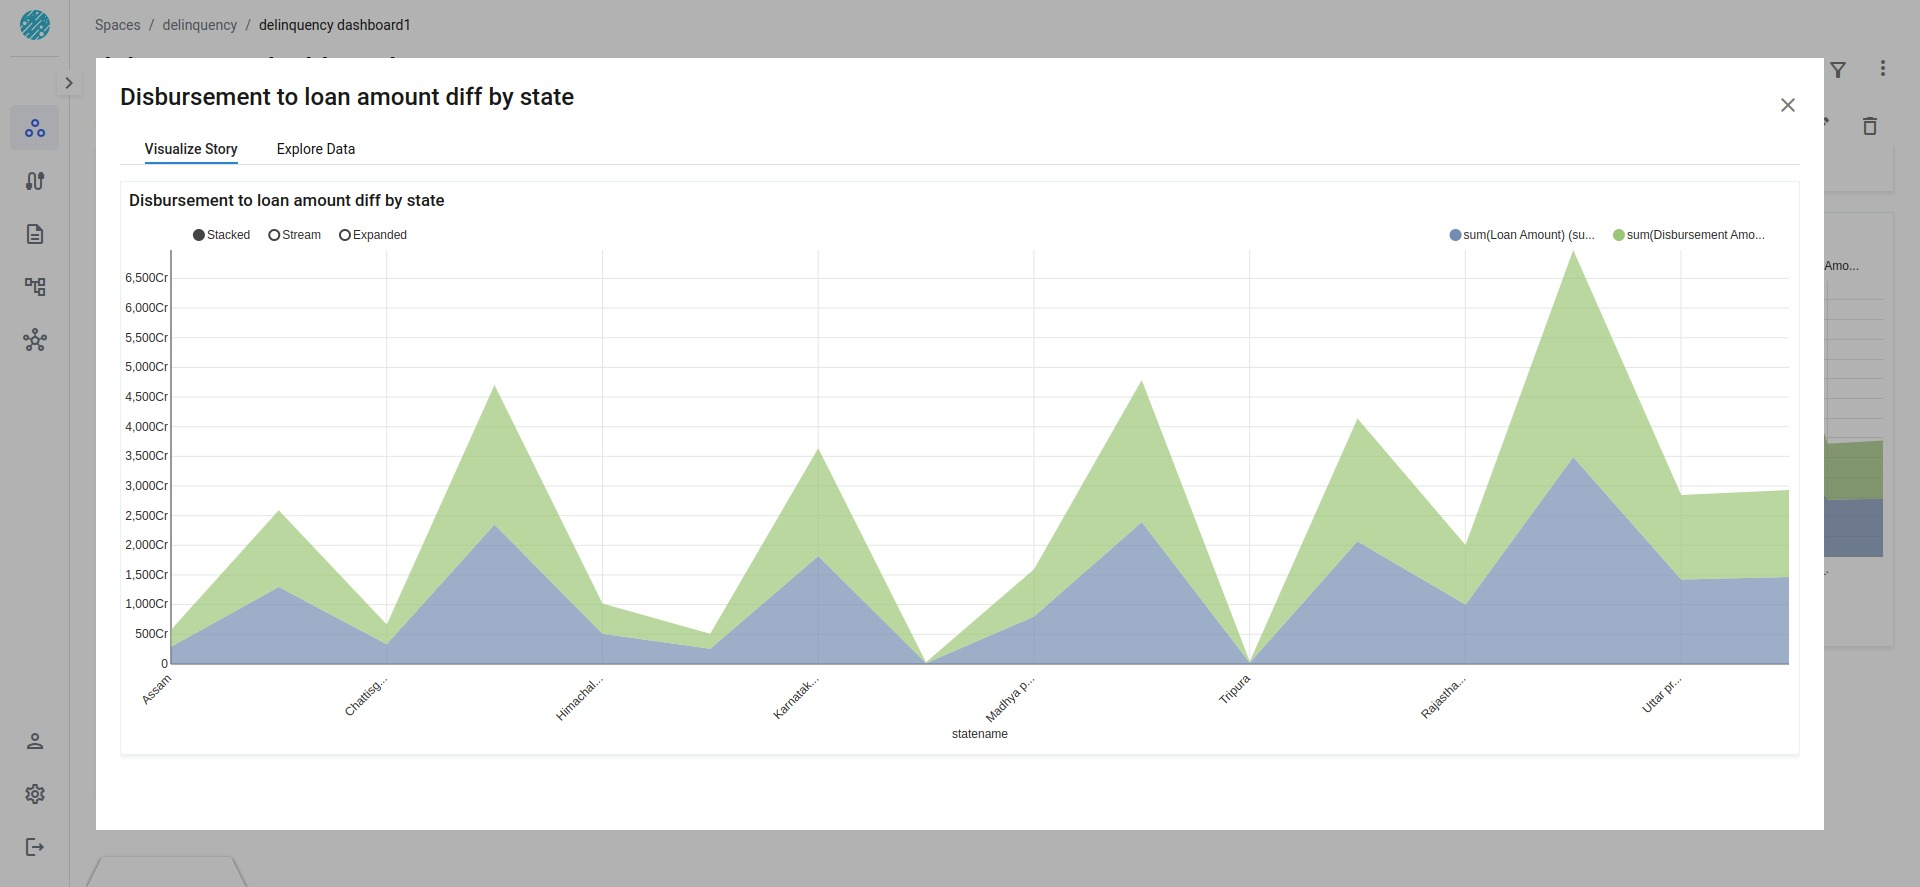
Stacked Area
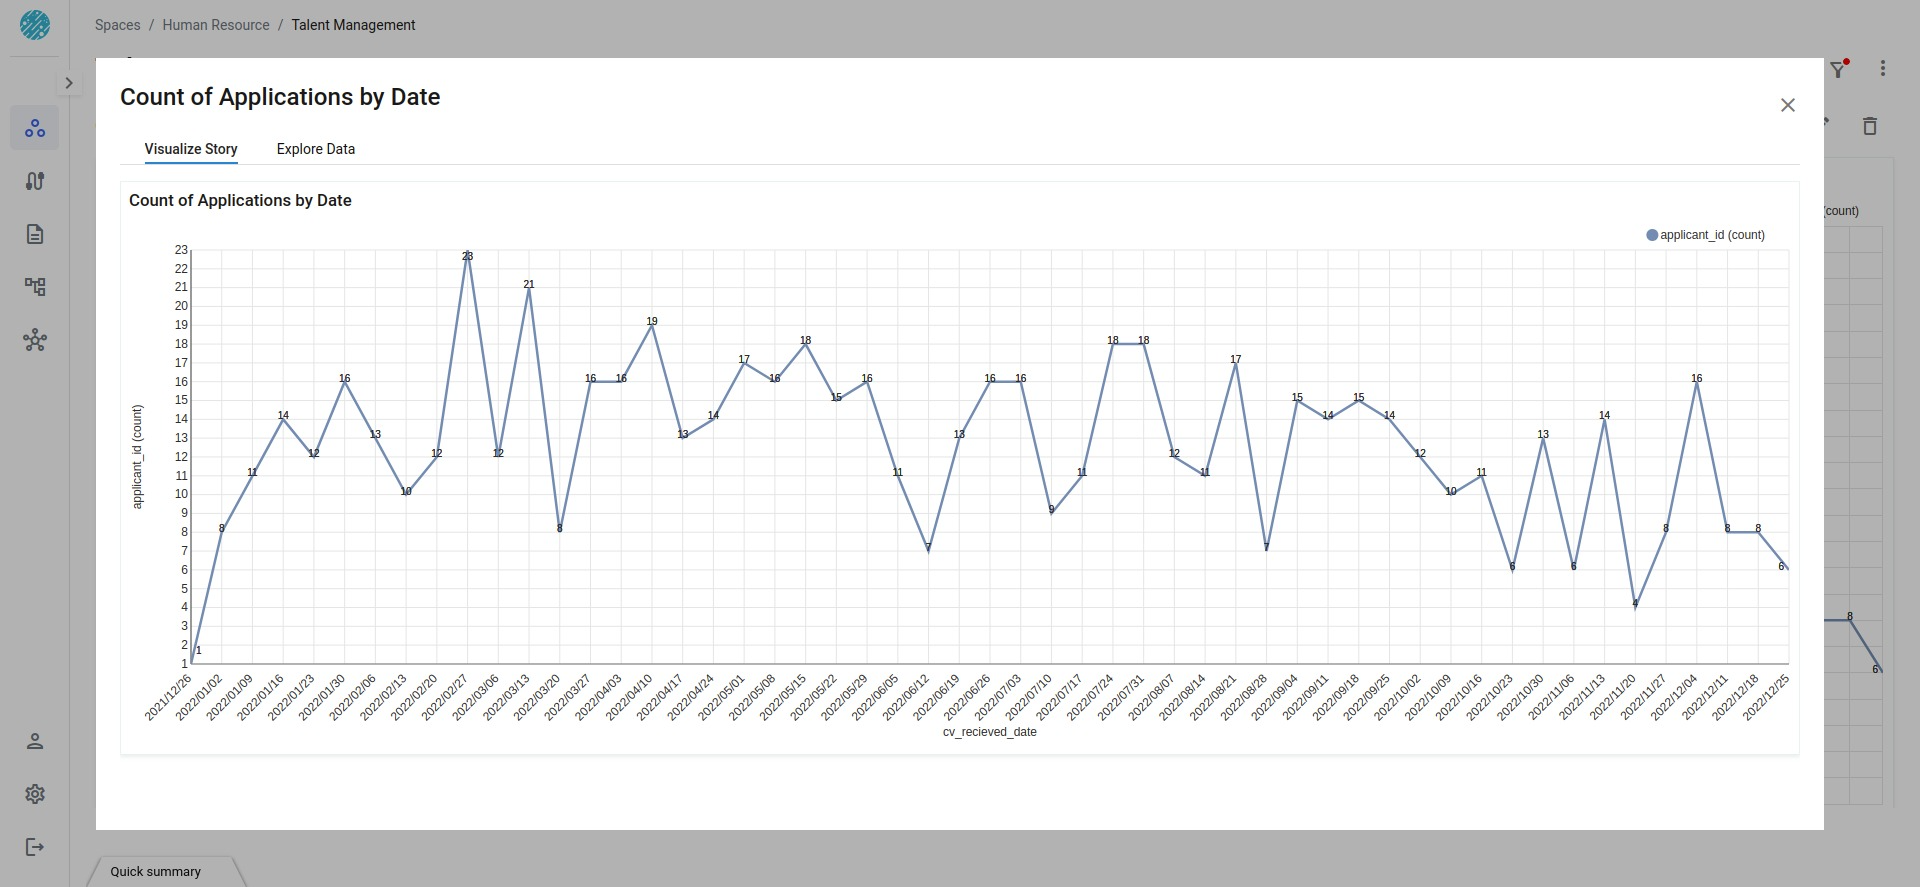
Line/Multiline
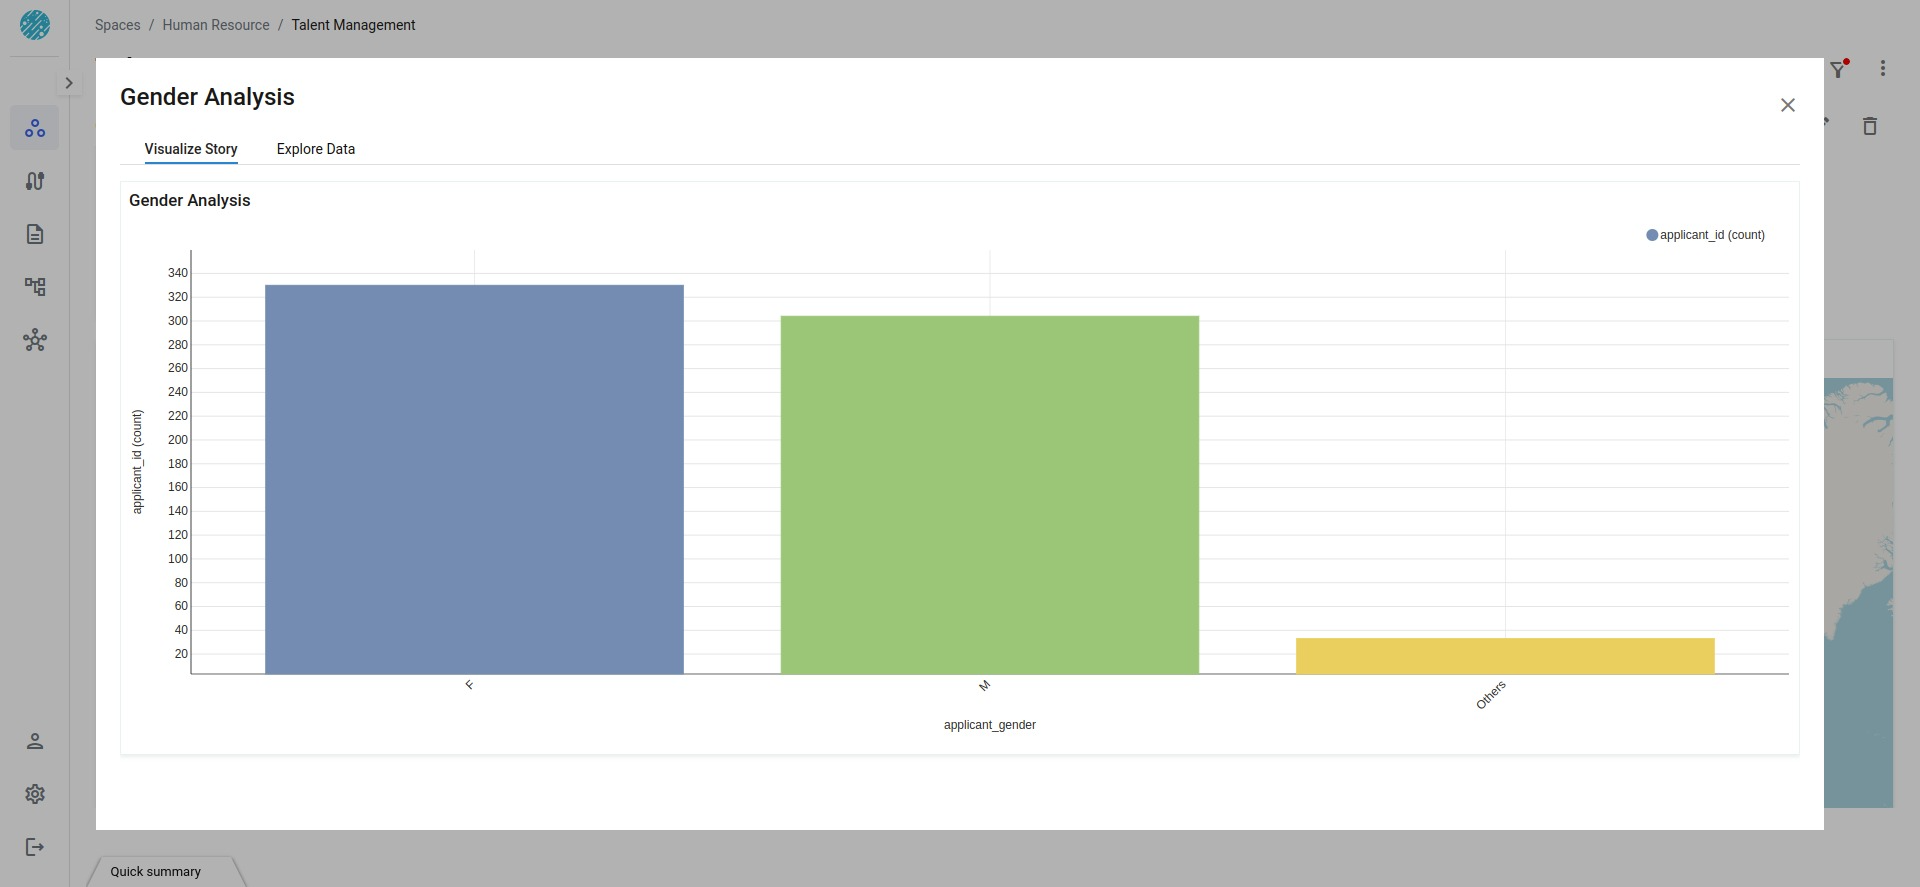
Vertical Bar Chart
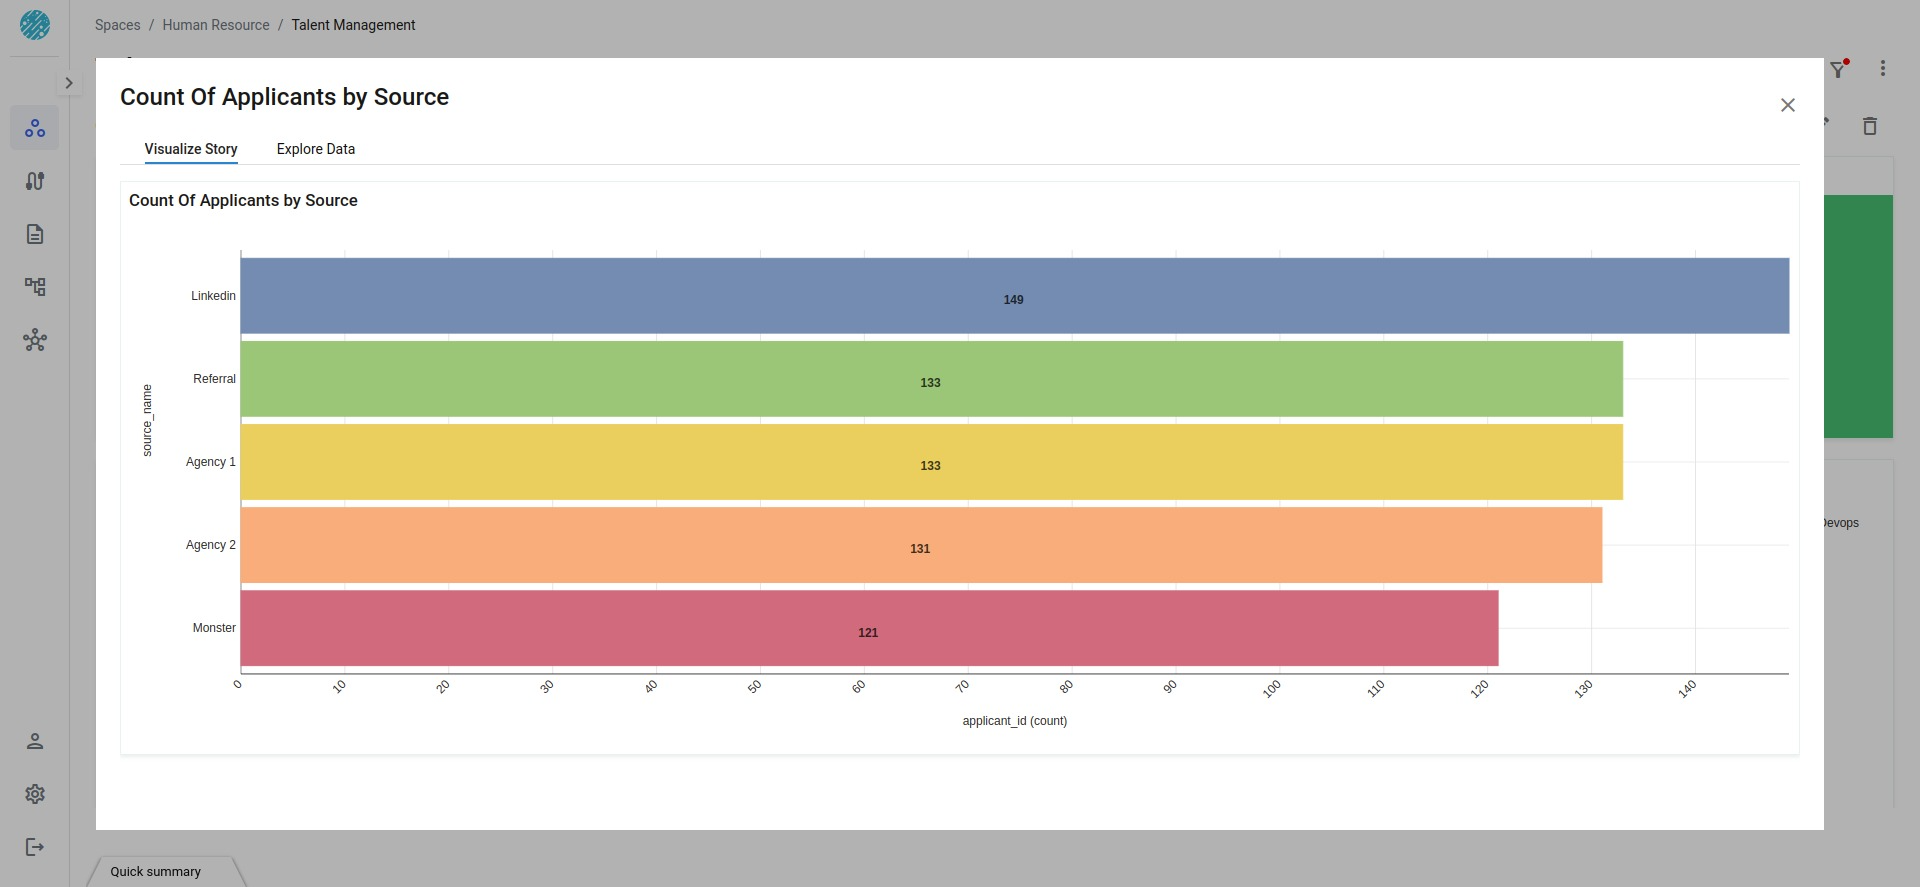
Horizontal Bar Chart
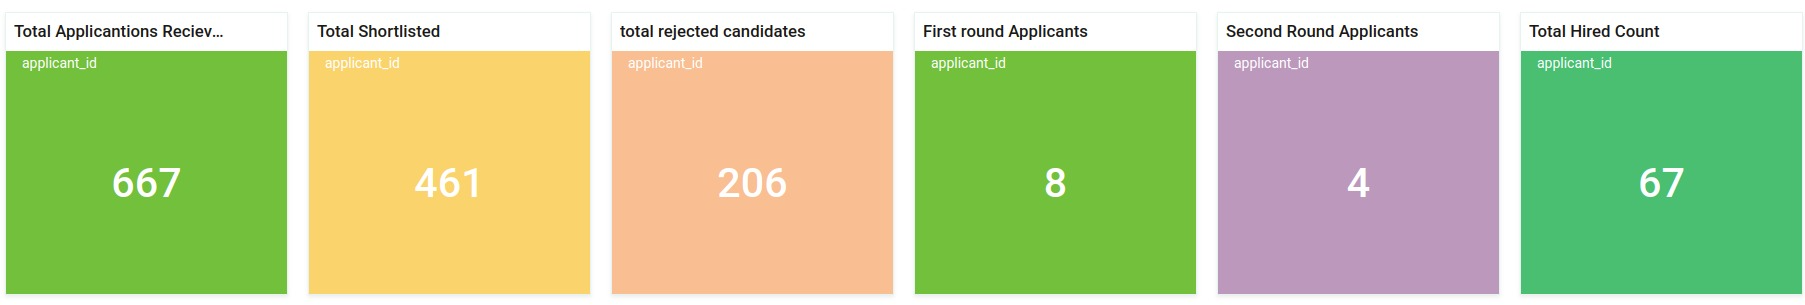
KPI Tile
Stacked Vertical
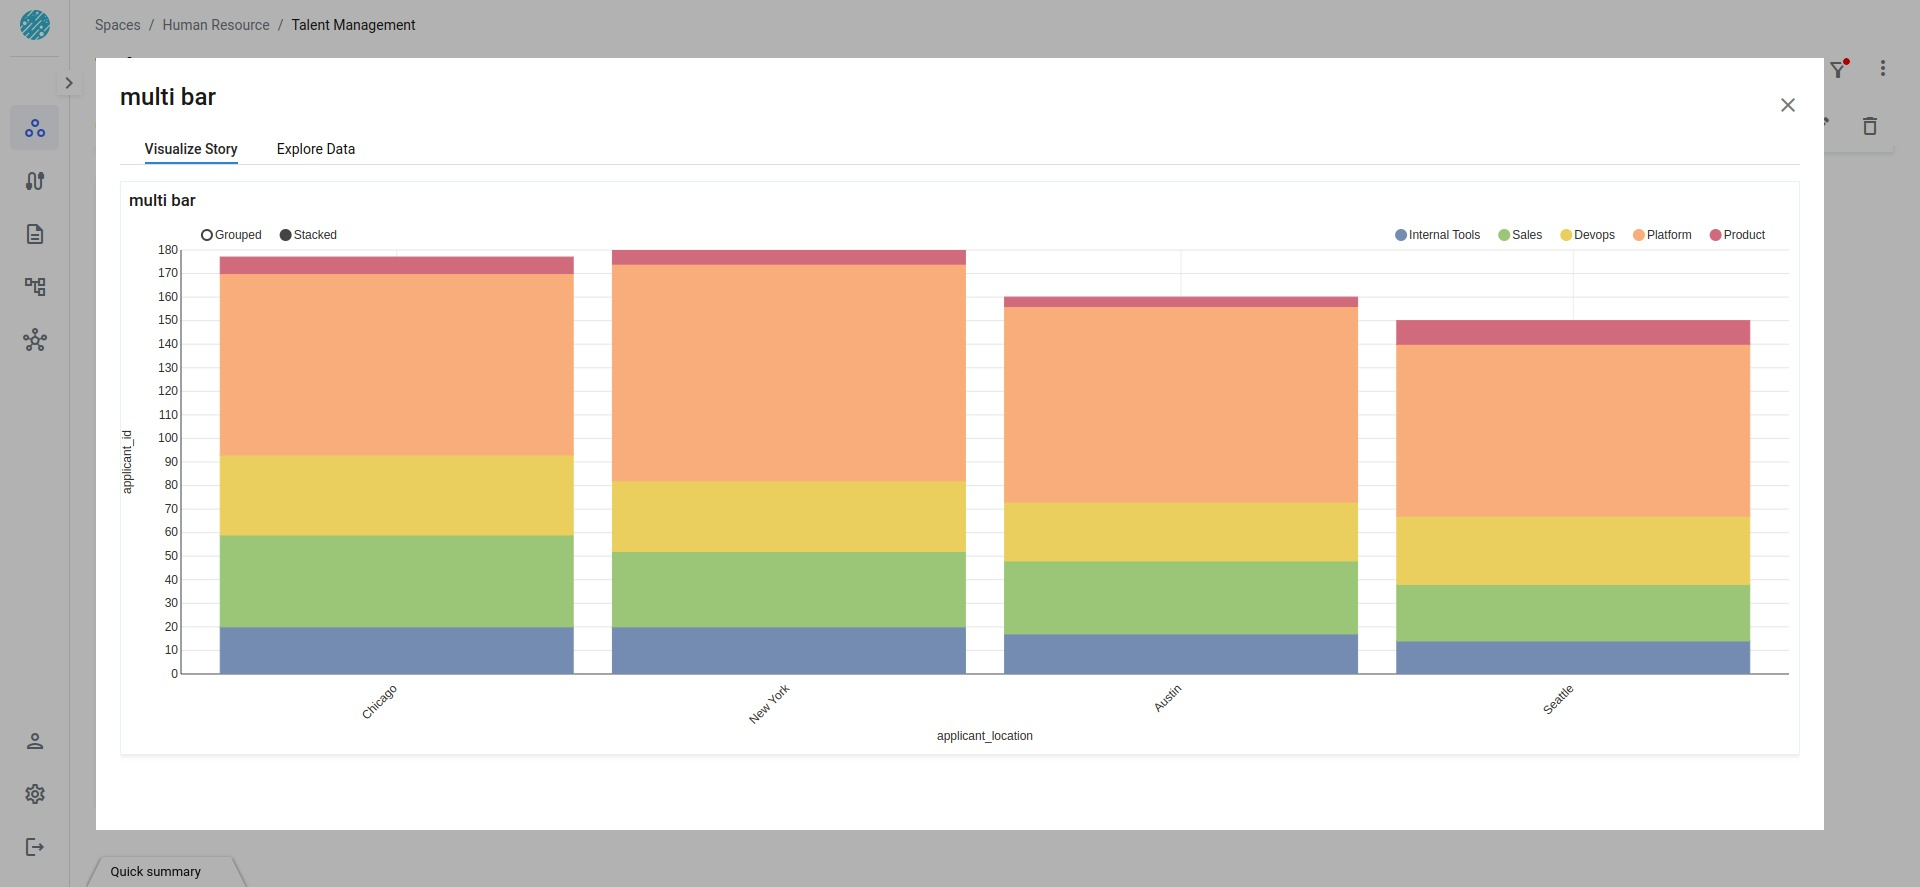
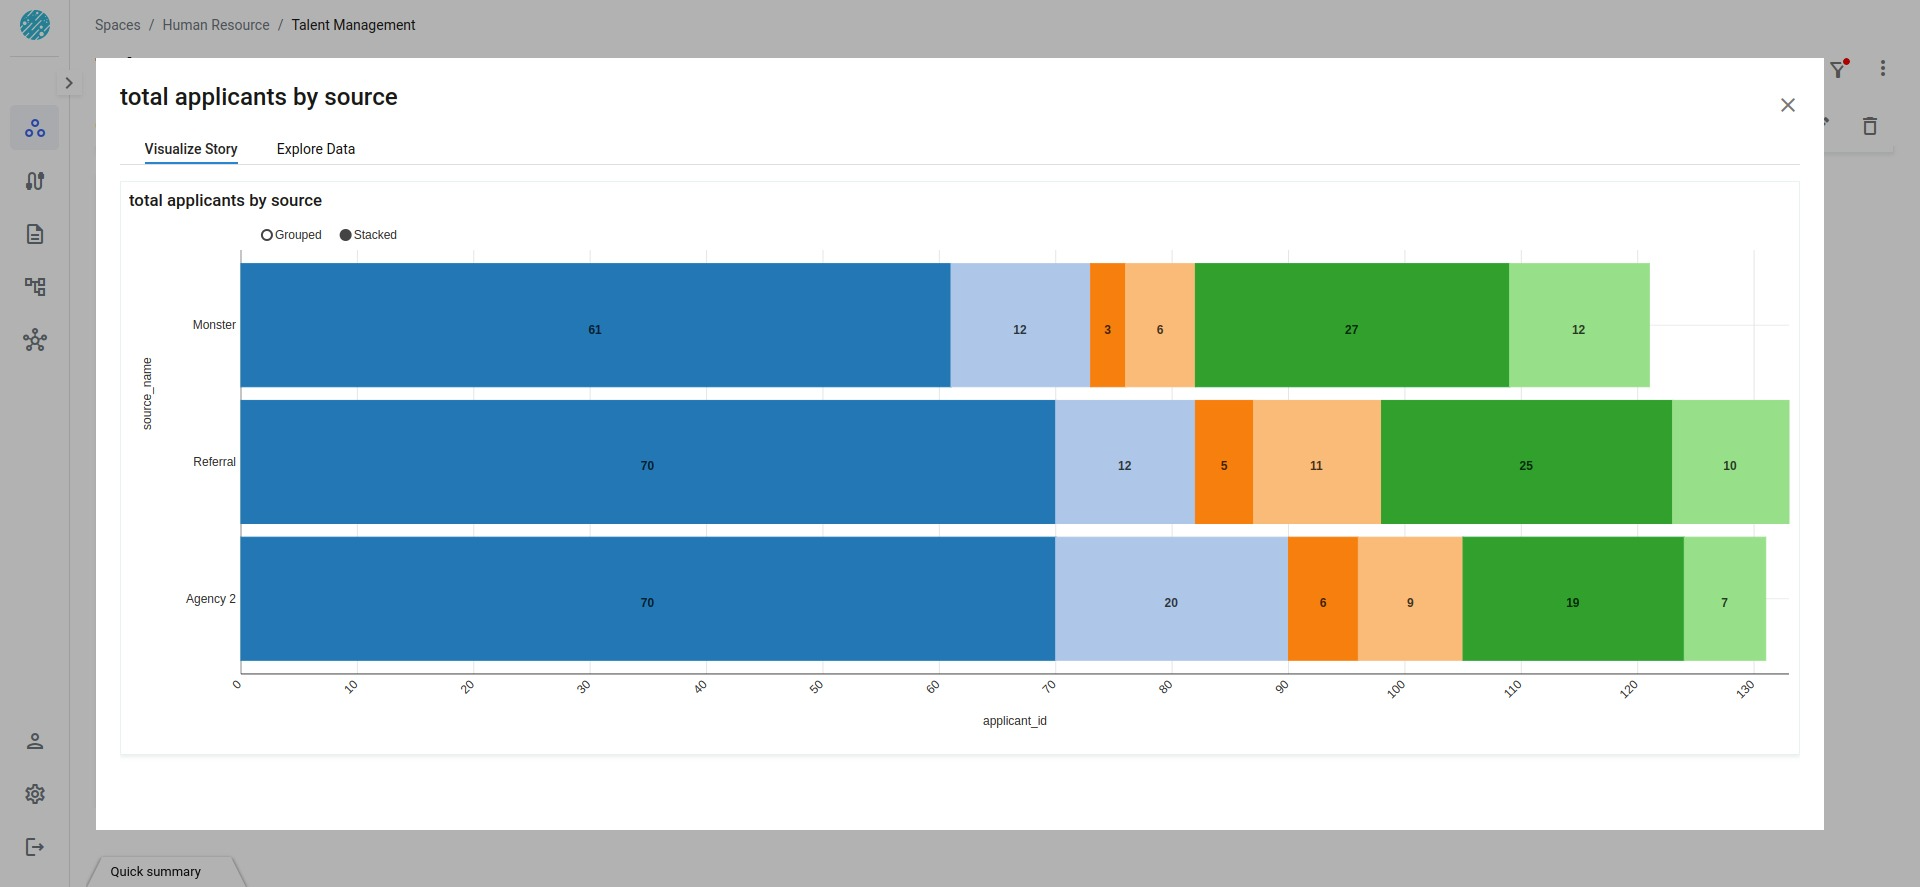
Stacked Horizontal
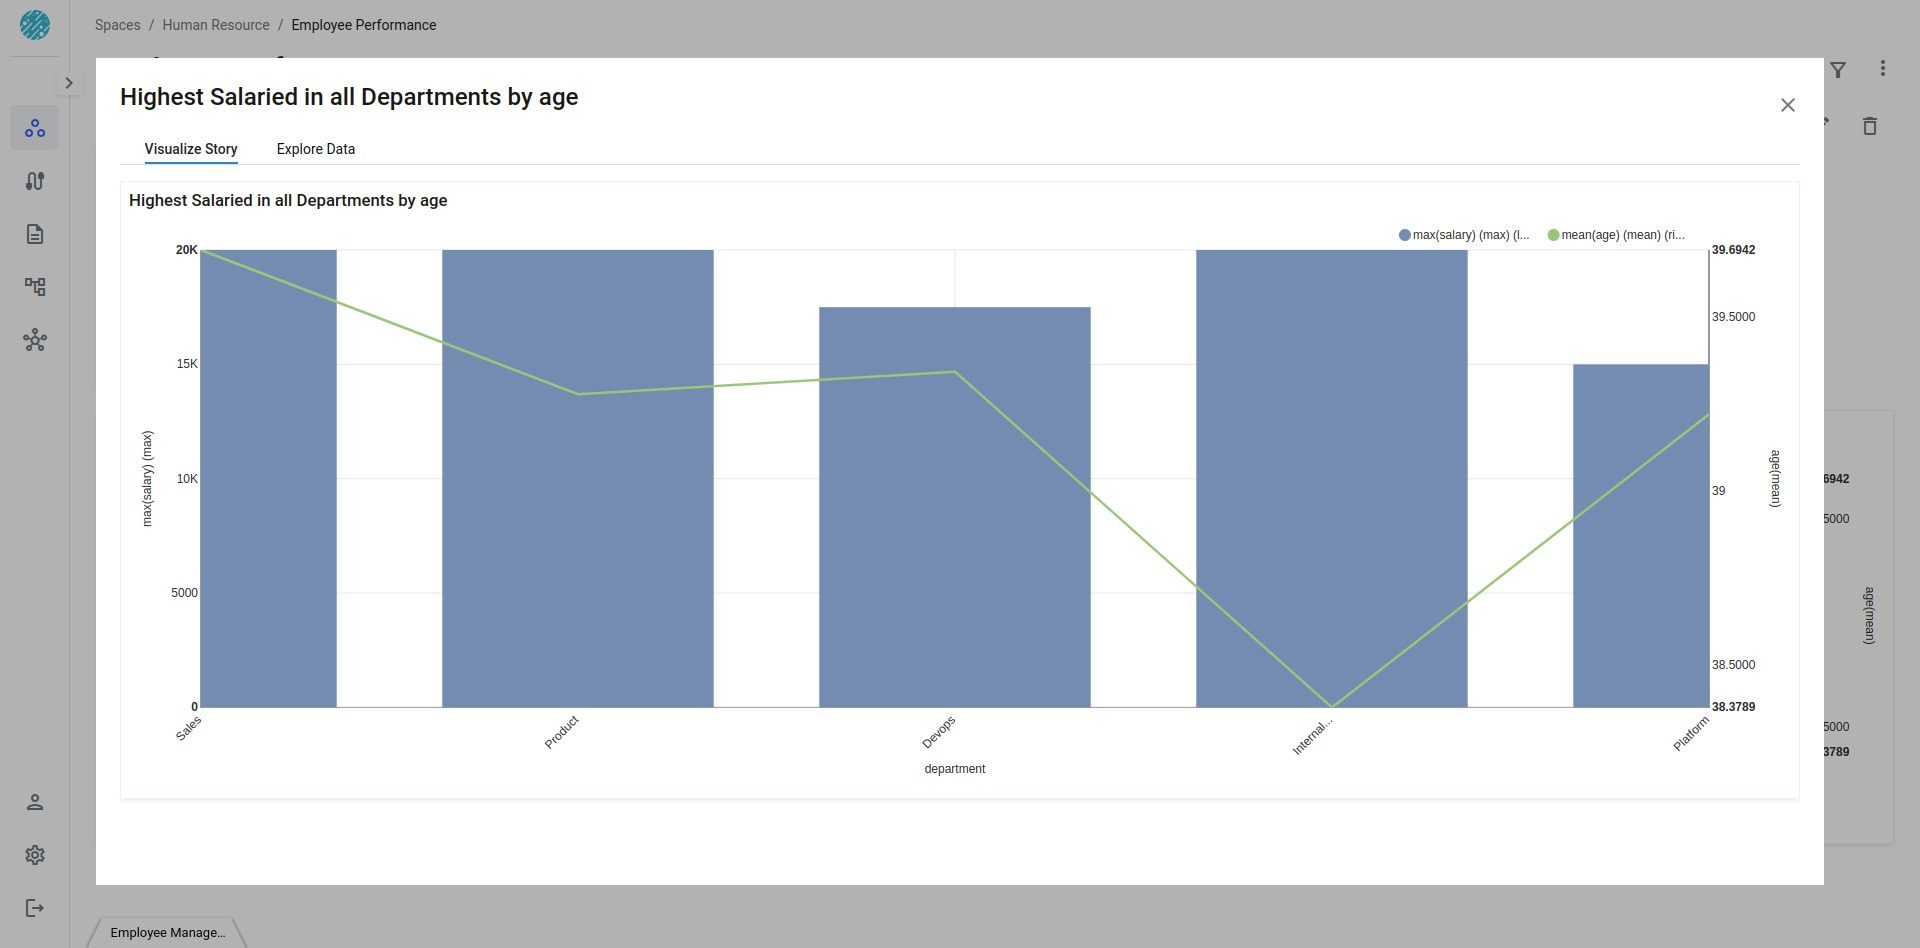
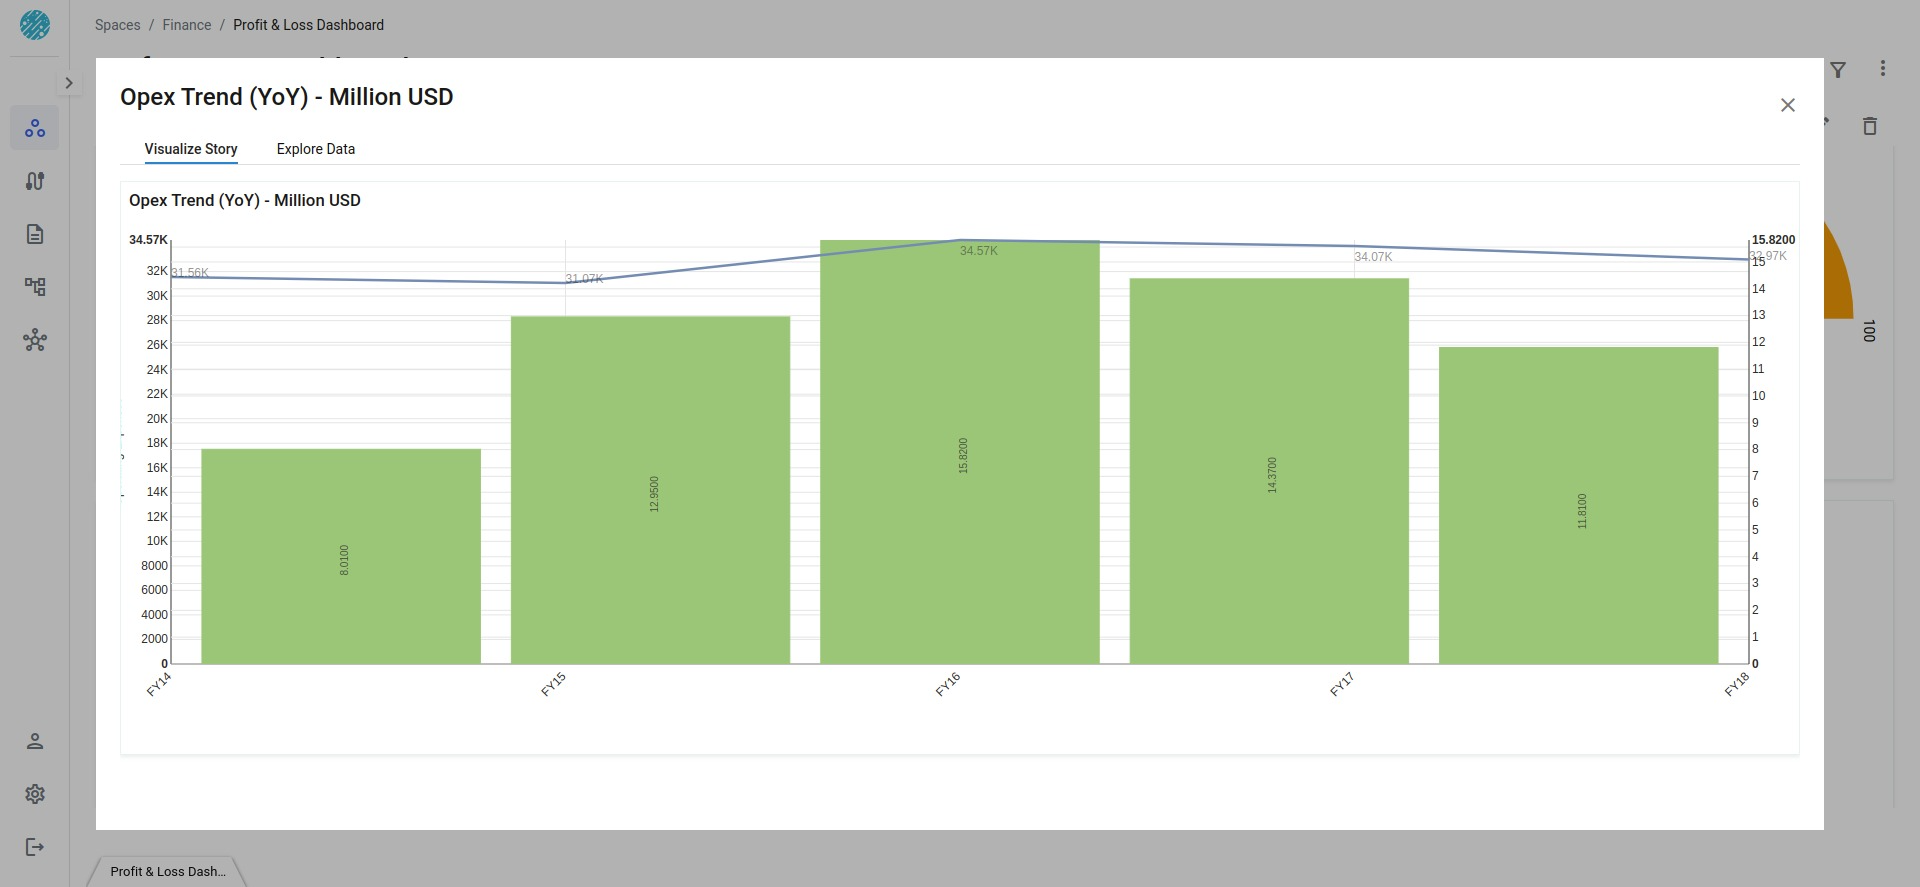
Line Plus Bar
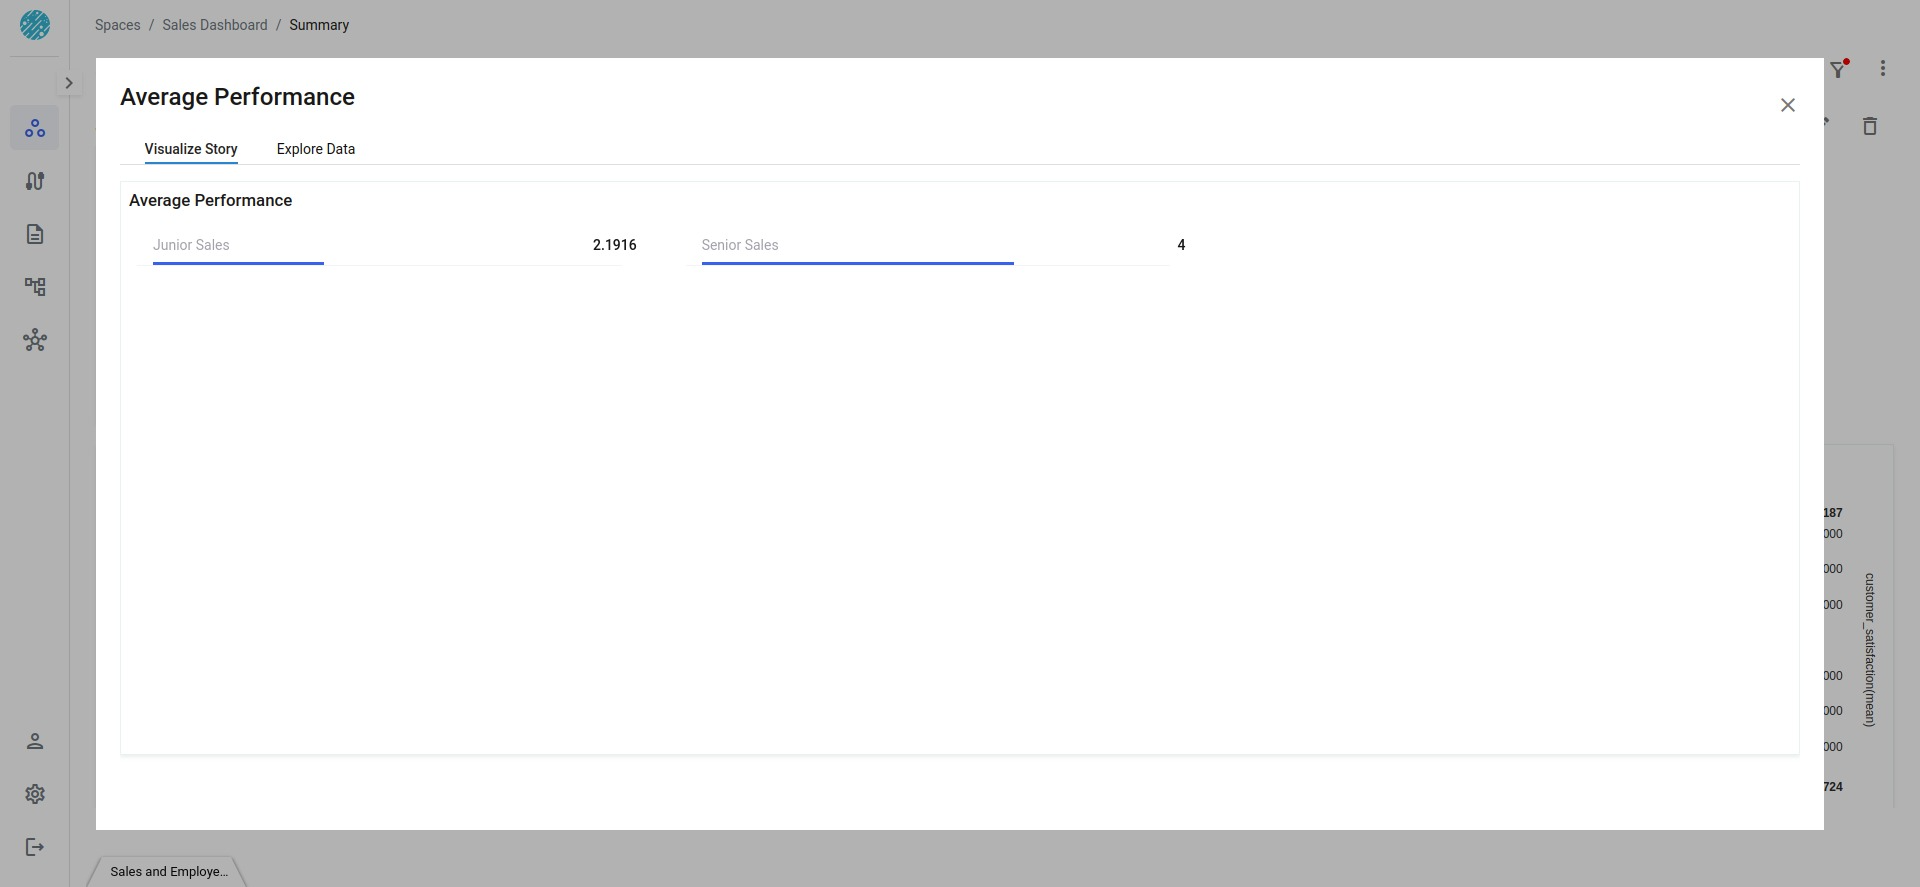
MultiKpi Table
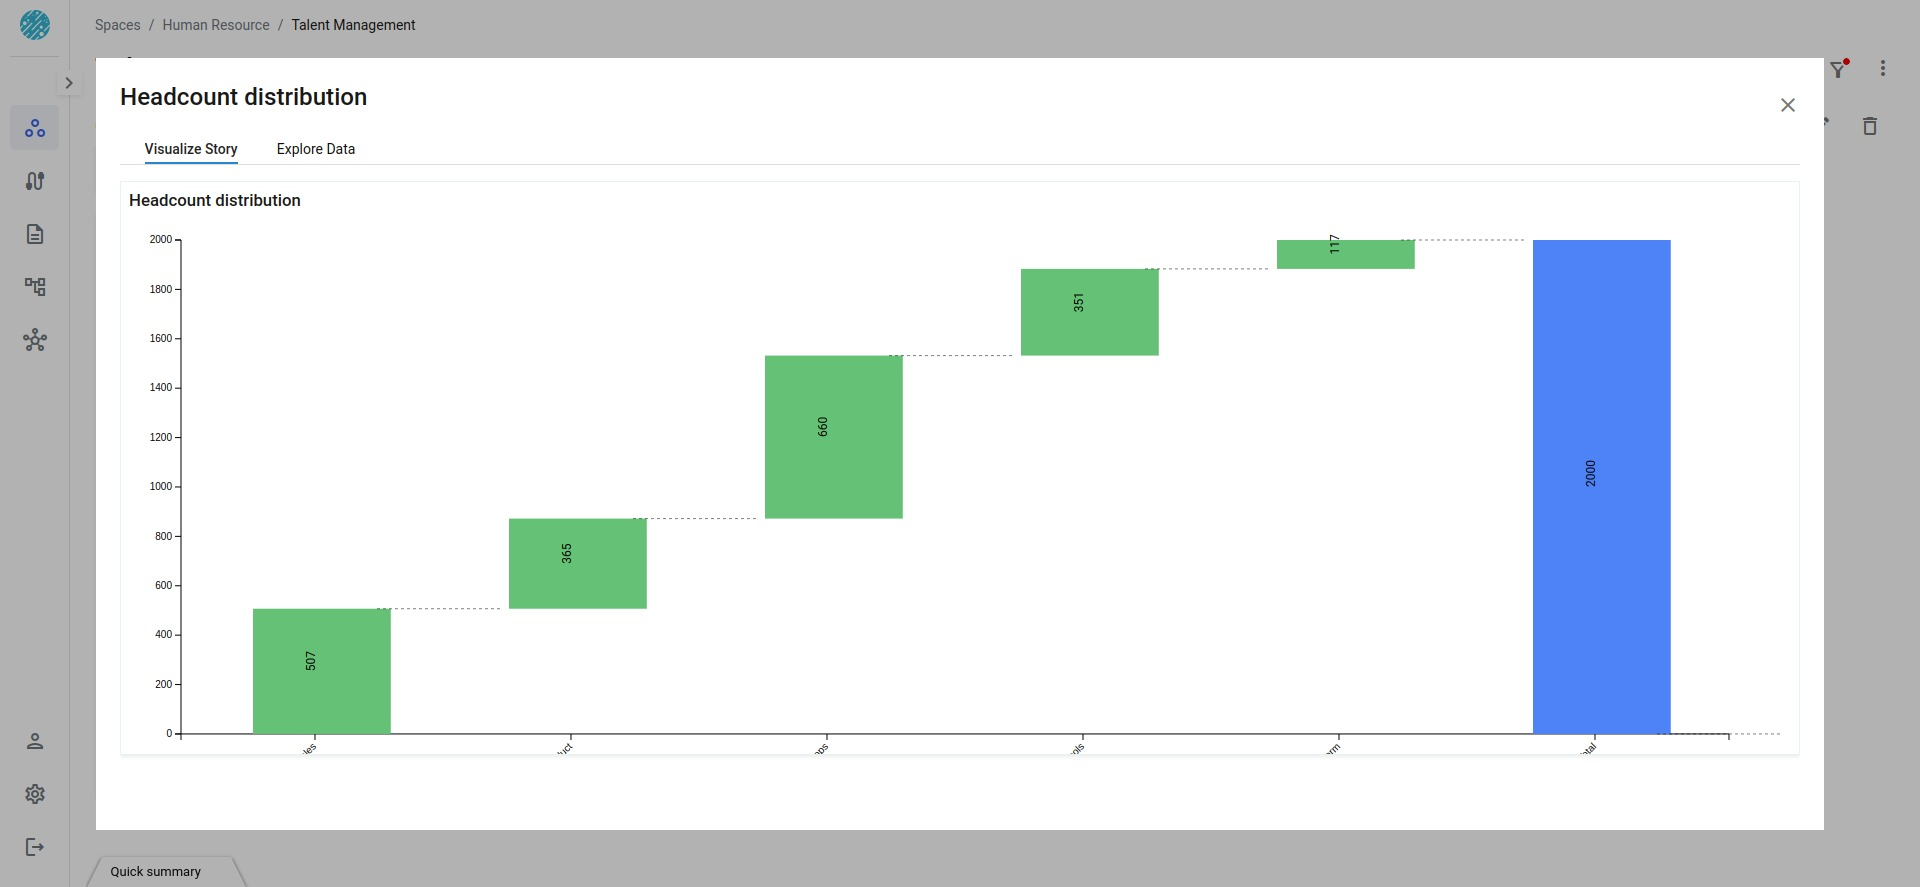
Waterfall
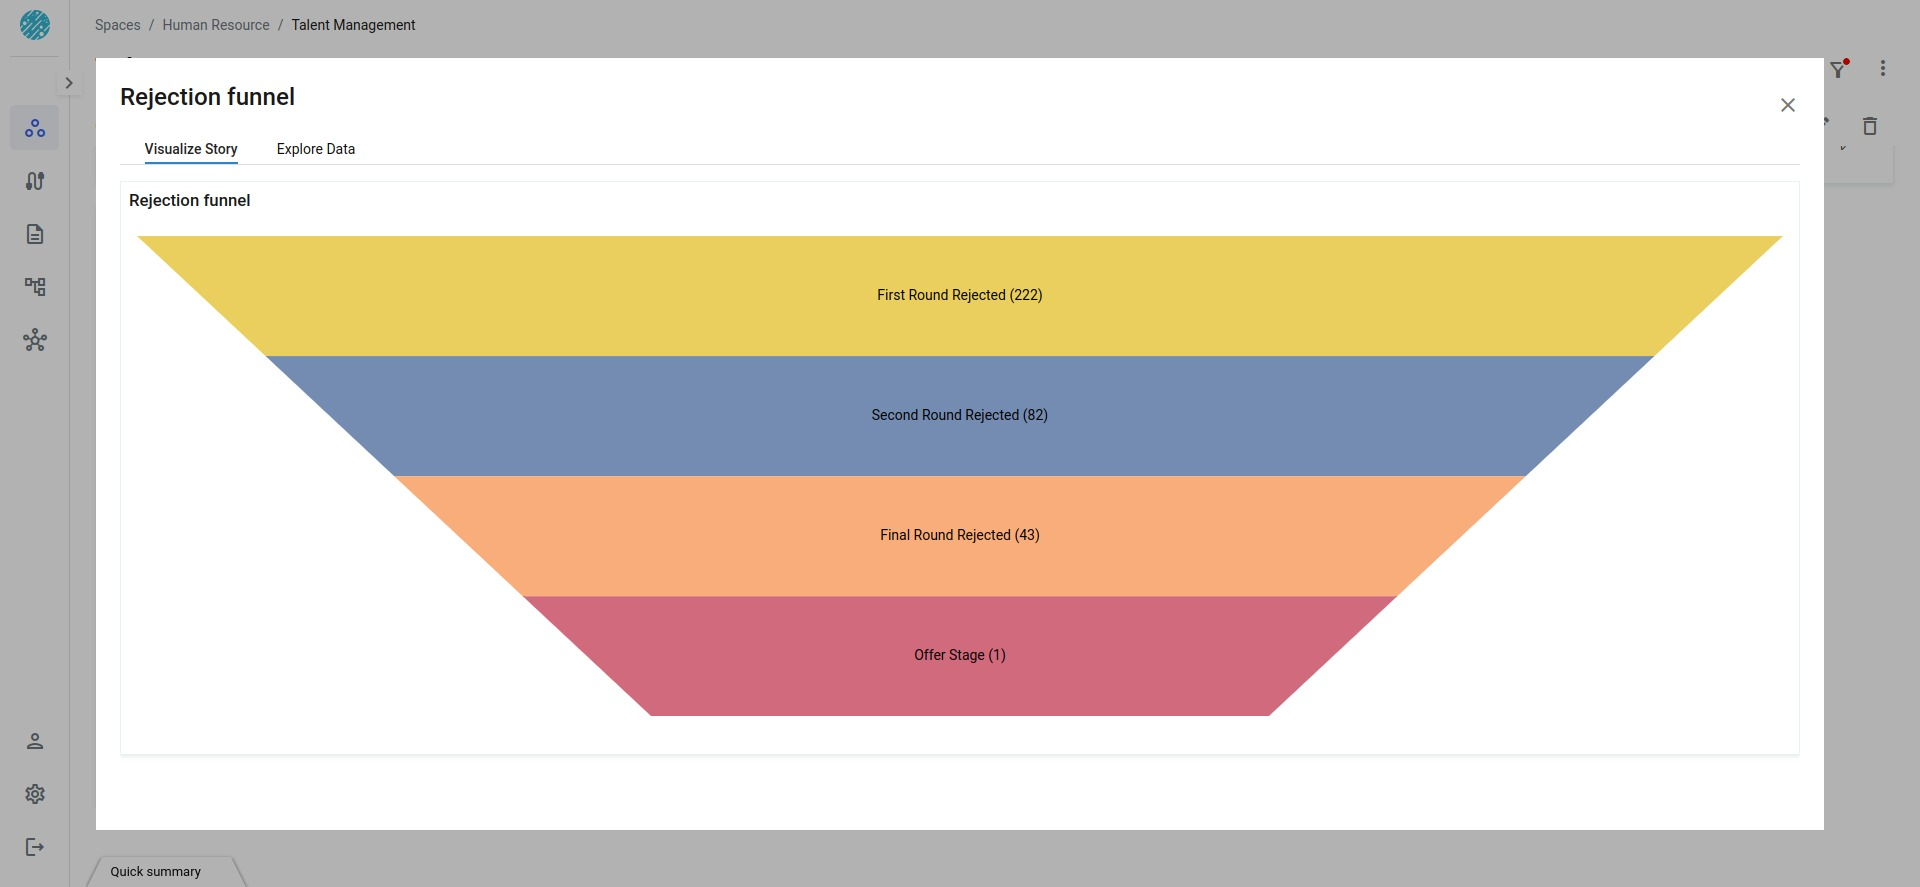
Funnel
Combo Chart
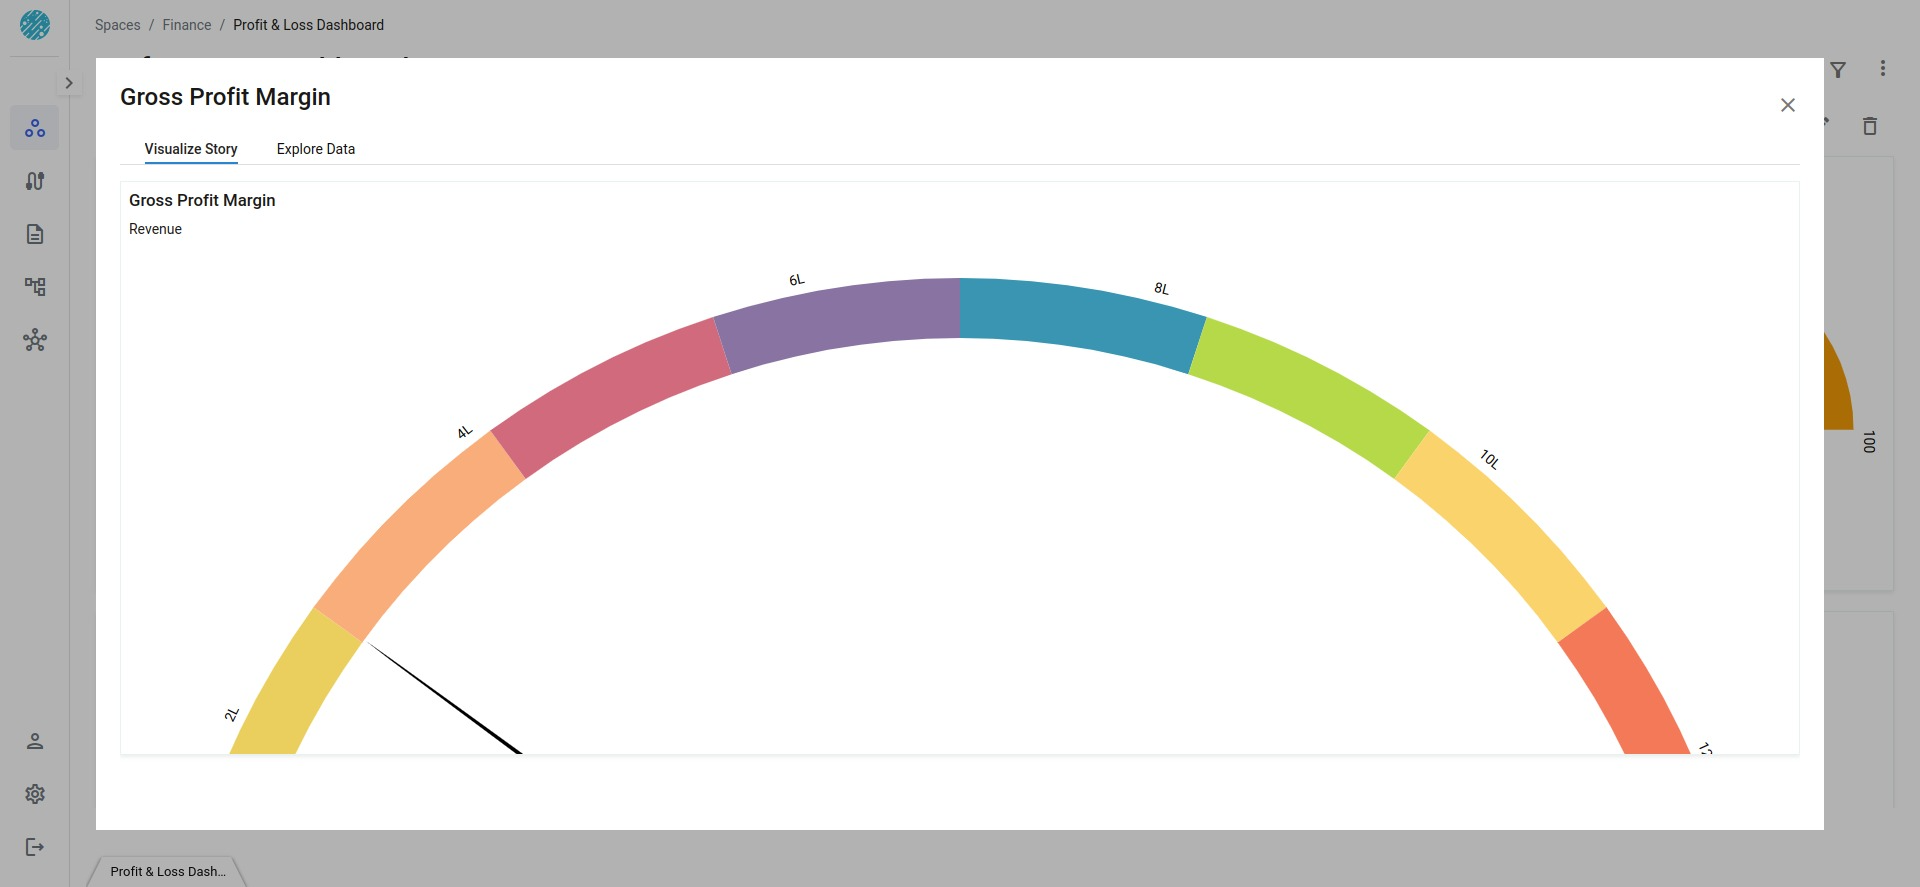
Gauge Chart
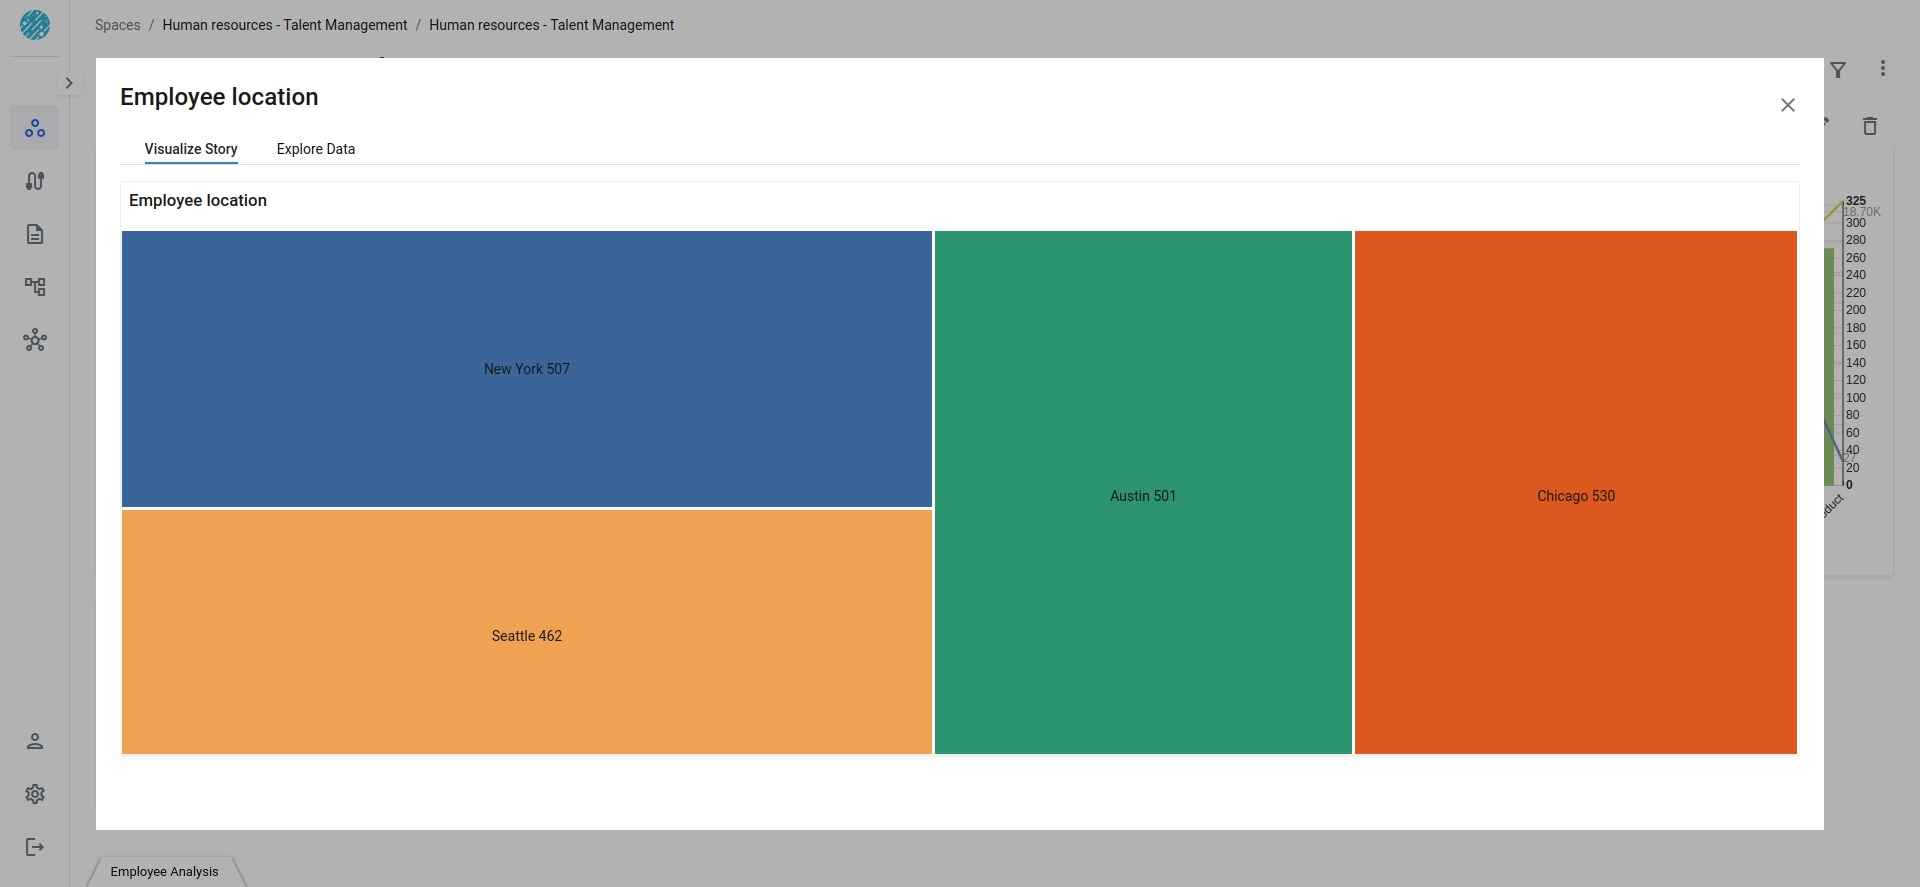
Treemap
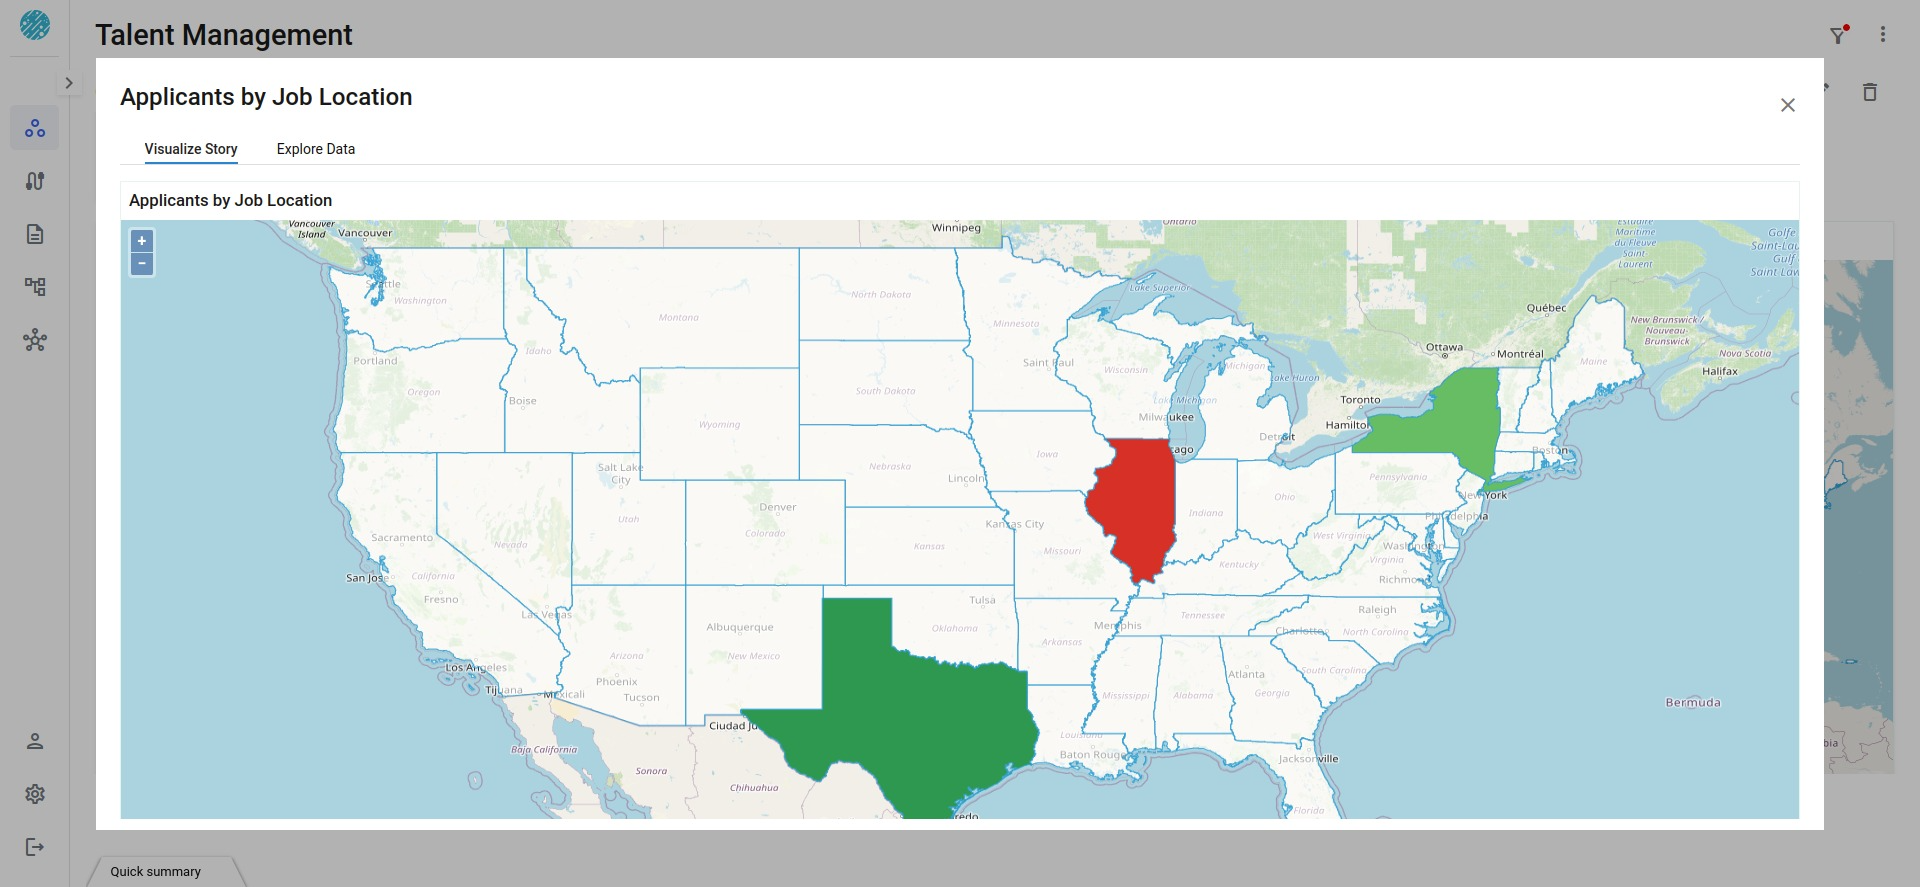
Area Map
Radial Chart