Dynamic Pricing

Background
Dynamic pricing is a method of setting product prices based on a variety of external variables, such as seasonality, supply changes, and price bounding. Within minutes, prices may change dynamically. Dynamic pricing's main tenet is that it is adaptable and based on current information.Only e-commerce normally makes advantage of dynamic pricing. Brick-and-mortar stores utilize predetermined prices that will persist for extended periods of time since they are more difficult to adjust. While dynamic pricing is based on current supply and chain dynamics. On an e-commerce site like Amazon, for instance, if stock for a specific product declines, you'll probably notice a spike in price within minutes. Another large corporation that uses dynamic pricing to maintain its competitiveness is Walmart.Utilizing dynamic pricing helps outperform your rivals. Using software for price optimization, one can keep a check on your rivals in real time to assess trends and decide on any pricing adjustments they want to make.Companies have more control over their rates ,thanks to dynamic pricing. They can modify prices in a matter of minutes with almost immediate consequences, as opposed to waiting to see if the goods and services are priced correctly. Because dynamic pricing involves the gathering and use of data to swiftly and intuitively alter prices, it can help save money.Other terms for dynamic pricing include surge pricing, demand pricing, and time-based pricing.
A company can employ a wide range of dynamic pricing strategies. Here are a few examples of how businesses might adapt their pricing.
- Peak dynamic pricing: When a product is in demand, prices are higher. For instance, if you sell swimwear or pool supplies, you might raise your prices in the summer.
- Segmented dynamic pricing: Geography is the basis for this form of segmented dynamic pricing. For instance, you might mark up your prices in regions with higher yearly cost of living (and therefore higher-income customers).
- Market changes: The price of a product might go up or down depending on supply and demand. Normally, you would charge more for a product that is in high demand and less for one that you had an abundance of.
Benefits:
- Modifying things more quickly and profitably in terms of revenue. Your company will be better able to react to market developments as a result and become more aware of them. For instance, offering discounts can achieve the desired reduction if a certain item is overstocked.
- Price optimization gives you the opportunity to monitor and modify your prices in relation to those of your rivals.
- Gaining more insight on market trends. You would be able to learn vital insights. What products are the most popular? who are the competitors, and at what cost?
Price optimization with machine learning advantages:
Using machine learning to improve prices has a number of benefits in addition to automation and speed.
-
Machine learning models are able to take into account a vast variety of products and internationally optimize prices. They are able to use precise criteria because of the variety and number of parameters, as well as their many sources and channels. If shops attempt to complete this manually, or even with simple software, it will be a difficult effort.
-
A machine learning model can predict trends early enough by studying a lot of historical and current data. This is a crucial problem that enables sellers to decide how to modify prices.
-
In the case of a competitive pricing strategy, machine learning solutions can continuously scour the web and social media to obtain meaningful data about competitors' prices for the same or similar products, what customers are saying about the products and competitors, taking into account hot deals, as well as the price history over the previous few days or weeks.
Objective
This usecase helps estimate and suggest product prices to sellers based on various factors such as product demand, region, market changes etc. This gives an opportunity to modify prices dynamically and boost profitability.
Relevance of Xceed
Xceed Analytics provides a single integrated data and AI platform that reduces friction in bring data and building machine models rapidly. It further empowers everyone including Citizen Data Engineers/Scientist to bring data together and build and delivery data and ml usecases rapidly. It's Low code/No code visual designer and model builder can be leveraged to bridge the gap and expand the availability of key data science and engineering skills.
This usecase showcases how to create, train/test and deploy a dynamic pricing regression model. The dataset was collected from Kaggle.This includes the dynamic price suggestion dataset. Xceed will provide a NO-CODE environment for the end-to-end implementation of this project, starting with the uploading of datasets from numerous sources to the deployment of the model at the end point. All of these steps are built using Visual Workflow Designer, from analyzing the data to constructing a model and deploying it.
Data Requirements
We will be using the following dataset for this usecase:
- Dynamic price suggestion dataset: This dataset contains user-submitted text descriptions of the products that include information like the name of the product category, the brand, and the condition of the item.
Columns of interest in the dataset :
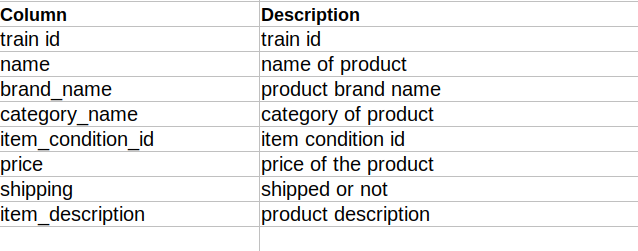
Model Objectives
Understanding trends in the dataset and estimating the prices of products by analysing the underlying data, constructing a regression machine learning model, and implementing it after defining the model's major features to suggest right prices to the seller.
Steps followed to develop and deploy the model
- Upload the data to Xceed Analytics and create a dataset
- Create the Workflow for the experiment
- Perform initial exploration of data columns.
- Perform Cleanup and Tranform operations
- Build/Train a regression Model
- Review the model output and Evaluate the model
- Improve on the metrics which will be useful for the productionizing
- Deploy/Publish the model
Upload the data to Xceed Analytcs and Create the dataset
- From the Data Connections Page, upload the the dataset to Xceed Analytics. For more information on Data Connections refer to Data Connections
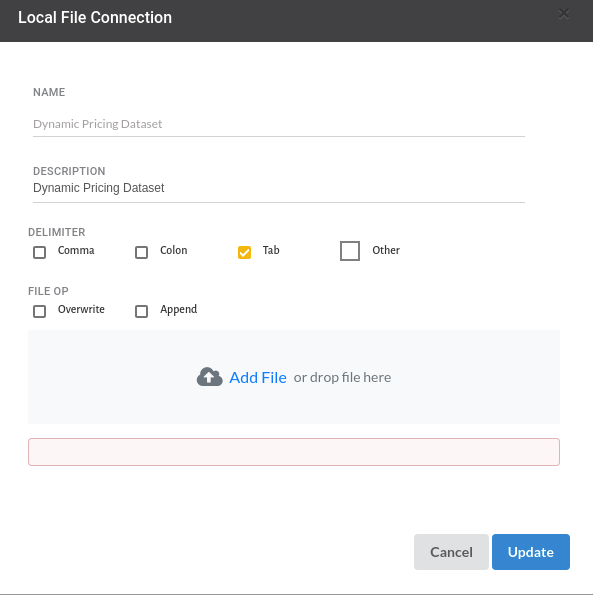
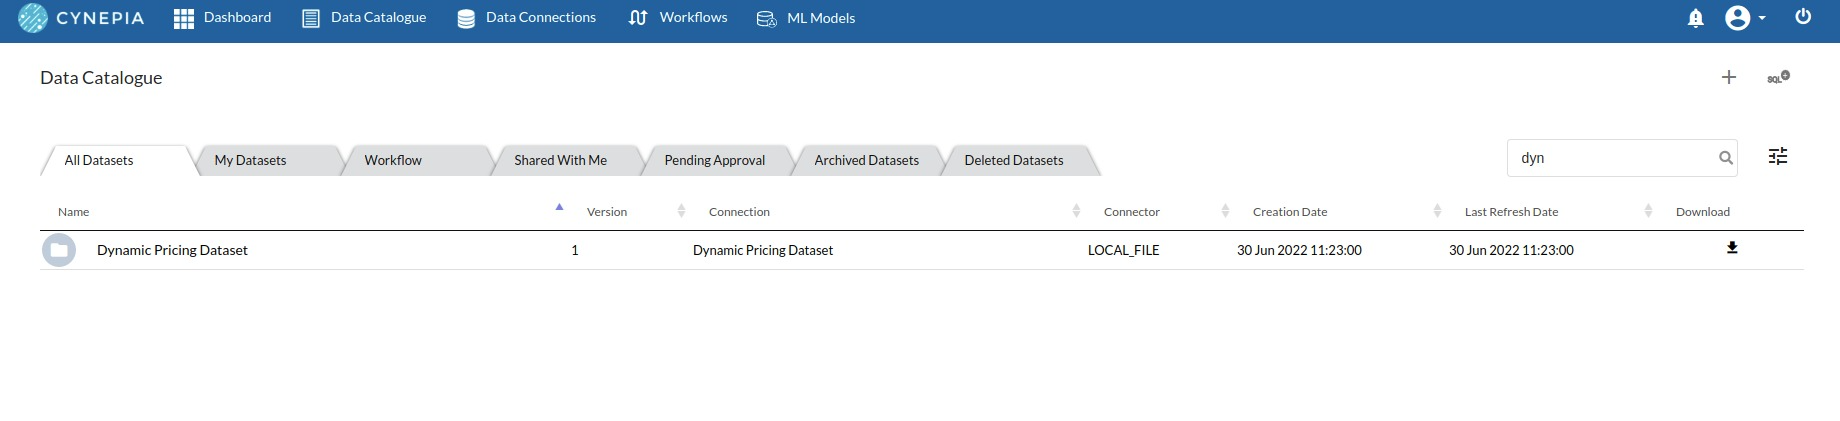
- Create a dataset for each dataset from the uploaded datasource in the data catalogue. Refer to Data Catalogue for more information on how to generate a dataset.
Create the Workflow for the experiment
- Create a Workflow by going to the Workflows Tab in the Navigation.Refer Create Workflow for more information.
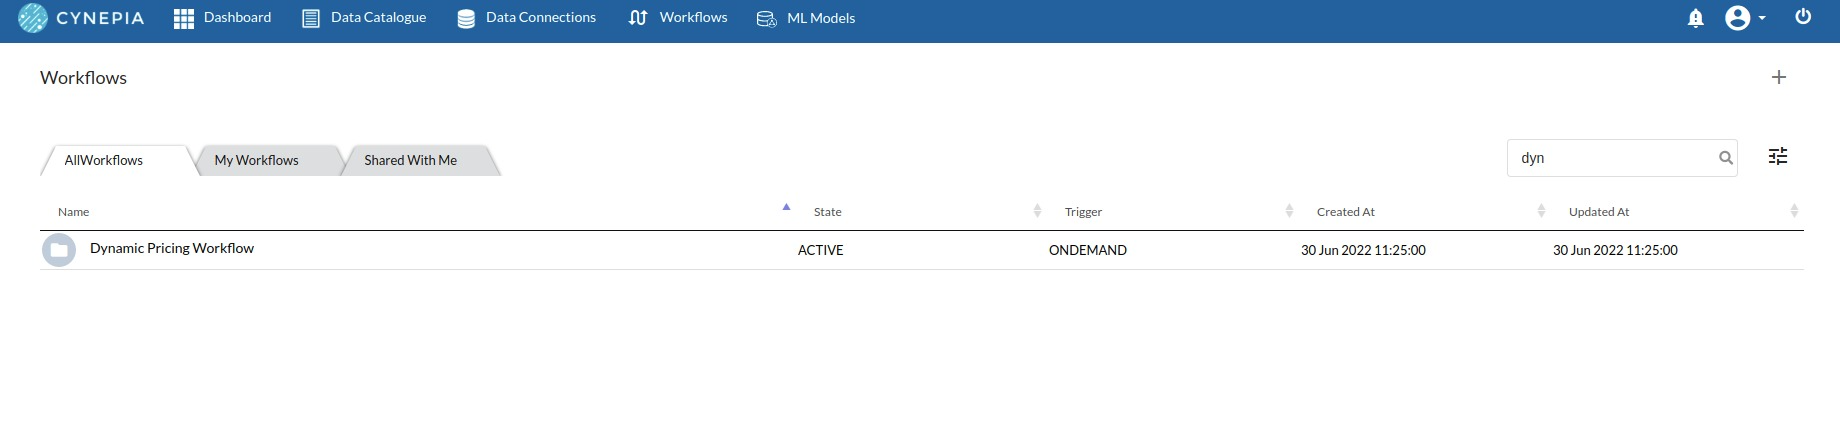
To navigate to the workflow Details Page, double-click on the Workflow List Item and then click Design Workflow. Visit the Workflow Designer Main Page for additional information.
- By clicking on + icon you can add the Input Dataset to the step view. The input step will be added to the Step View.
Perform initial exploration of data columns.
- Examine the output view with Header Profile, paying special attention to the column datatypes. for more information refer to output window
- Column Statistics Tab (Refer to Column Statistics for more details on individual KPI)
Perform Cleanup and Transform Operations
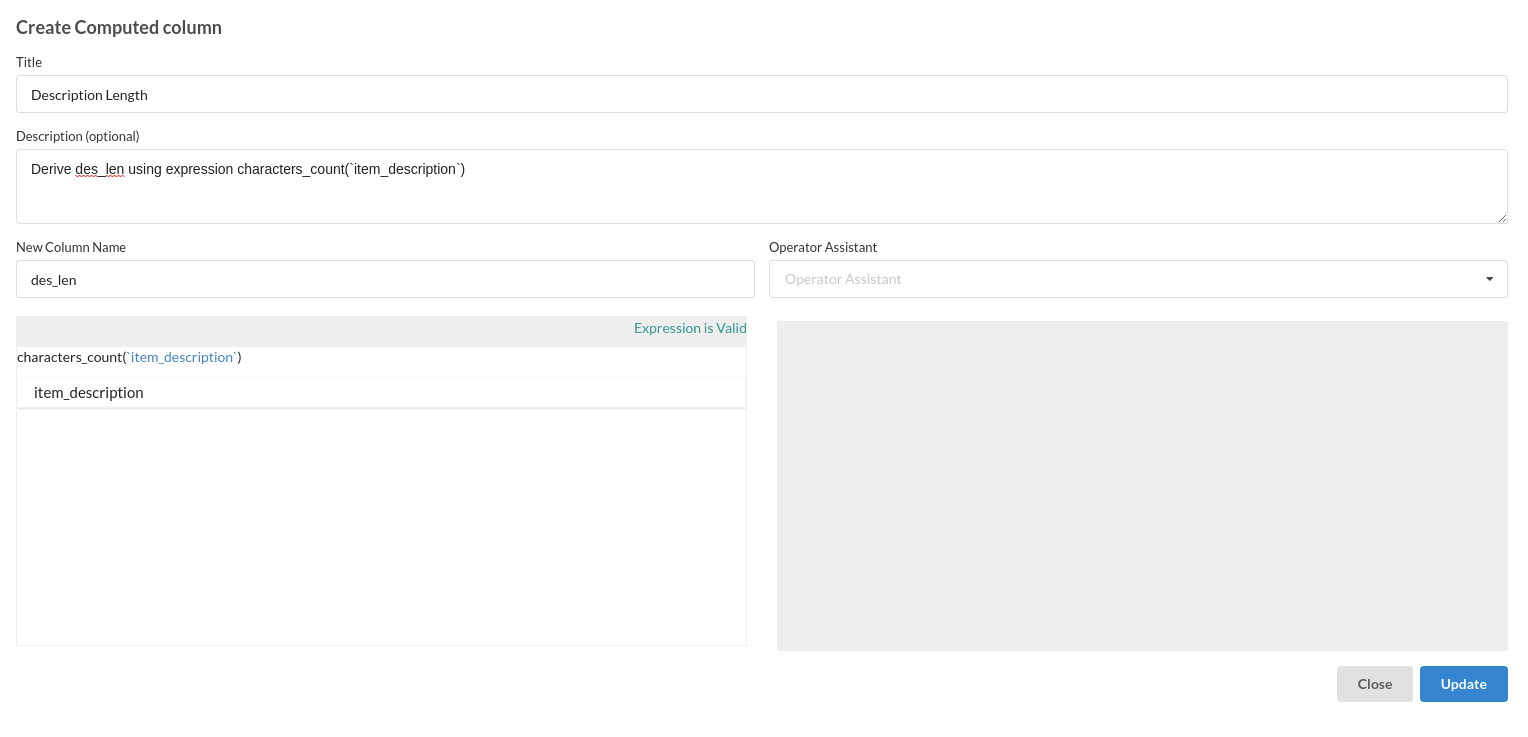
- Add Column Description length
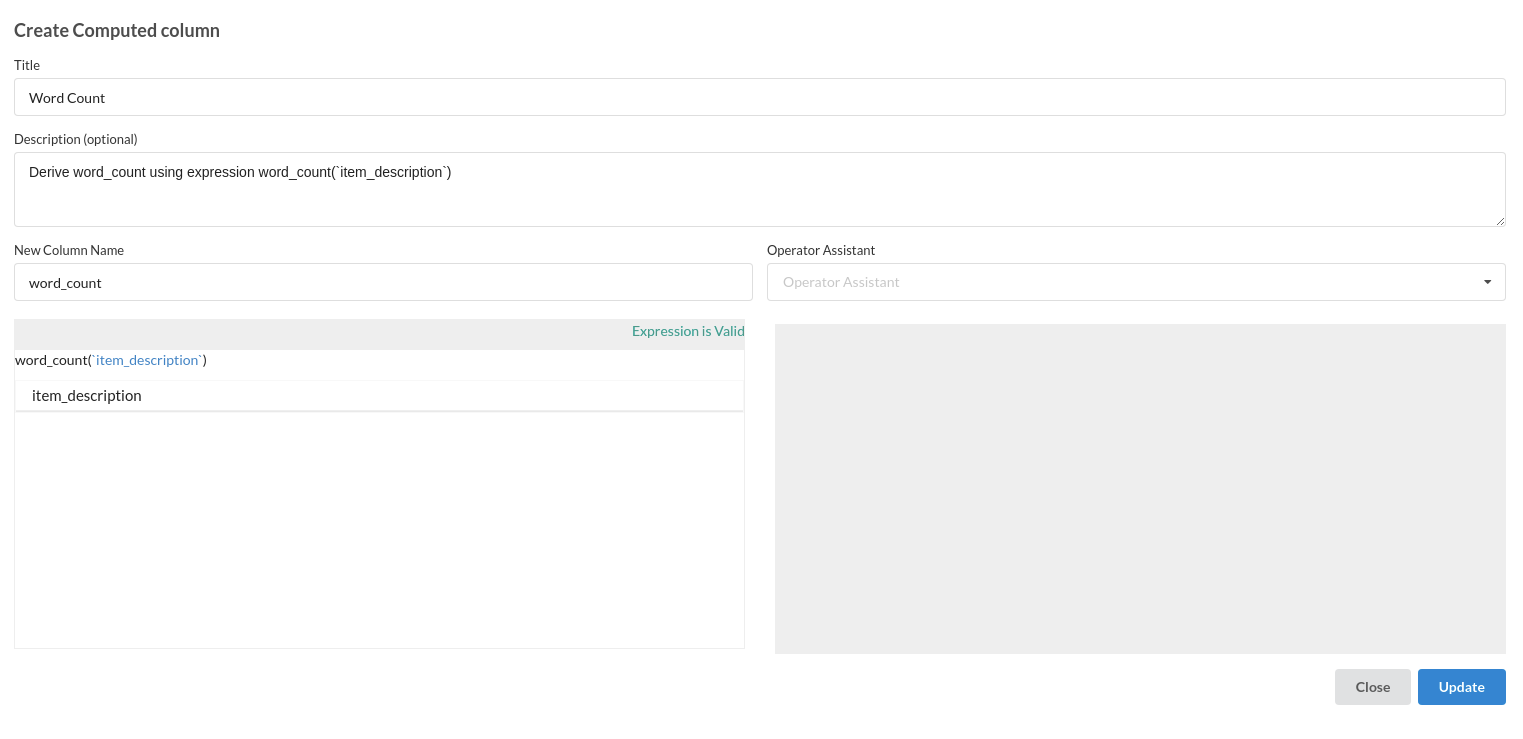
- Add Column Word Count
- Compute mean description

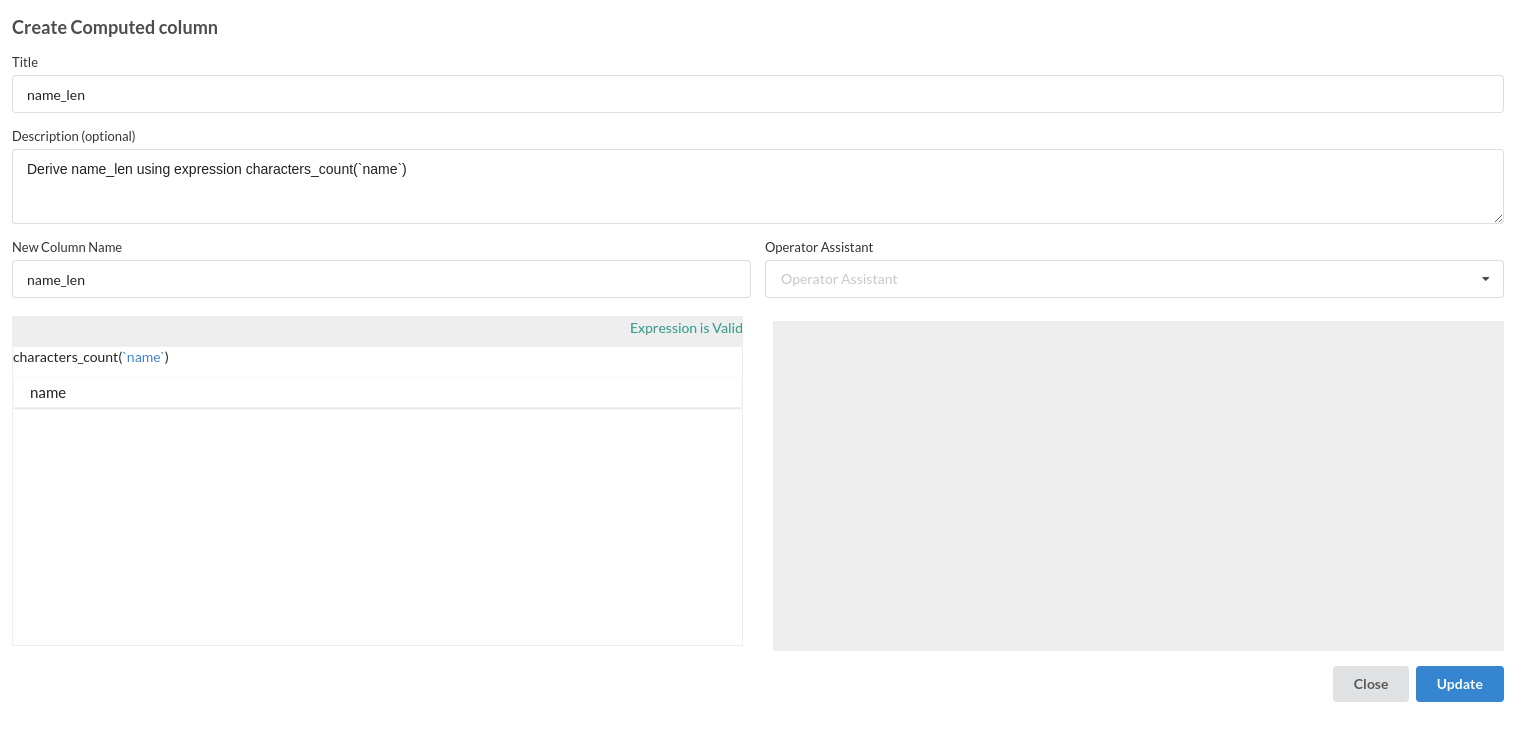
- Compute name length
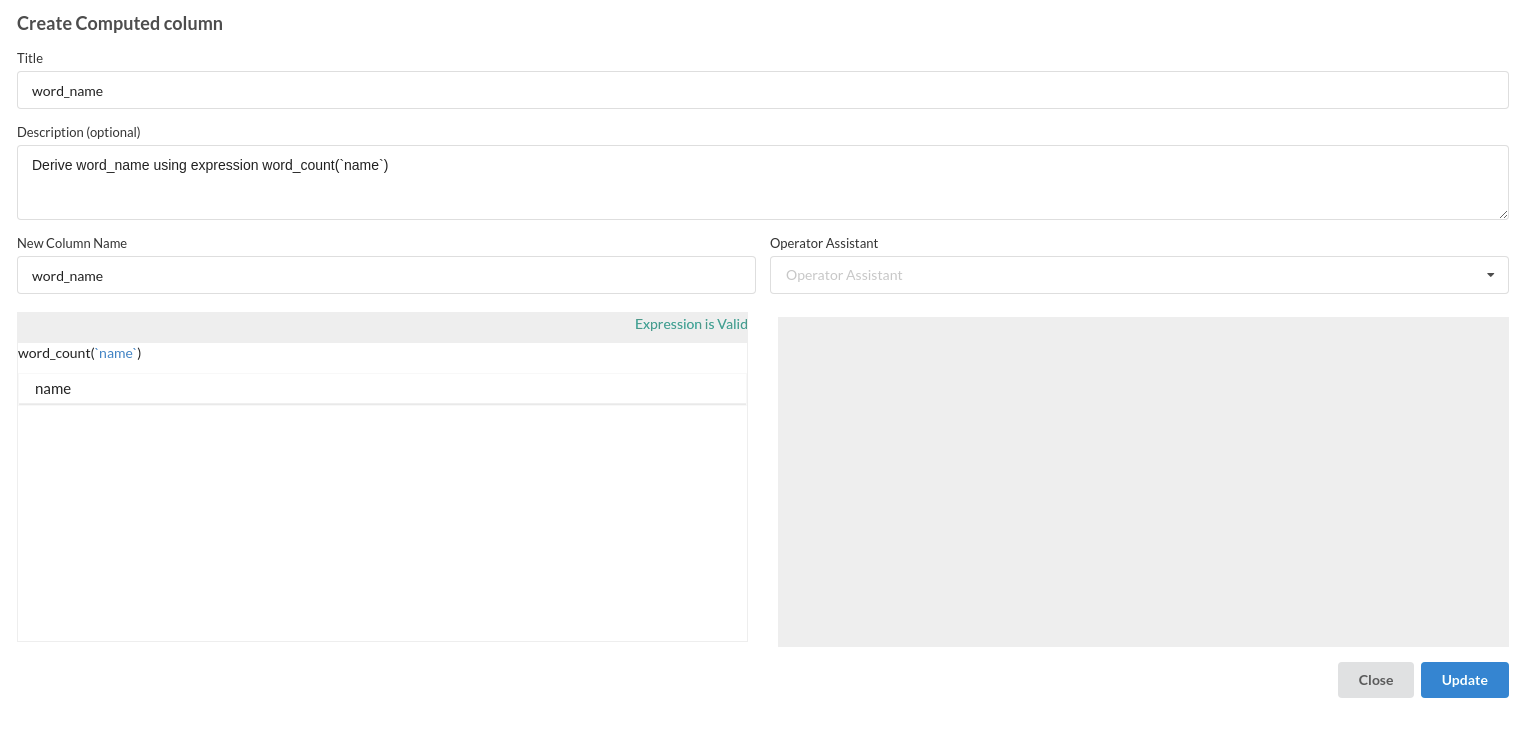
- Compute name word count
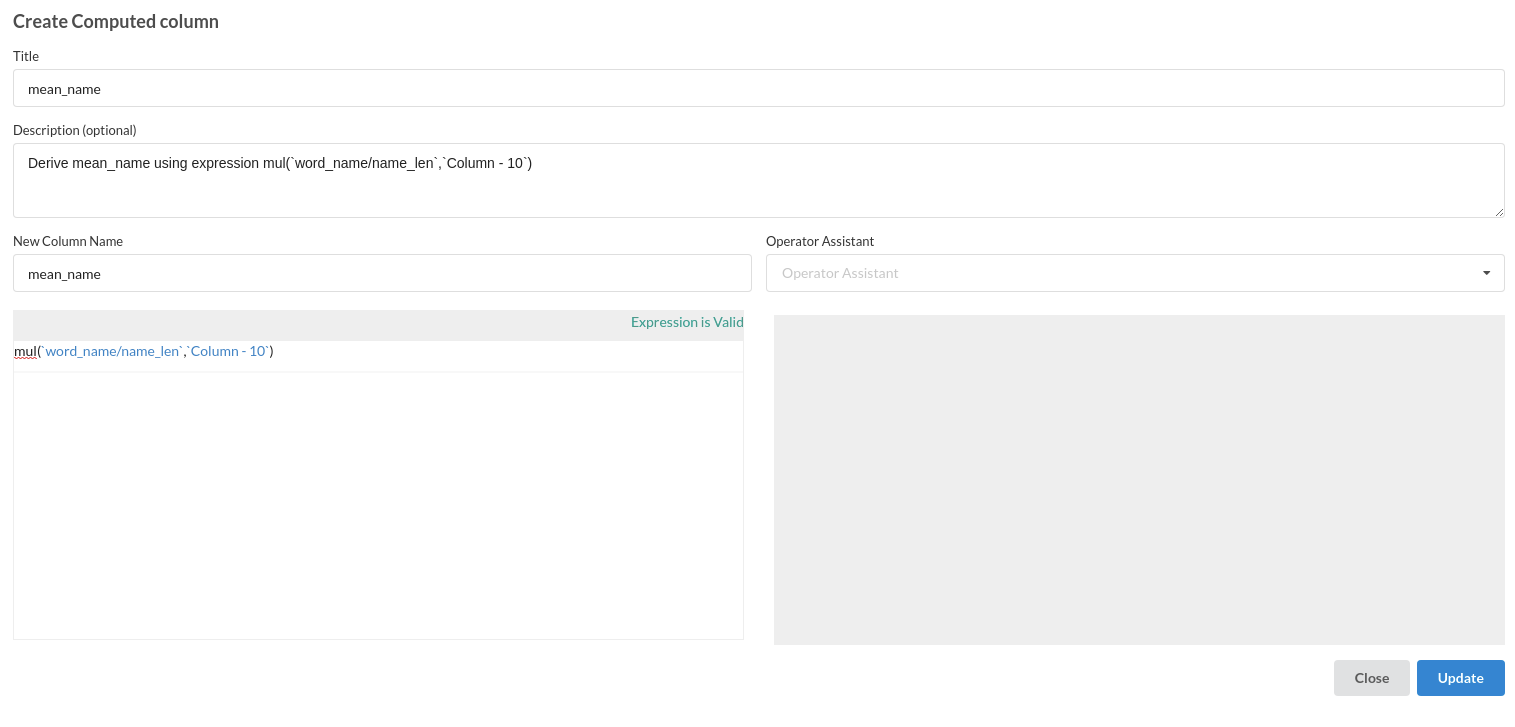
- Compute mean name
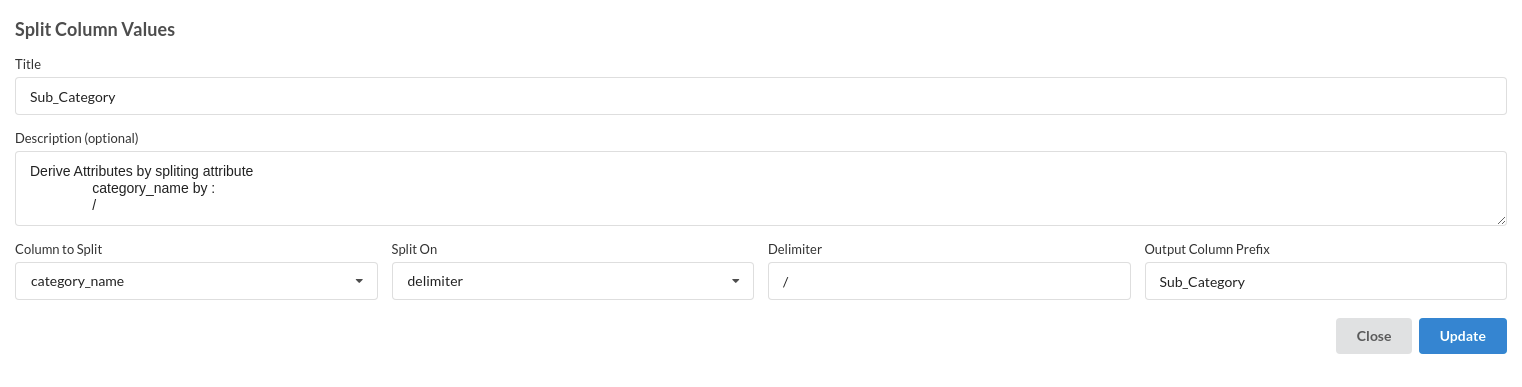
- Add Sub Category
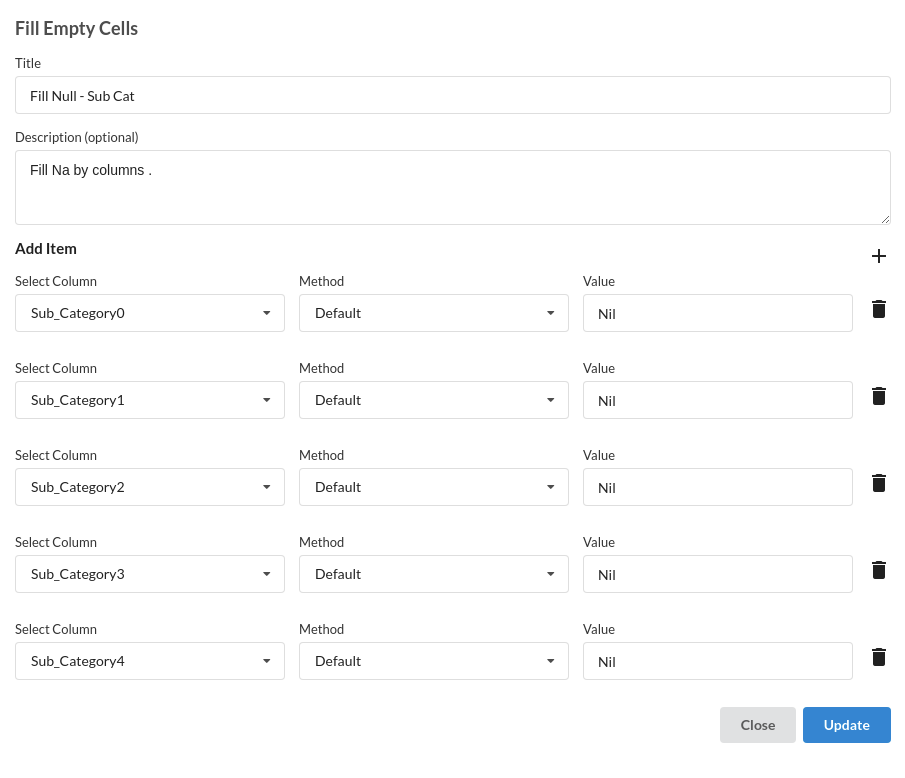
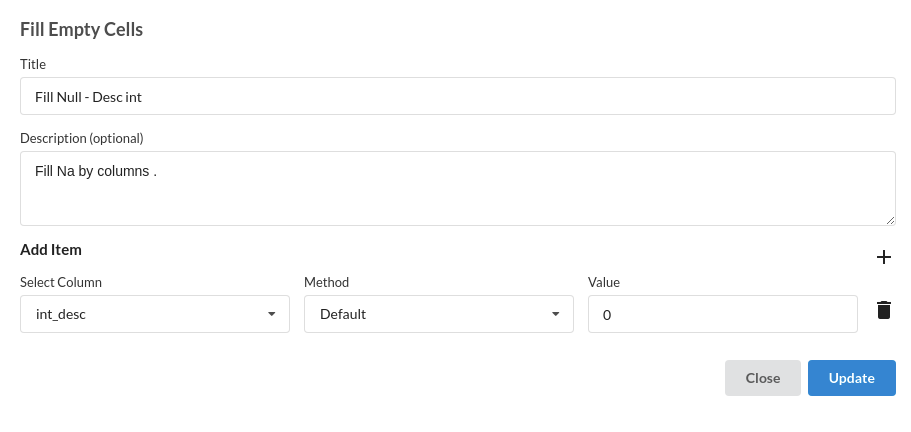
- Fill Null values
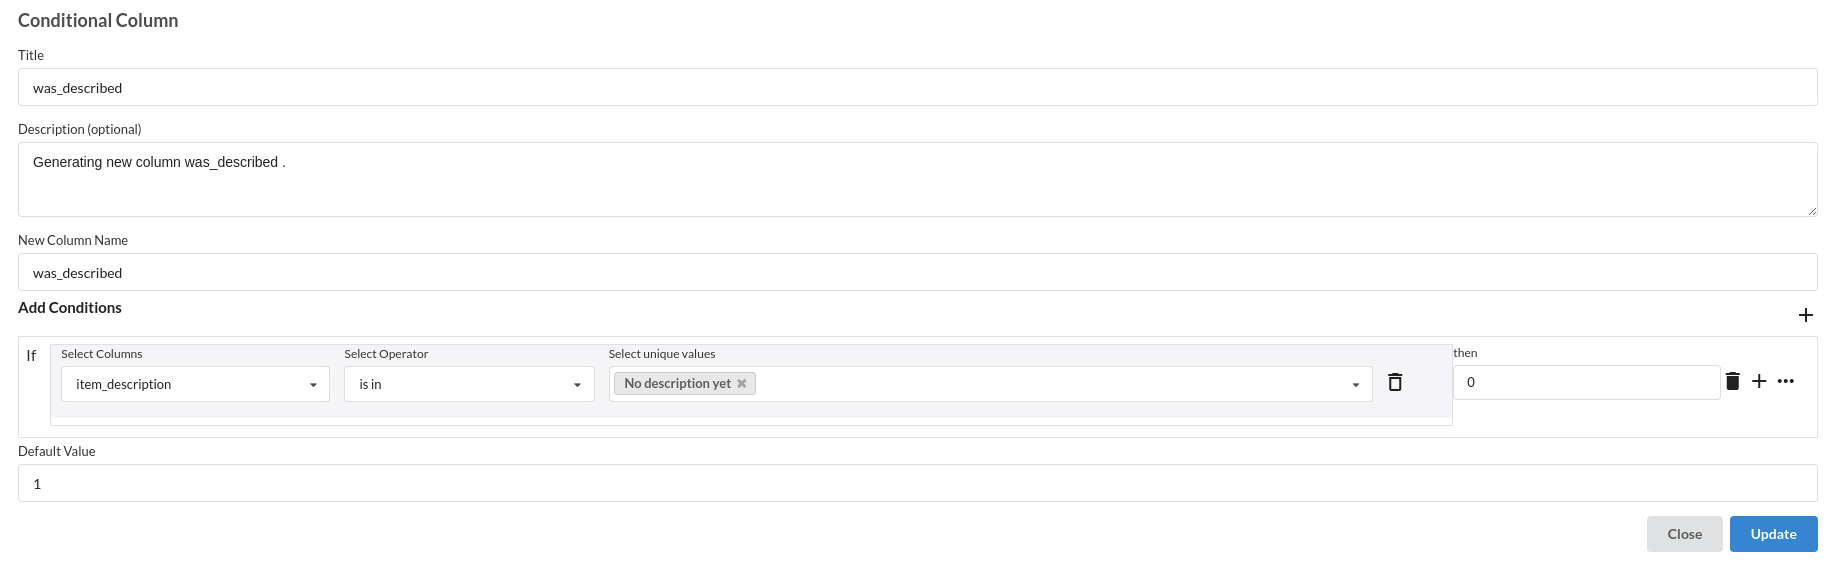
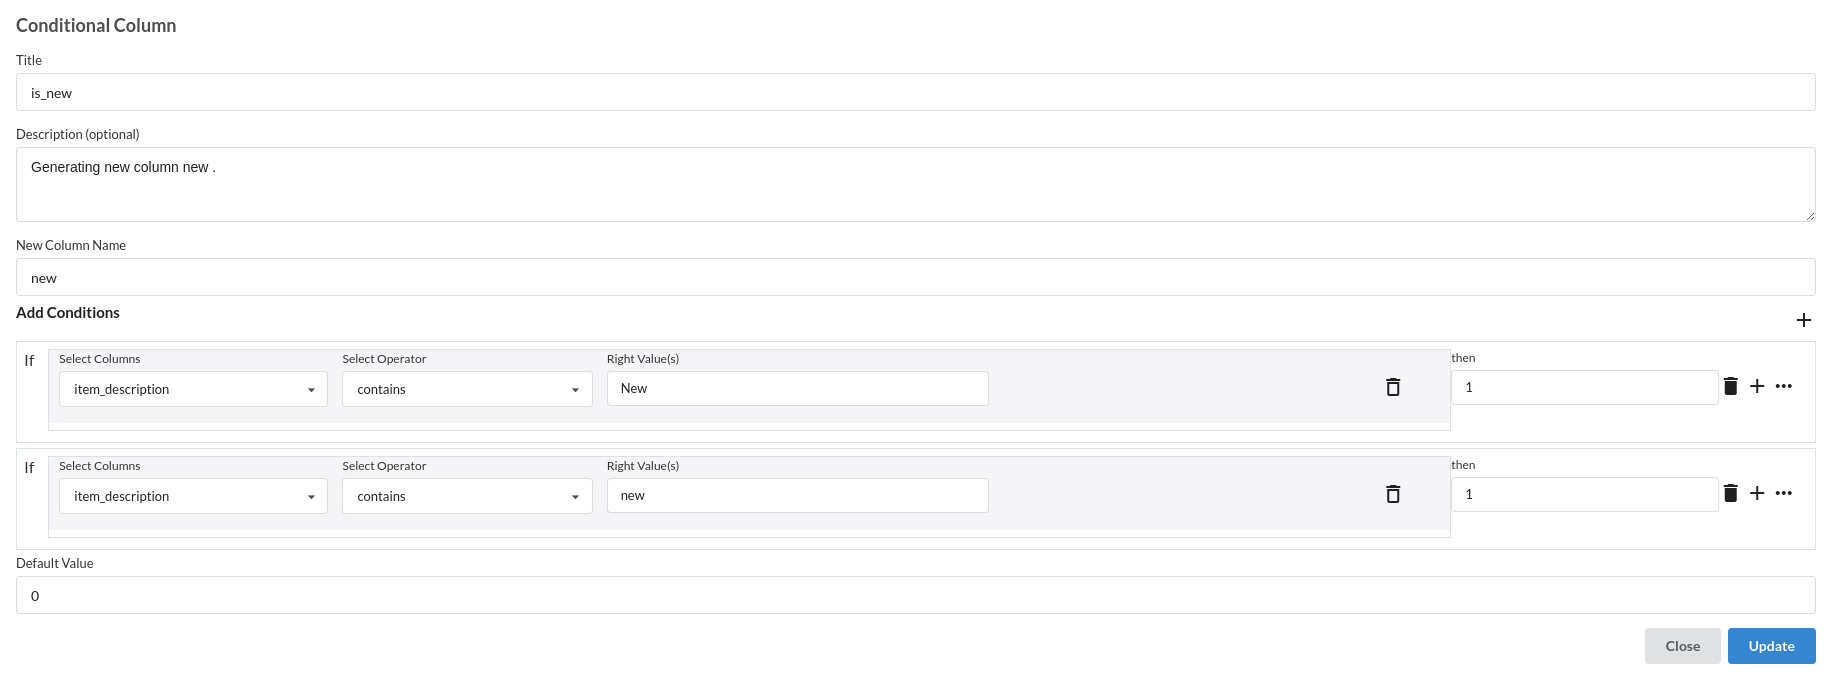
- Add conditional columns
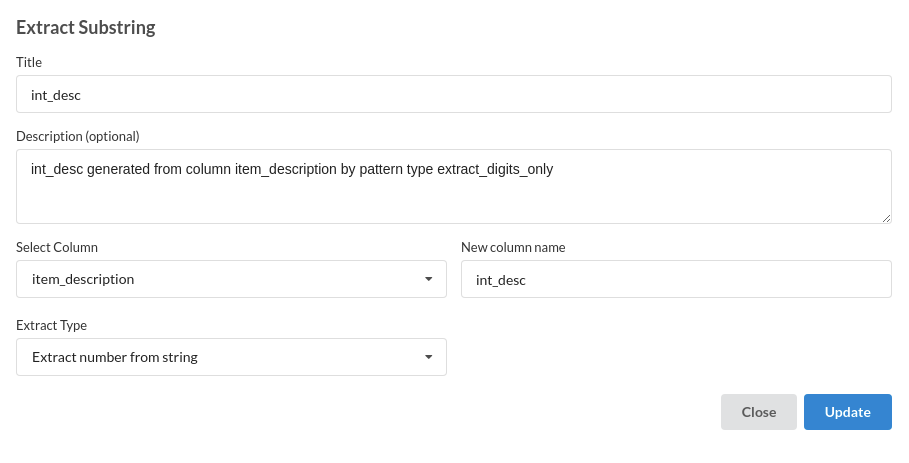
- Add Column by extracting sub strings
- Fill Null values
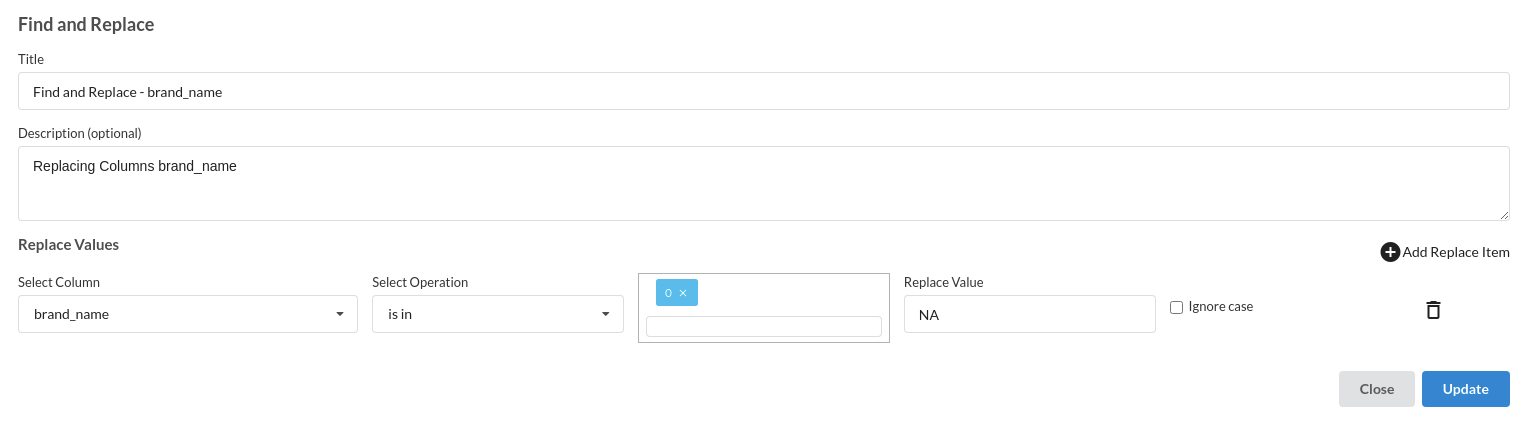
- Find and Replace
Build/Train a regression Model
- You now have a dataset to work with in order to create a regression model. Some of the actions to take before developing a model are listed below.
- Feature Selection
- Feature Encoding
- Choose the algorithm and train the model.
Feature Selection
- Go to the Column Profile View and select Multi-variate profile to construct a correlation matrix to manually identify the features of interest. The peason correlation is shown by Xceed Analytics. Select all of the columns that are strongly correlating to the target feature.
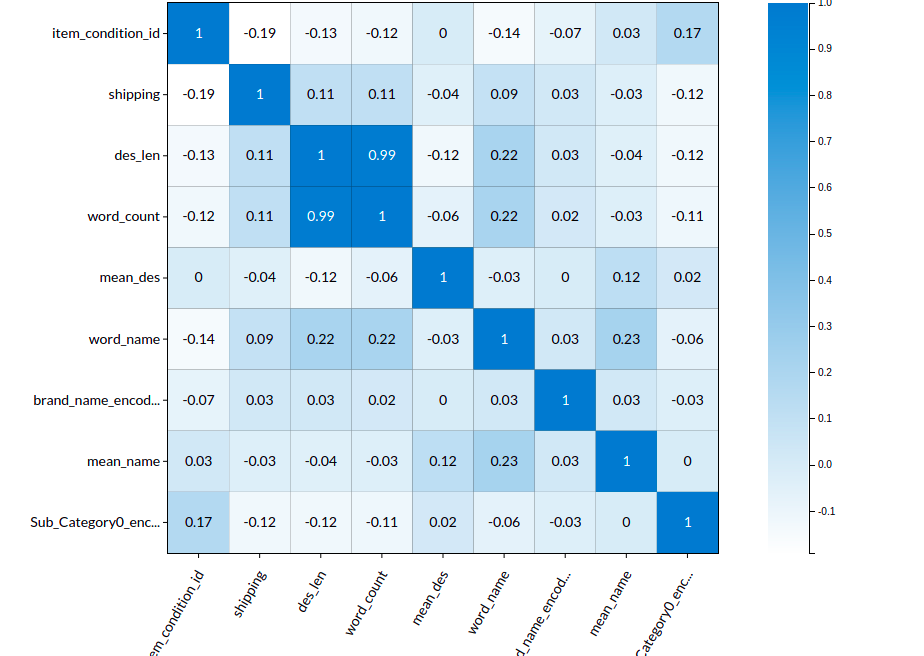
- Some of the features we chose that can explain our target variable based on the observed correlation are:
- word_count
- des_len
- item_condition_id etc.
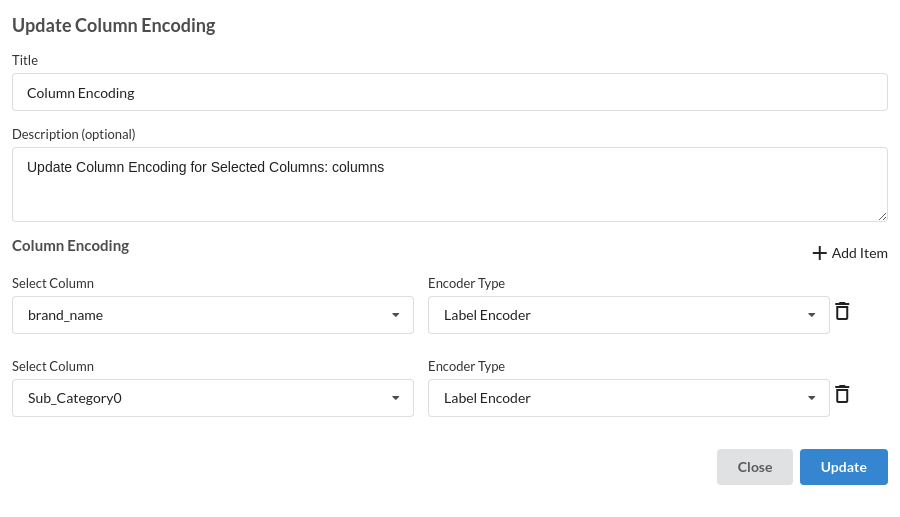
Feature Encoding
Choose the algorithm and train the model.
- Because you will be estimating a continuous variable- price for the prediction model. From the Transformer View, select Regression(auto pilot) and put in the relevant information. Refer to Regression for more information on model parameters (autopilot)
Review the model output and Evaluate the model
After you finish building the model, it is time to review the model output. Look at the output window to first review your predicted results .Since this is a regression problem you will get a new column in the view like the one below.
When you finish building your model you will see another tab in the view called Ml explainer . Click on that to evaluate your model.
- The first view you see when you click on ML explainer is the Summary view
Look at the metrics score and the Run summary stats. Based on your calculations decide if the R2, mean Sqaured Error and Mean Absolute Error are according to your expecation. if not this will be your first step to rethink the training process.
- The second view under Ml explainer is configuration view
The configuration view will give you the information about the step you filled in the Regression step . The view would look like the one below.
-
The third view under Ml explainer is Performance View . You can see the actual vs predicted and the residual curve charts for regression. Look at the built charts and decide if the charts are good enough for your model. The actual vs predicted chart is a good indicator to understand how well your model was trained .
-
The fourth view under Ml explainer is Leaderboard . In this view you can see the number of algorithms trained and all the feature engineering done on the algorithms used with ranking system to rank the best algorithm trained.
-
The last view you see under ML explainer is Interpretability . In this view you will be able to interpret your model in simple terms where you will be getting results pertaining to feature importance , PDP Plots , Sub Population Analysis , Independant Explanation , Interactive Scoring . for more infomation on these results , refer to Interpretability . The Interpretability tab and the results under this tab would look like the one below.