Market Basket Analysis

Background
Retailers utilize market basket analysis, a data mining approach, to boost sales by better understanding customers buying habits. Large data sets, such purchase histories, must be analyzed to identify product groups and items that are most likely to be bought together.Association rules are used in market basket analysis to forecast the possibility that two products will be bought together. By counting how often certain things occur together, association rules look for associations that happen far more frequently than they should.The market basket analysis used on the e-commerce websites is a well-known one. Under the headers "Frequently bought together" and "Customers who bought this item also bought," they show users related products on product pages.Market basket analysis helps improve consumer happiness and sales. Retailers can adjust product positioning, provide special discounts, and develop new product bundles to promote future sales of certain combinations after using data to identify products that are frequently bought together.These upgrades can increase revenue for the retailer while also enhancing and adding value to the customer's shopping experience. Customers may have a higher attitude or sense of brand loyalty towards the business if market basket analysis is used.One of the best uses of machine learning in the retail sector is "Market Basket Analysis." We can determine which products people commonly buy together by looking at their previous purchasing patterns.
Objective
With the aid of this use case, it is possible to forecast which items from earlier orders will be included in a user's upcoming order. Each user has ordered a variety of things in the past. Additionally, we are aware of the order id of each user's upcoming order. The objective is to forecast which of these goods will be included in a user's future order.
Relevance of Xceed
Xceed Analytics provides a single integrated data and AI platform that reduces friction in bring data and building machine models rapidly. It further empowers everyone including Citizen Data Engineers/Scientist to bring data together and build and delivery data and ml usecases rapidly. It's Low code/No code visual designer and model builder can be leveraged to bridge the gap and expand the availability of key data science and engineering skills.
This usecase showcases how to create, train/test and deploy a market basket analysis classification model. The datasets were collected from Kaggle.These include products dataset, orders dataset, prior orders dataset. Xceed will provide a NO-CODE environment for the end-to-end implementation of this project, starting with the uploading of datasets from numerous sources to the deployment of the model at the end point. All of these steps are built using Visual Workflow Designer, from analyzing the data to constructing a model and deploying it.
Data Requirements
We will be using the following datasets for this usecase:
- orders: This dataset includes all orders, namely prior, train, and test.It has single primary key (order_id).
- order_products_train: This dataset includes training orders. It has a composite primary key (order_id and product_id) and indicates whether a product in an order is a reorder or not (through the reordered variable).
- order_products_prior : This dataset includes prior orders. It has a composite primary key (order_id and product_id) and indicates whether a product in an order is a reorder or not (through the reordered variable).
- products: This dataset includes all products. It has a single primary key (product_id)
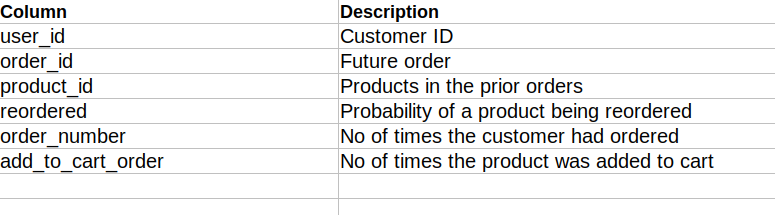
Columns of interest in the dataset :
Model Objectives
Understanding trends in the customer's purchases over time and forecasting which of the products will be in a customer's future order by analysing the underlying data, constructing a classification machine learning model, and implementing it after defining the model's major features to predict whether each pair of customer and product is a reorder or not.
Steps followed to develop and deploy the model
- Upload the data to Xceed Analytics and create a dataset
- Create the Workflow for the experiment
- Perform initial exploration of data columns.
- Perform Cleanup and Tranform operations
- Build/Train a Classification Model
- Review the model output and Evaluate the model
- Improve on the metrics which will be useful for the productionizing
- Deploy/Publish the model
Upload the data to Xceed Analytcs and Create the dataset
- From the Data Connections Page, upload the the dataset to Xceed Analytics. For more information on Data Connections refer to Data Connections
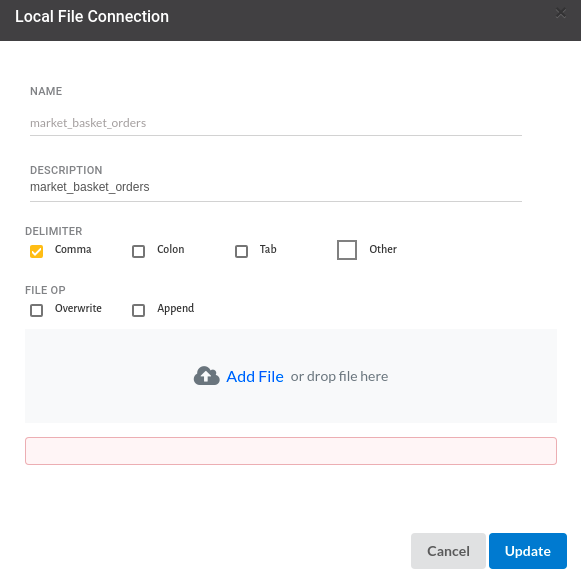
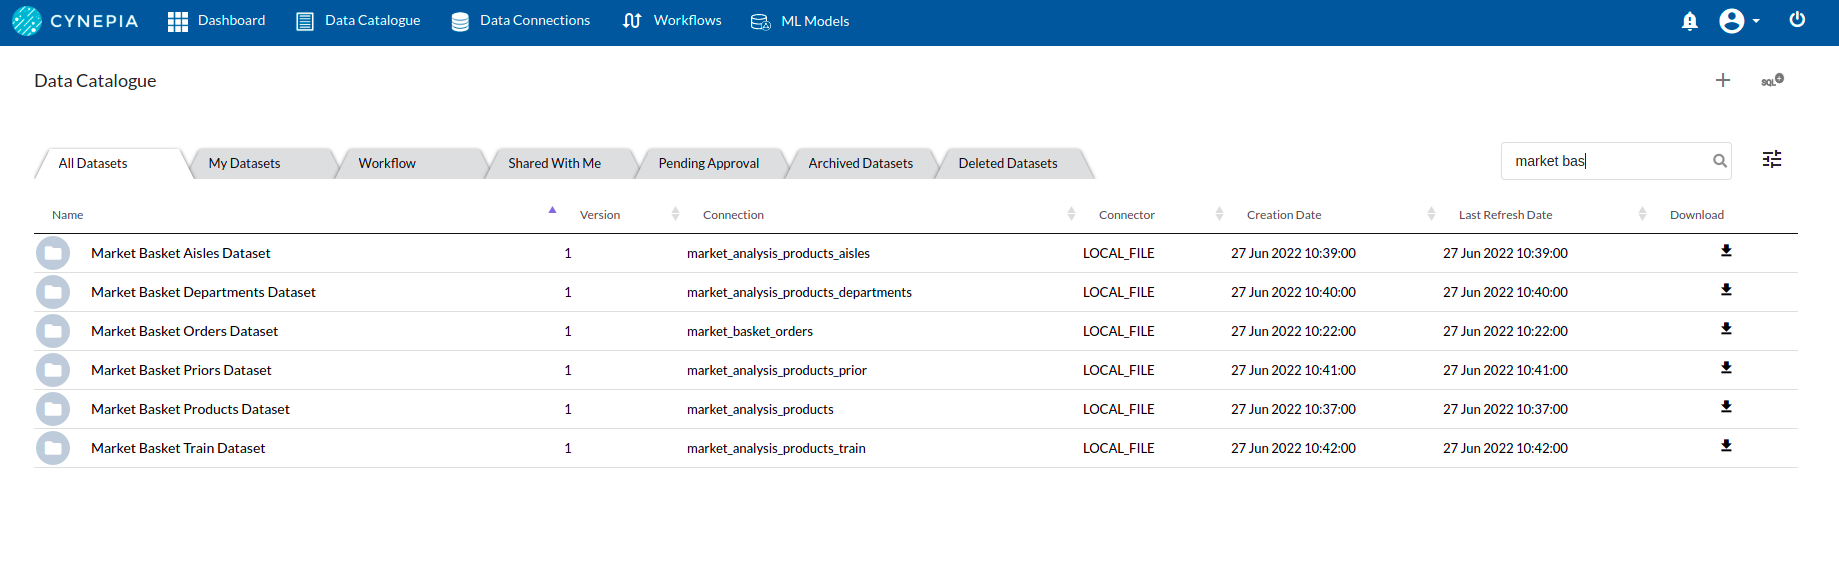
- Create a dataset for each dataset from the uploaded datasource in the data catalogue. Refer to Data Catalogue for more information on how to generate a dataset.
Create the Workflow for the experiment
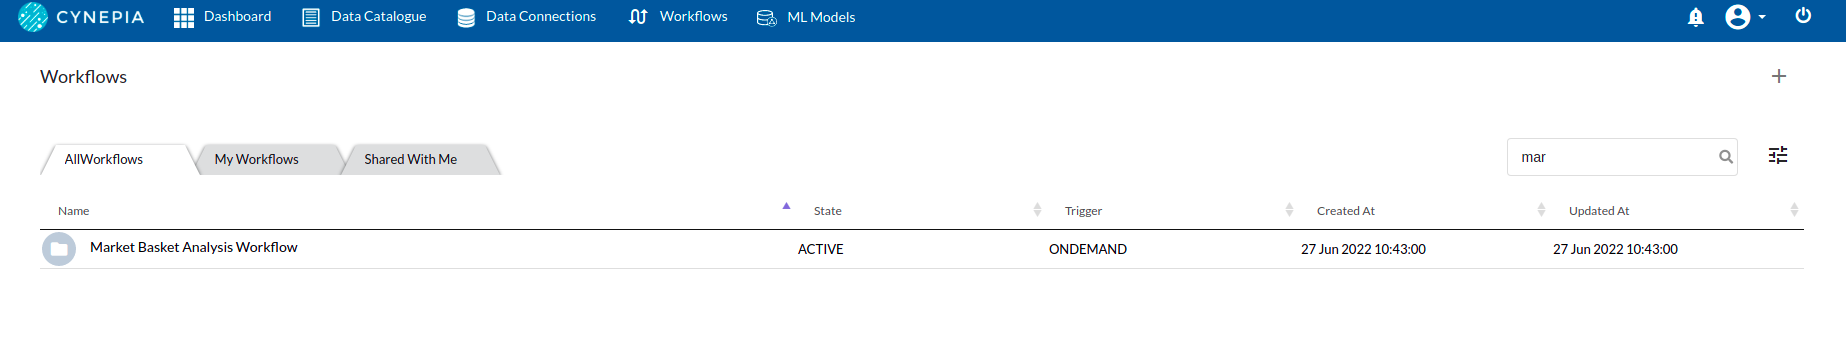
- Create a Workflow by going to the Workflows Tab in the Navigation.Refer Create Workflow for more information.
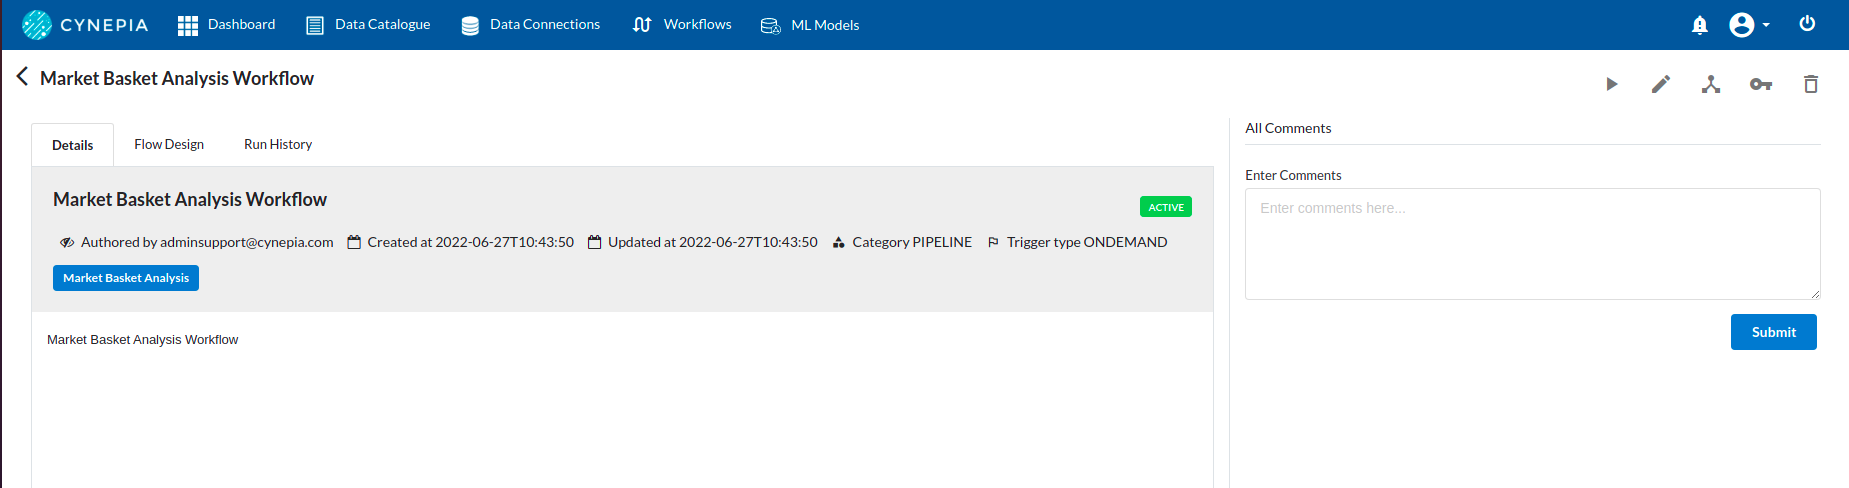
To navigate to the workflow Details Page, double-click on the Workflow List Item and then click Design Workflow. Visit the Workflow Designer Main Page for additional information.
- By clicking on + icon you can add the Input Dataset to the step view. The input step will be added to the Step View.
Perform initial exploration of data columns.
- Examine the output view with Header Profile, paying special attention to the column datatypes. for more information refer to output window
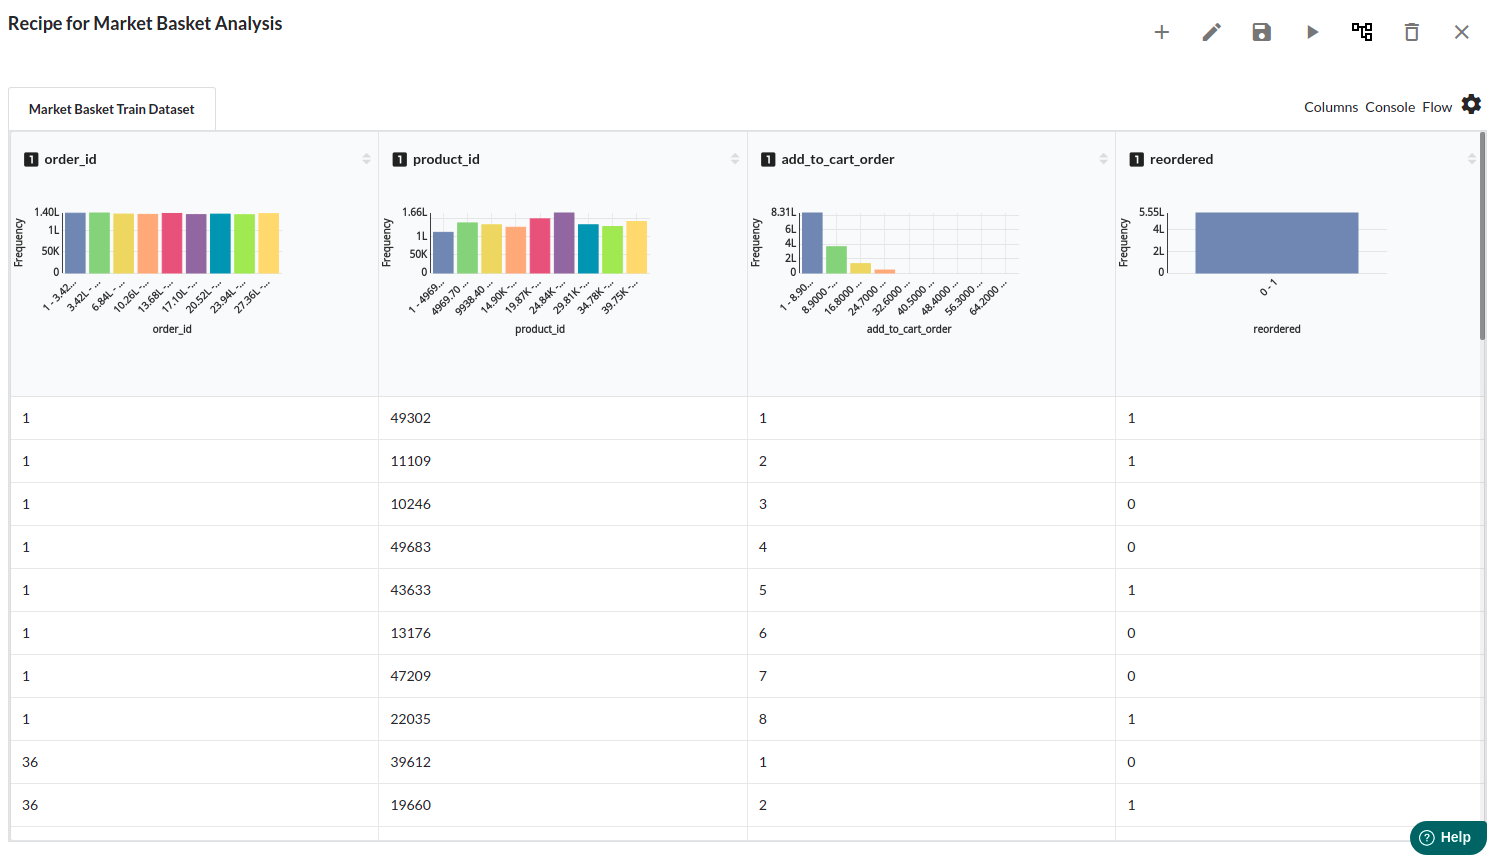
- Column Statistics Tab (Refer to Column Statistics for more details on individual KPI)
Perform Cleanup and Transform Operations
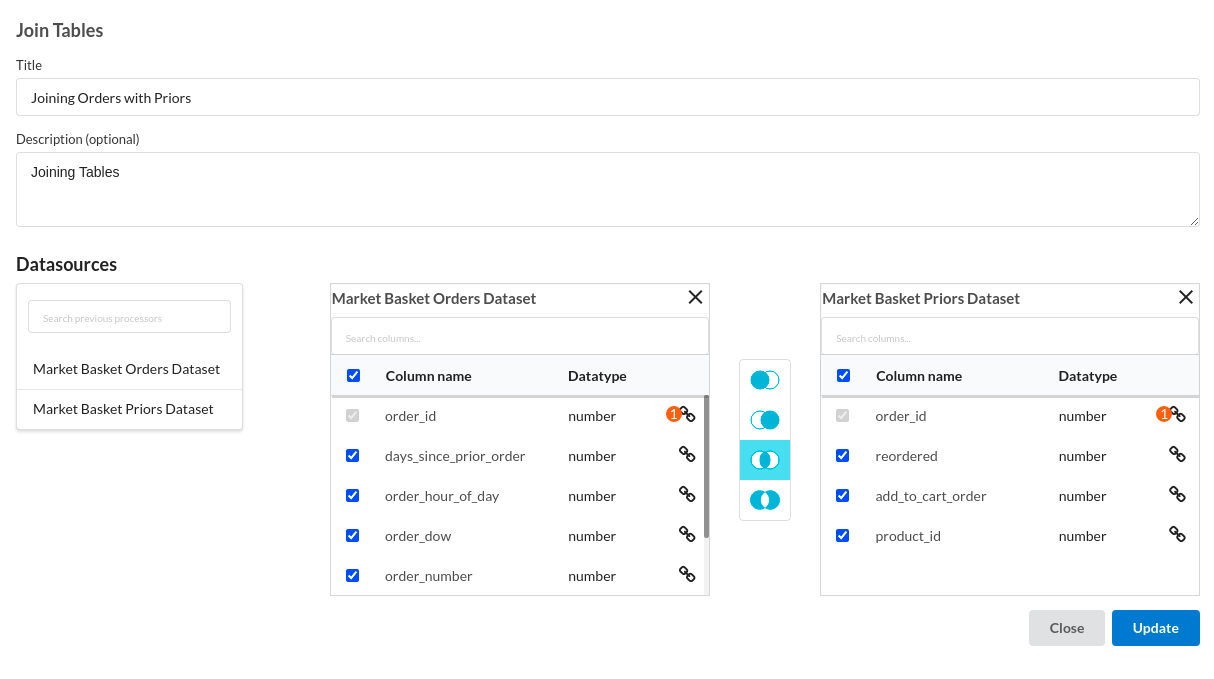
- Join Orders with Priors
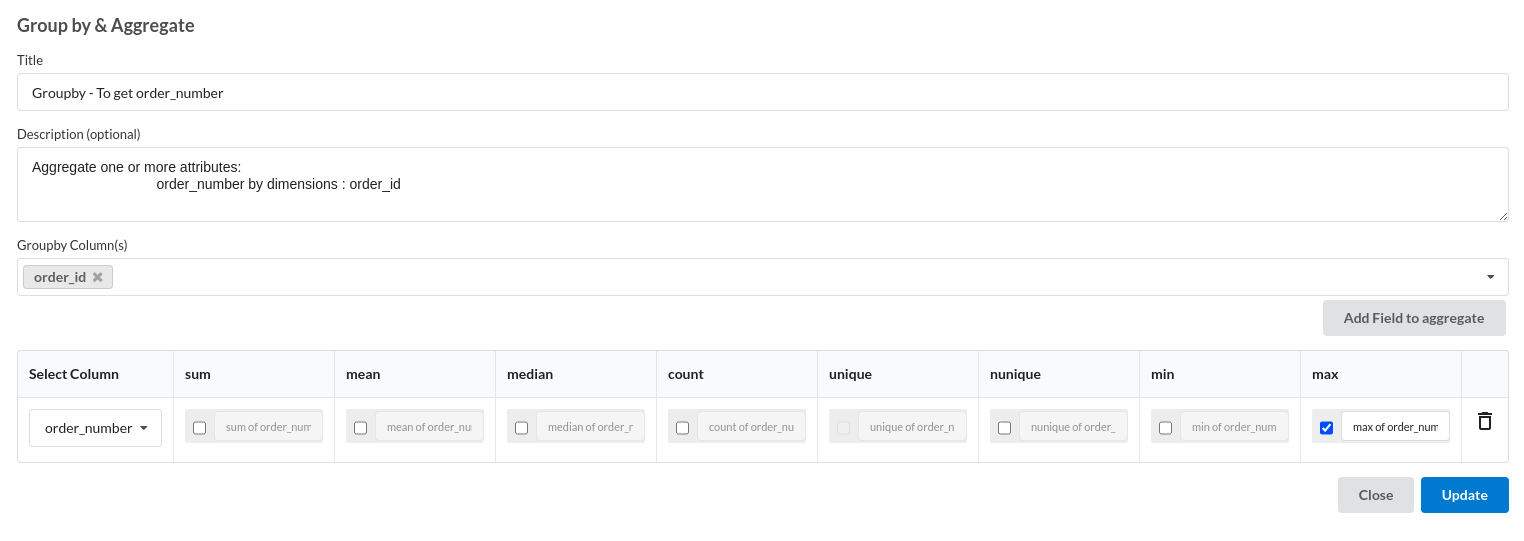
- Groupby to get order number
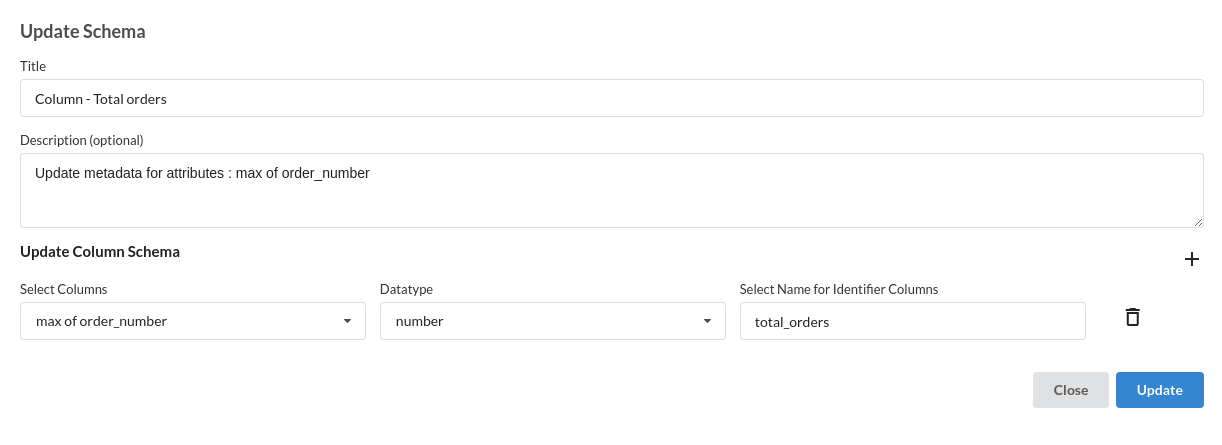
- Add Column Total Orders
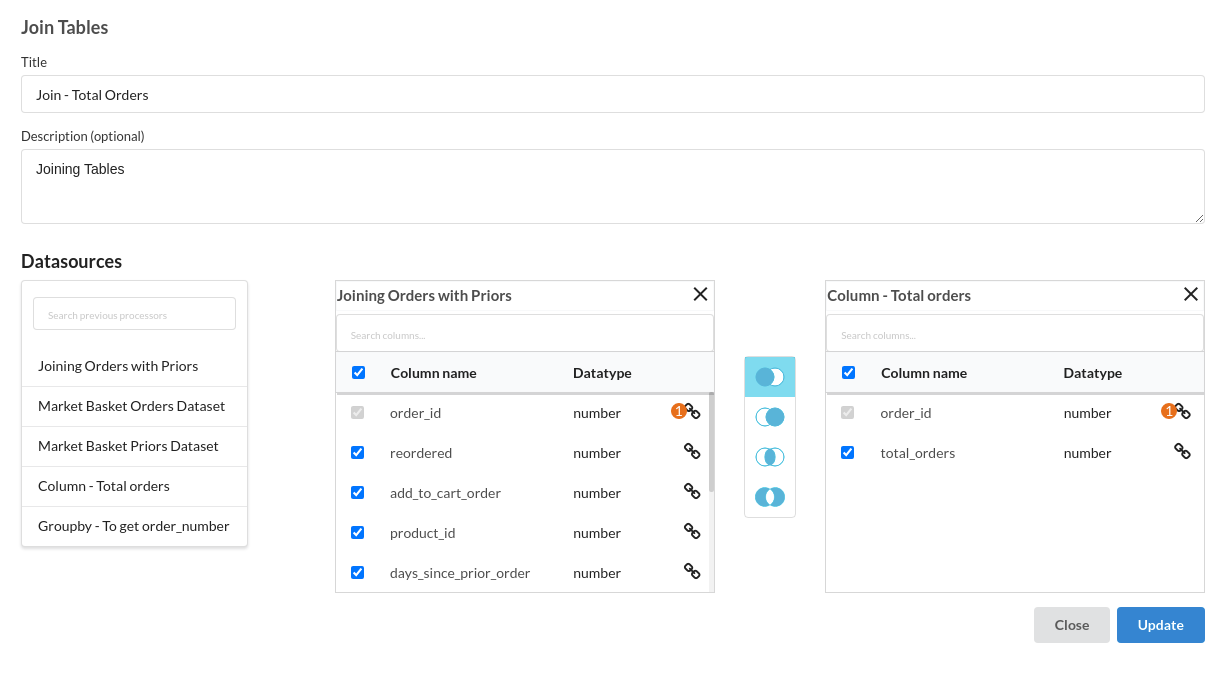
- Join Total orders
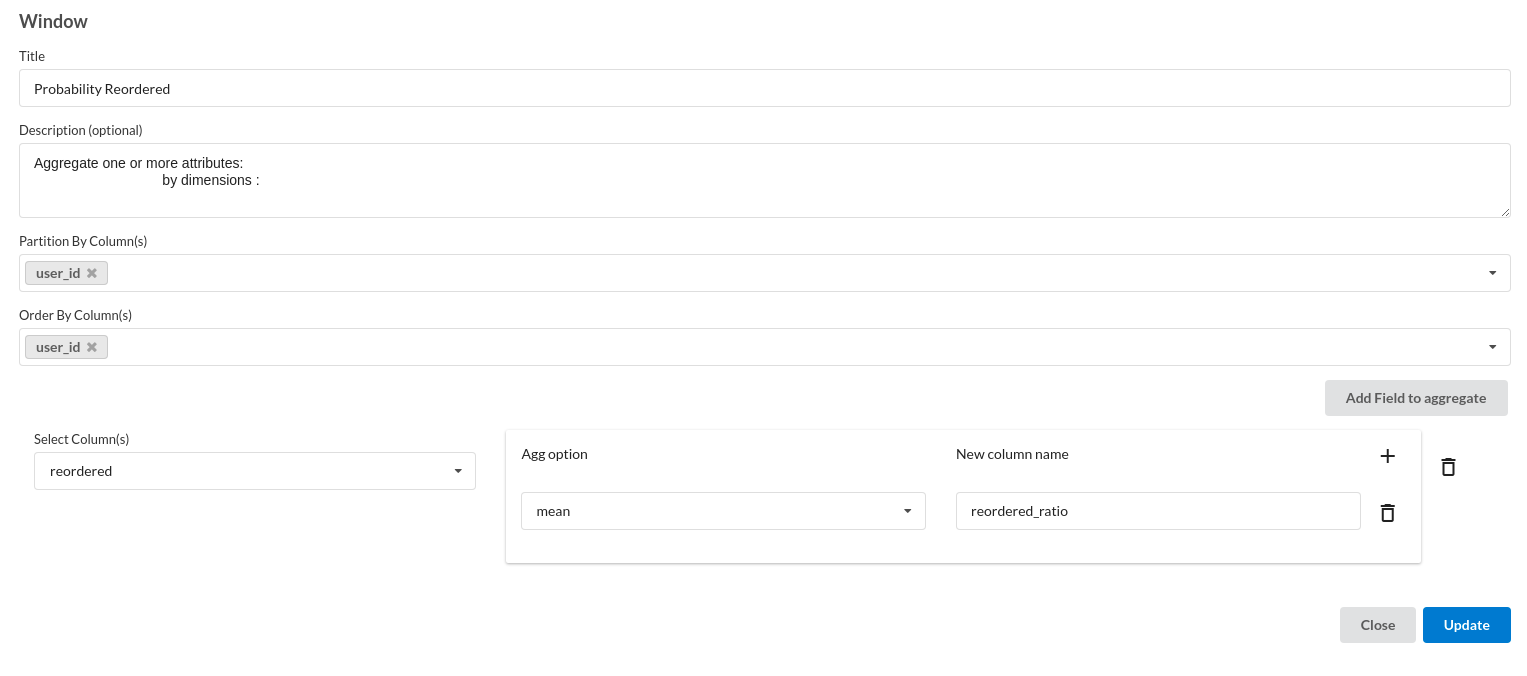
- Probability of Reorder
- Rename Column
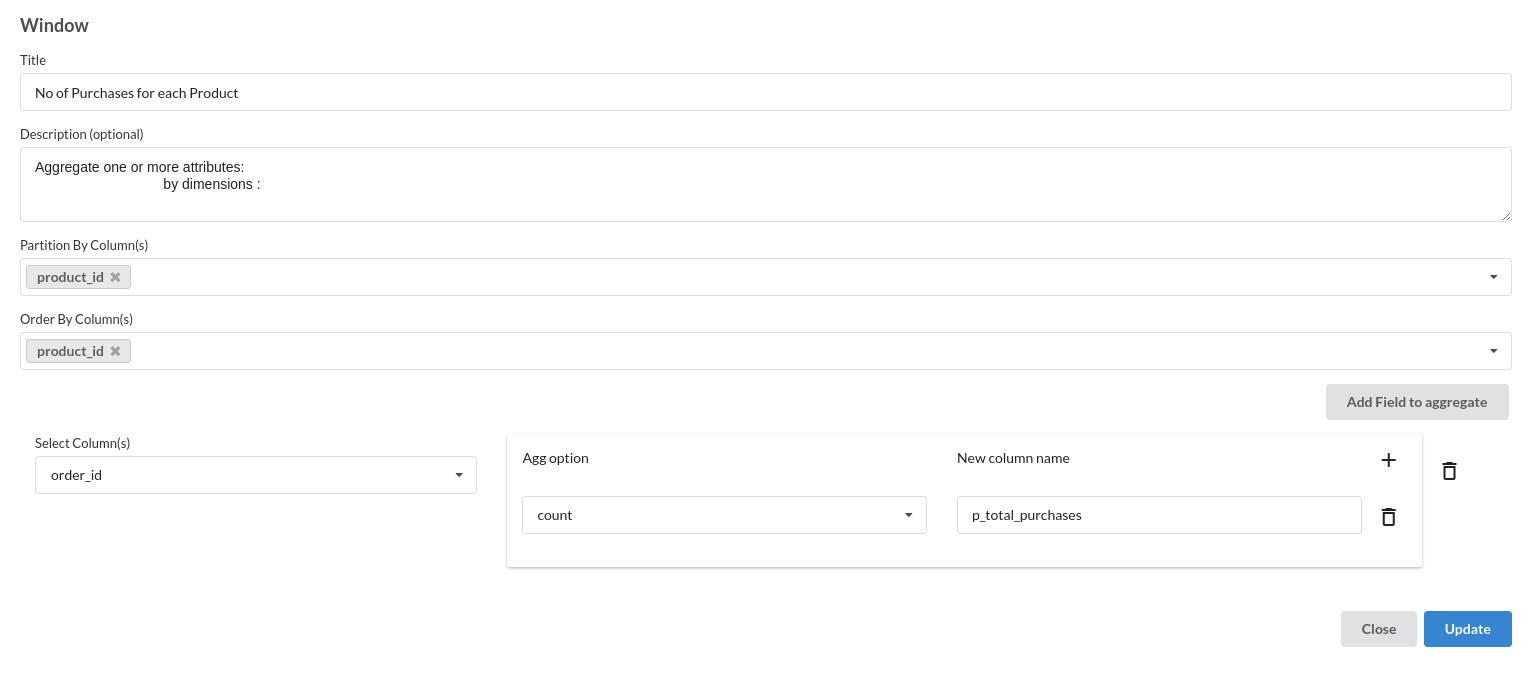
- No of purchases for each product
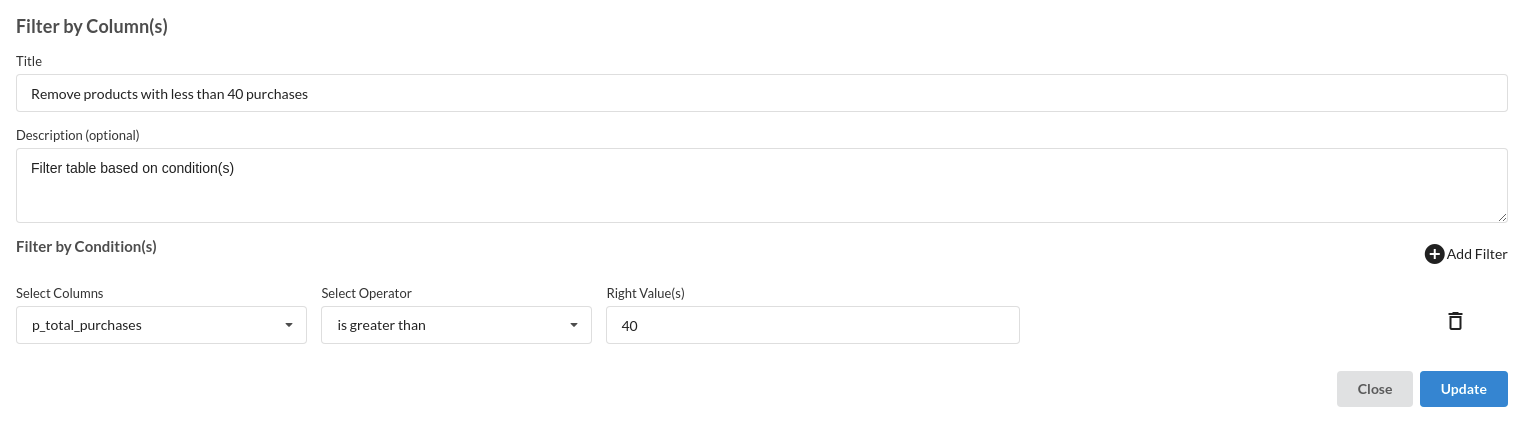
- Remove products with less than 40 purchases
- Reorder probability by products

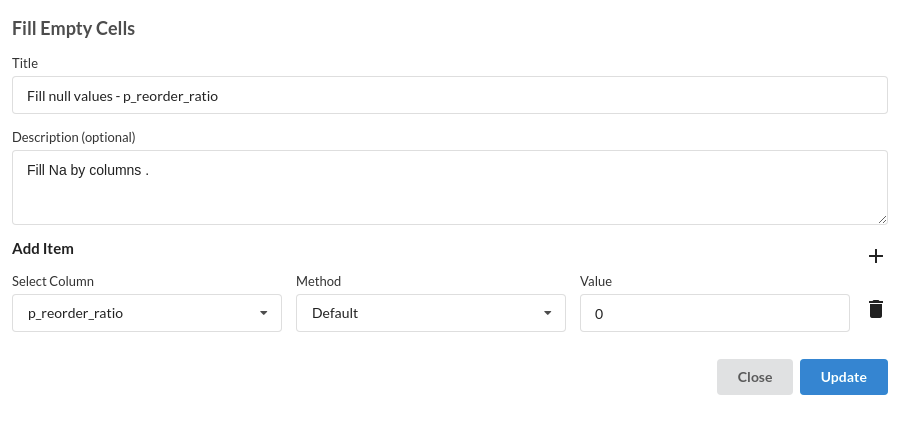
- Fill Null Values
- Calculate Total Bought
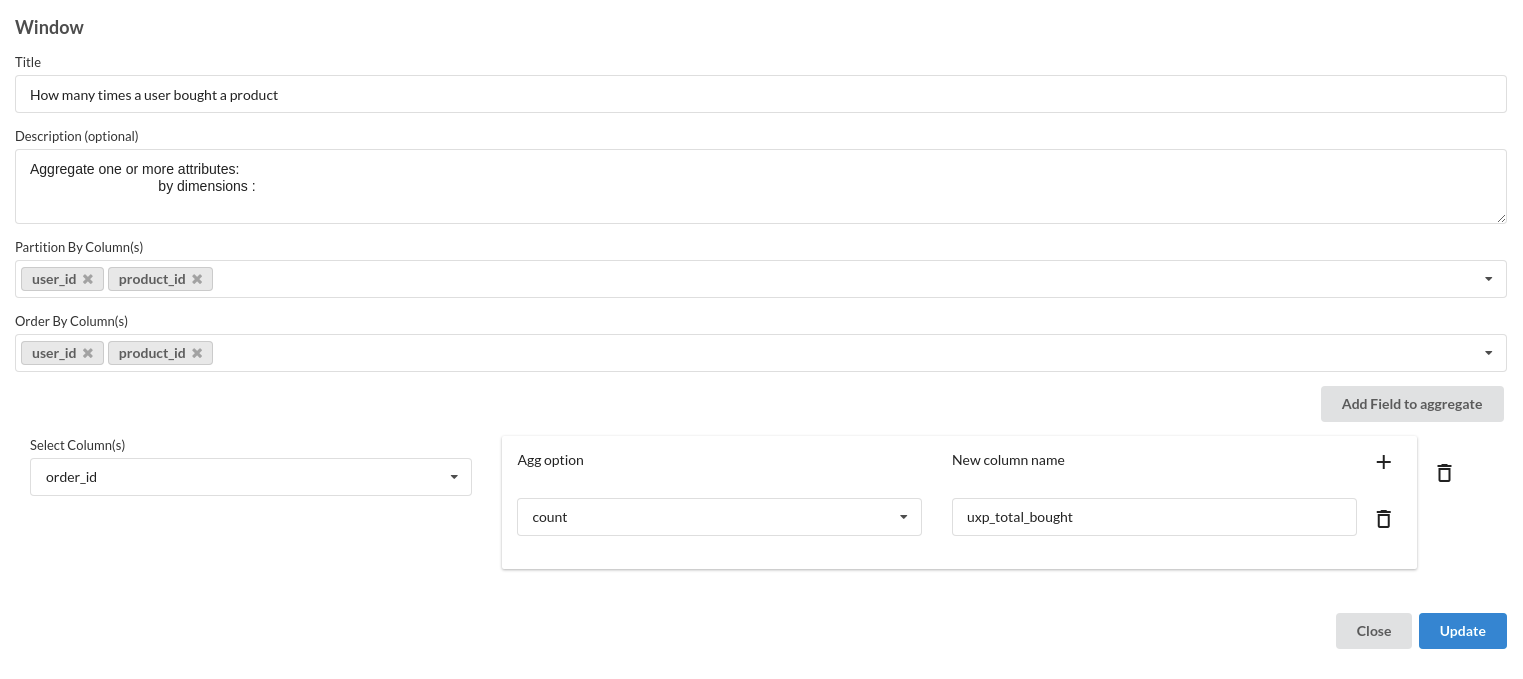
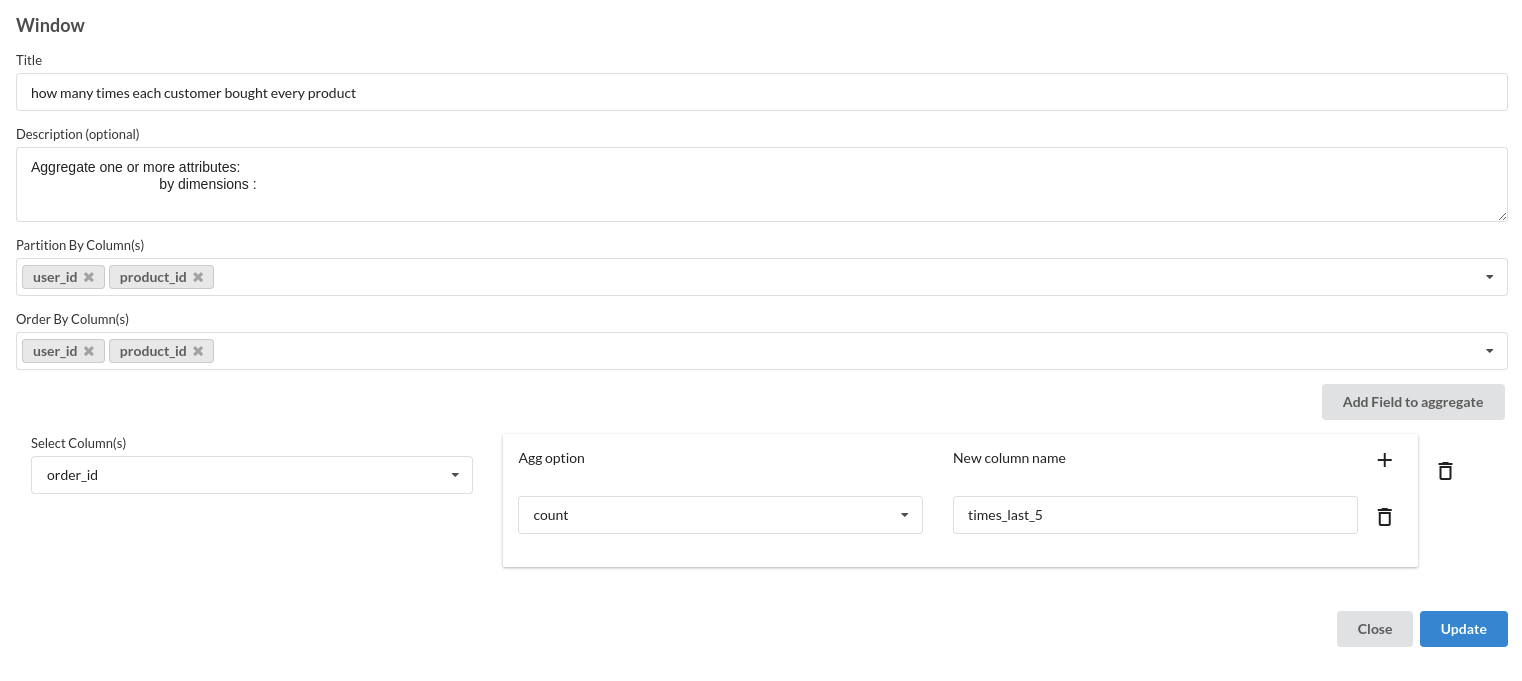
- Calculate Times Bought

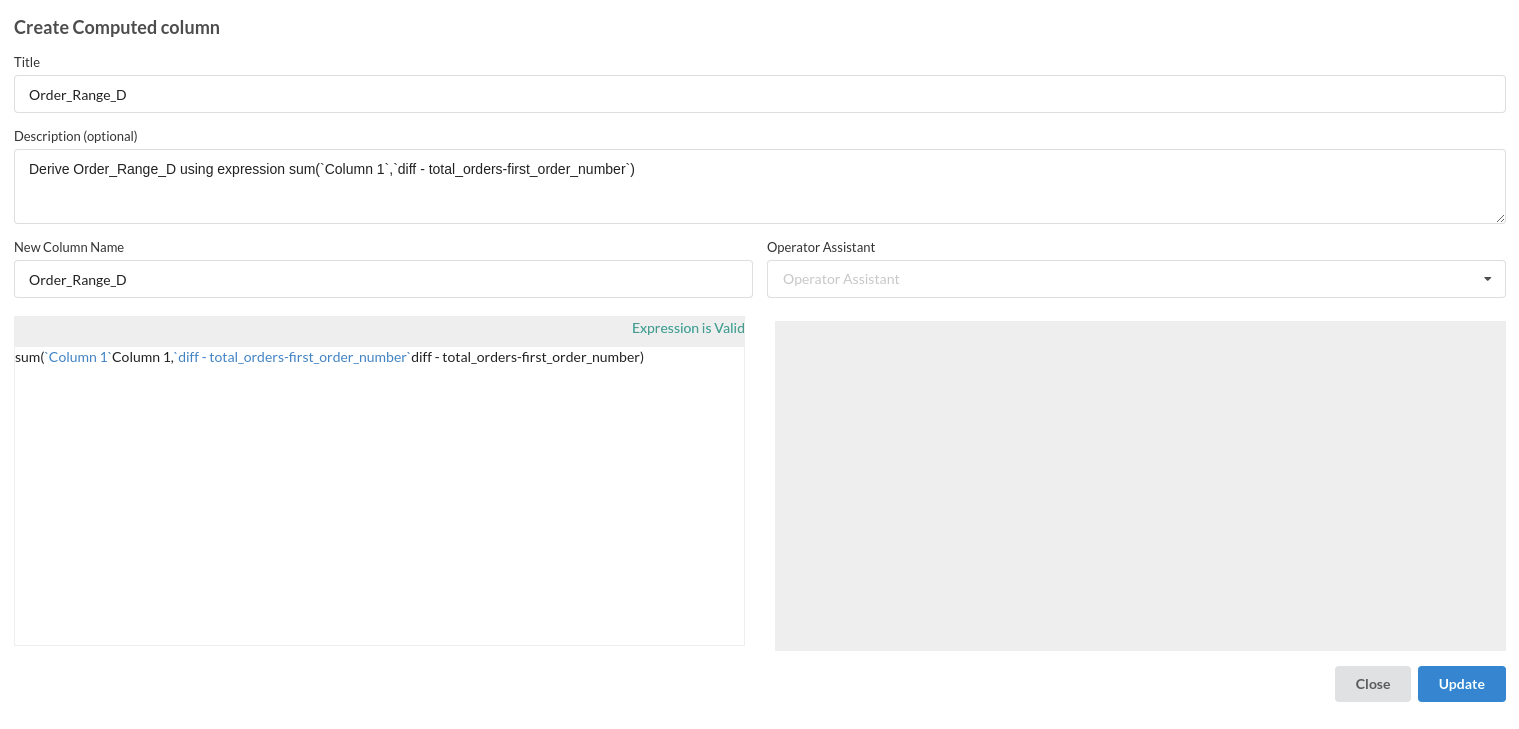
- Calculate Order Range
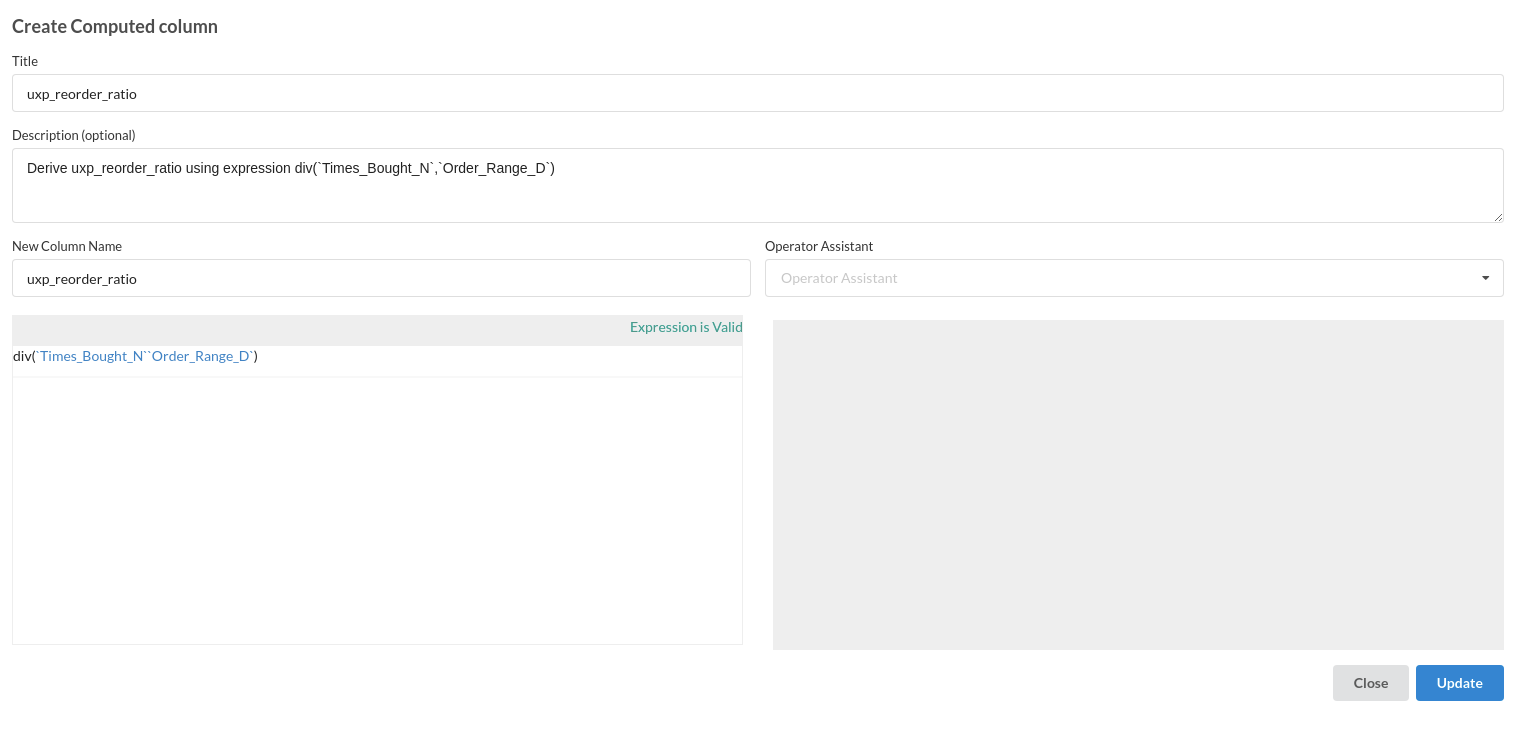
- Calculate reorder ratio
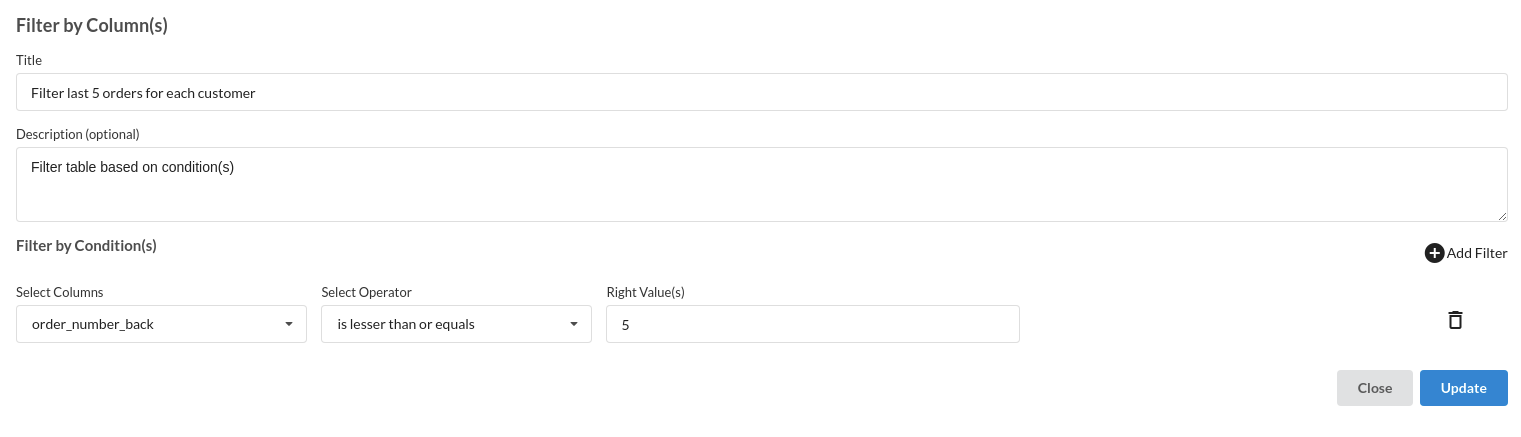
- Filter last 5 orders for each customer
- Times Last 5
Build/Train a classification Model
- You have a dataset to work with in order to create a classification model. Some of the actions to take before developing a model are listed below.
- Feature Selection
- Feature Encoding
- Choose the algorithm and train the model.
Feature Selection
- Go to the Column Profile View and select Multi-variate profile to construct a correlation matrix to manually identify the features of interest. The peason correlation is shown by Xceed Analytics. Select all of the columns that are strongly correlating to the target feature.
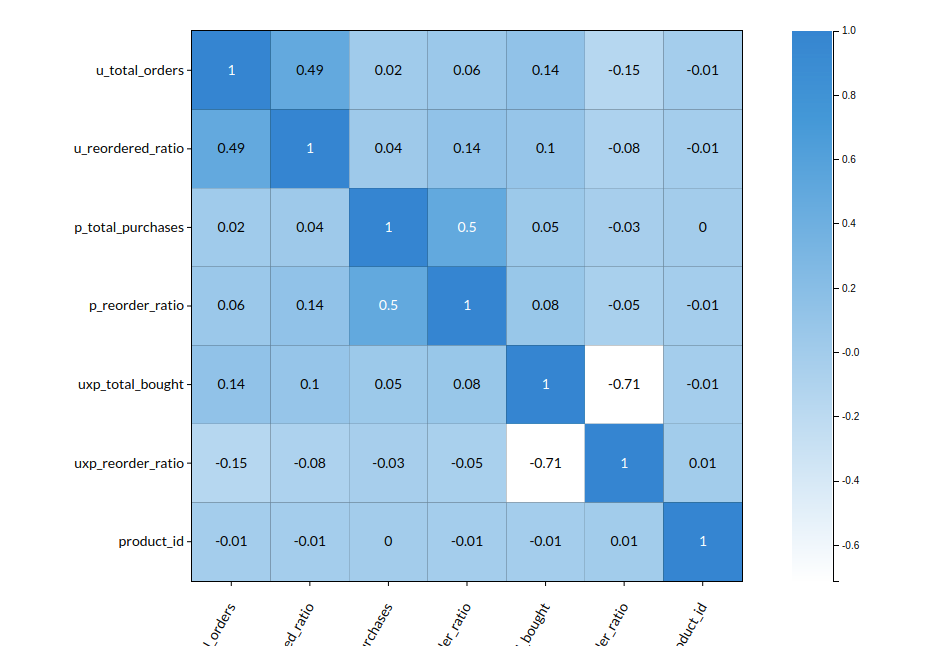
- Some of the features to chose that can explain the target variable based on the observed correlation are:
- u_reordered_ratio
- p_reordered_ratio
- uxp_reordered_ratio
Feature Encoding
- Take all of the categorical columns and encode them based on the frequency with which they occur. for more infomation on this processor, refer to Feature Encoding
Here, there are no categorical columns so there is no need of feature encoding.
Choose the algorithm and train the model.
- You are estimating a categorical variable- reorder� for the prediction model. From the Transformer View, select Classification(auto pilot) andfill in the relevant information.
Review the model output and Evaluate the model
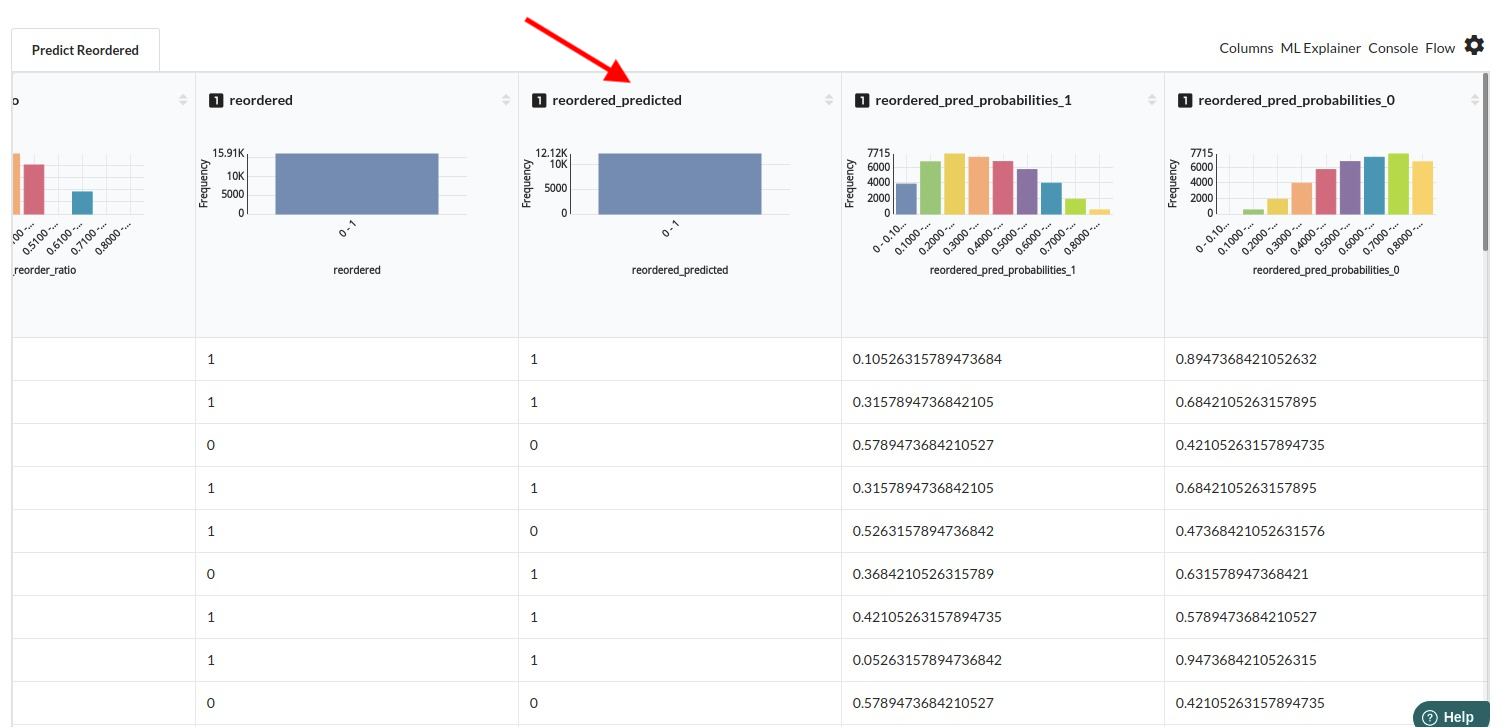
After you finish building the model, it is time to review the model output. Look at the output window to first review your predicted results .You will get a new column in the view like the one below.
When you finish building your model you will see another tab in the view called Ml explainer . Click on that to evaluate your model.
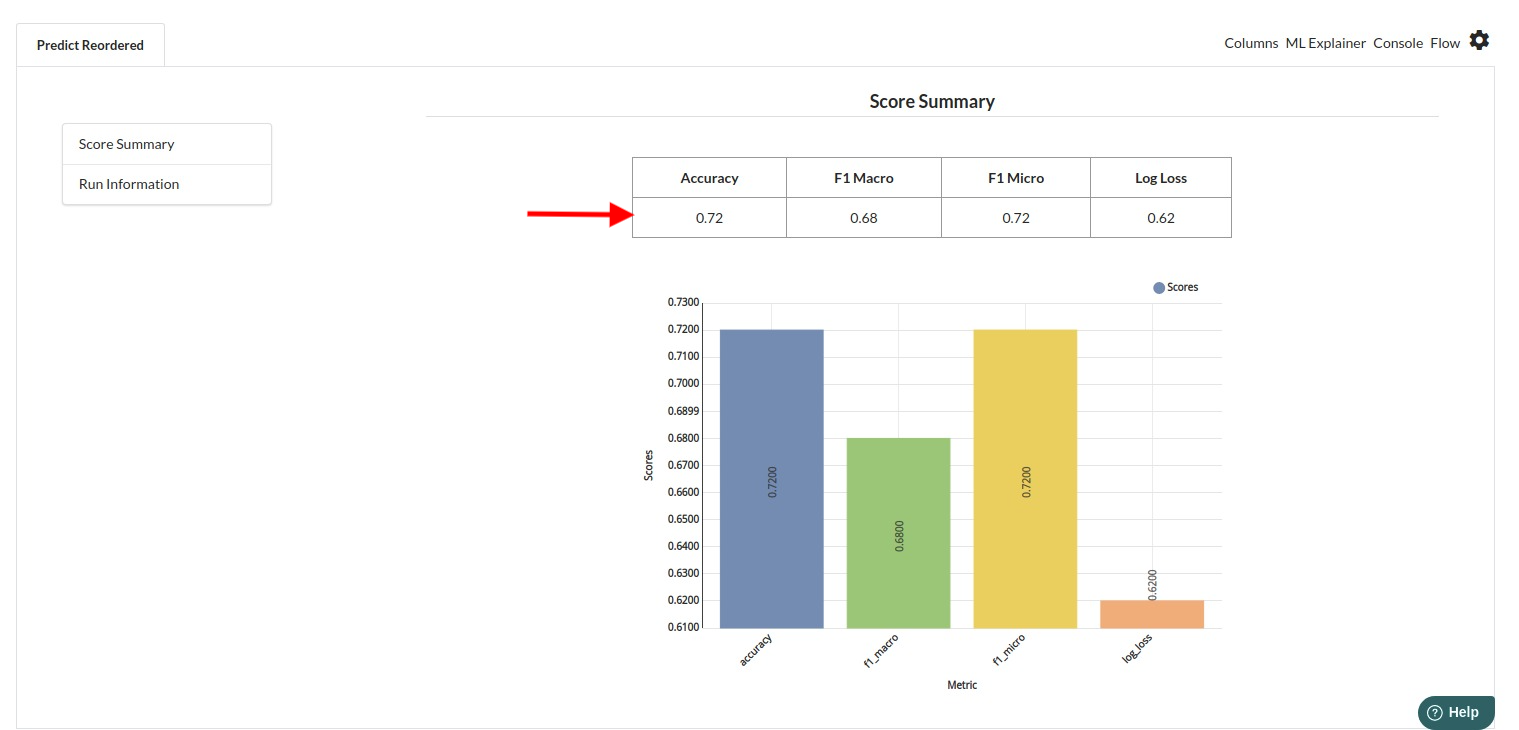
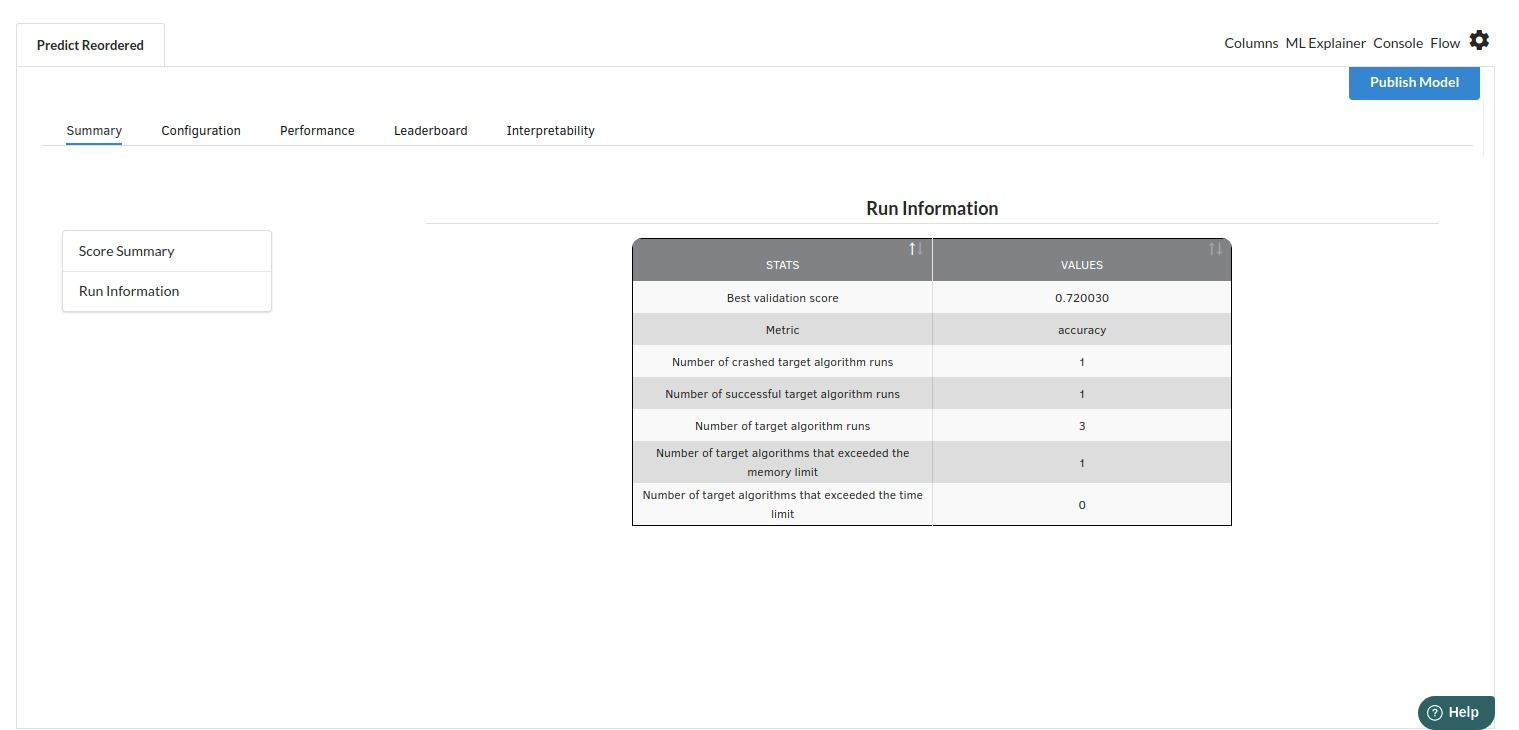
- The first view you see when you click on ML explainer is the Summary view
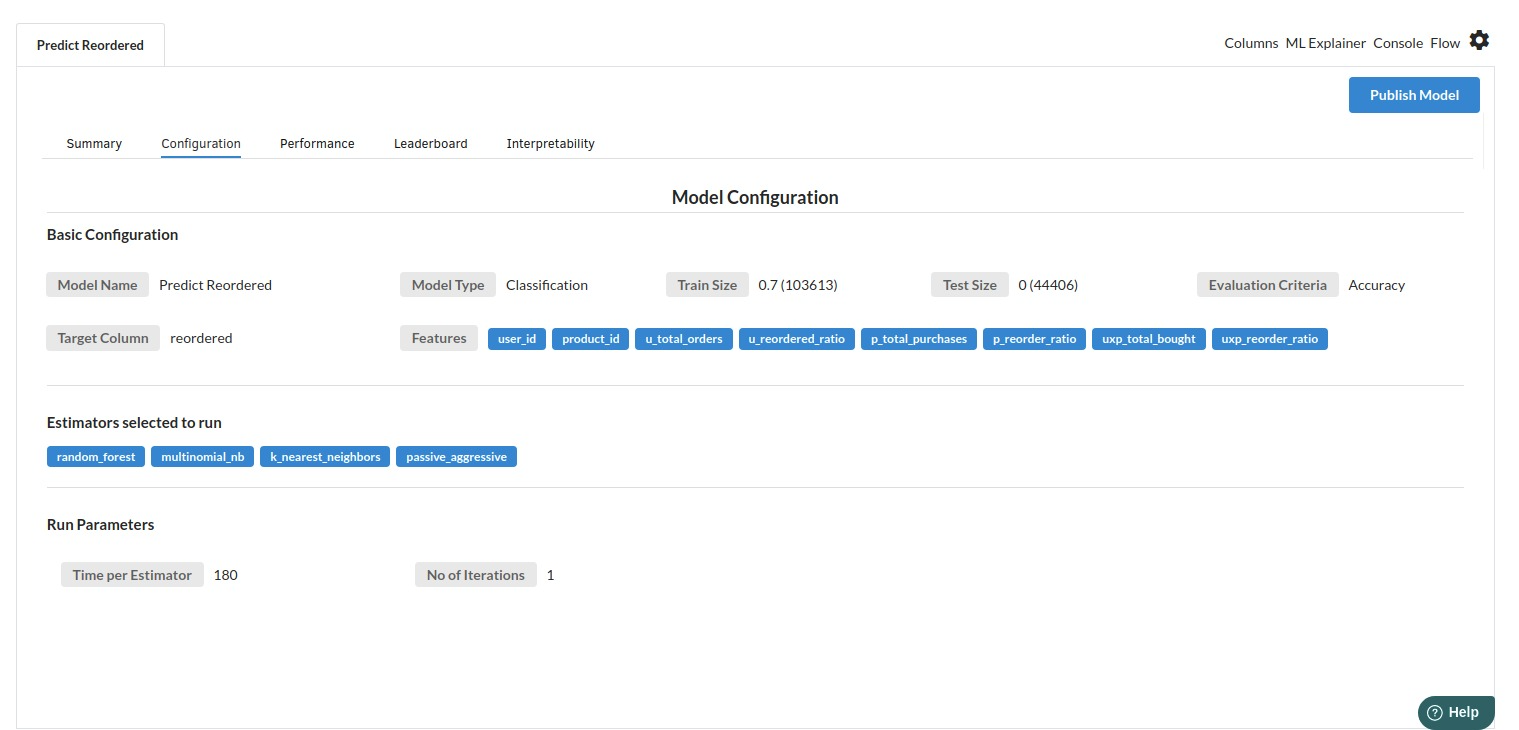
- The second view under Ml explainer is configuration view
The configuration view will give you the information about the step you filled in the Classification step . The view would look like the one below.
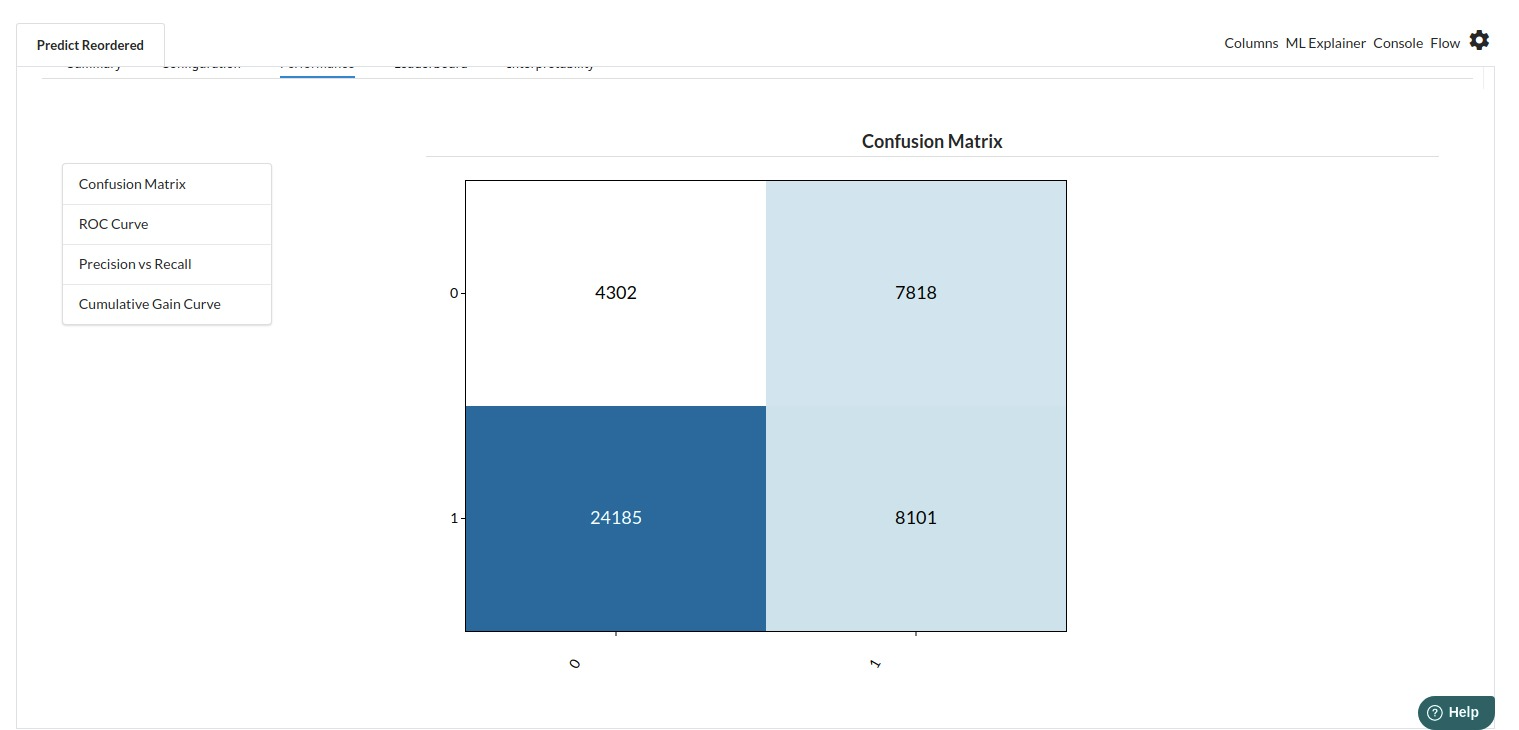
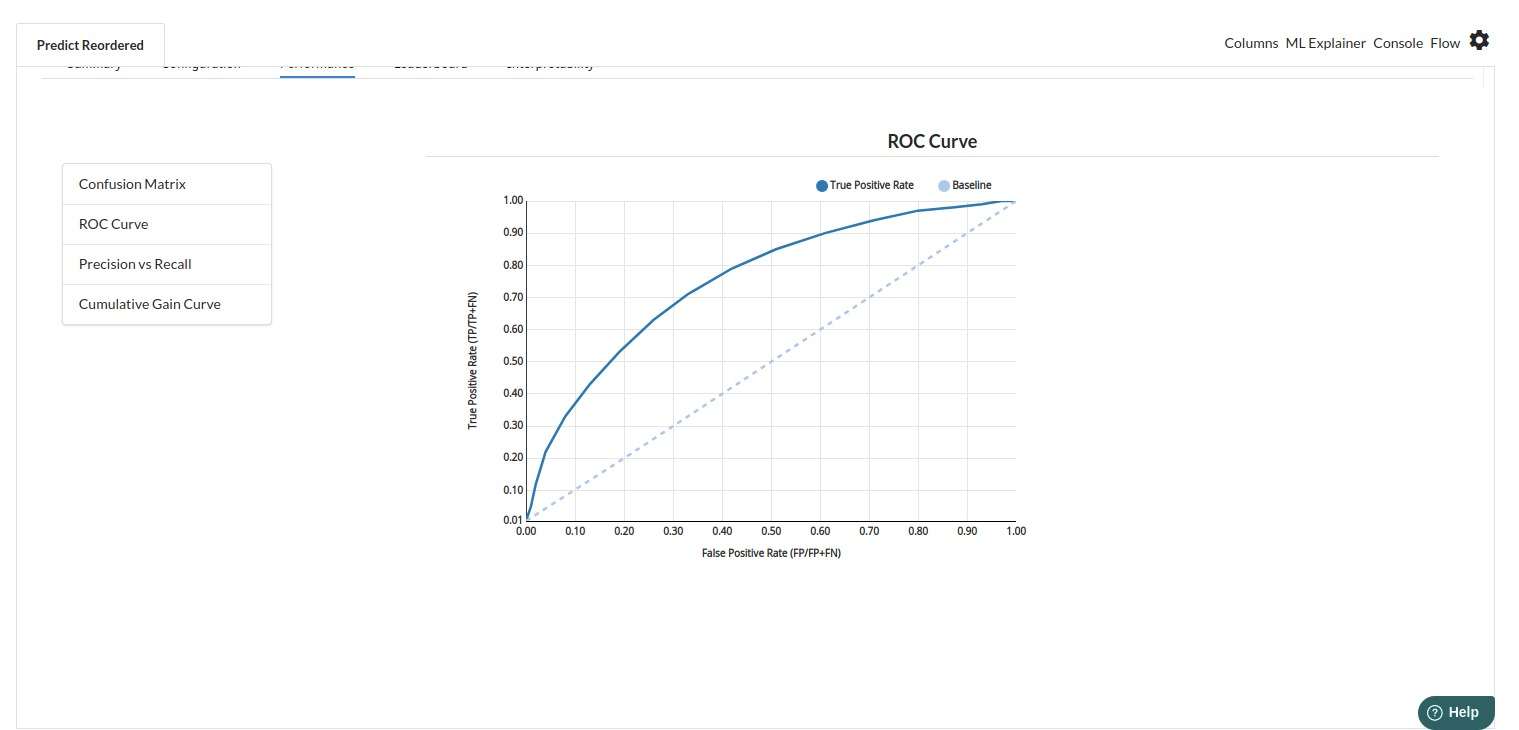
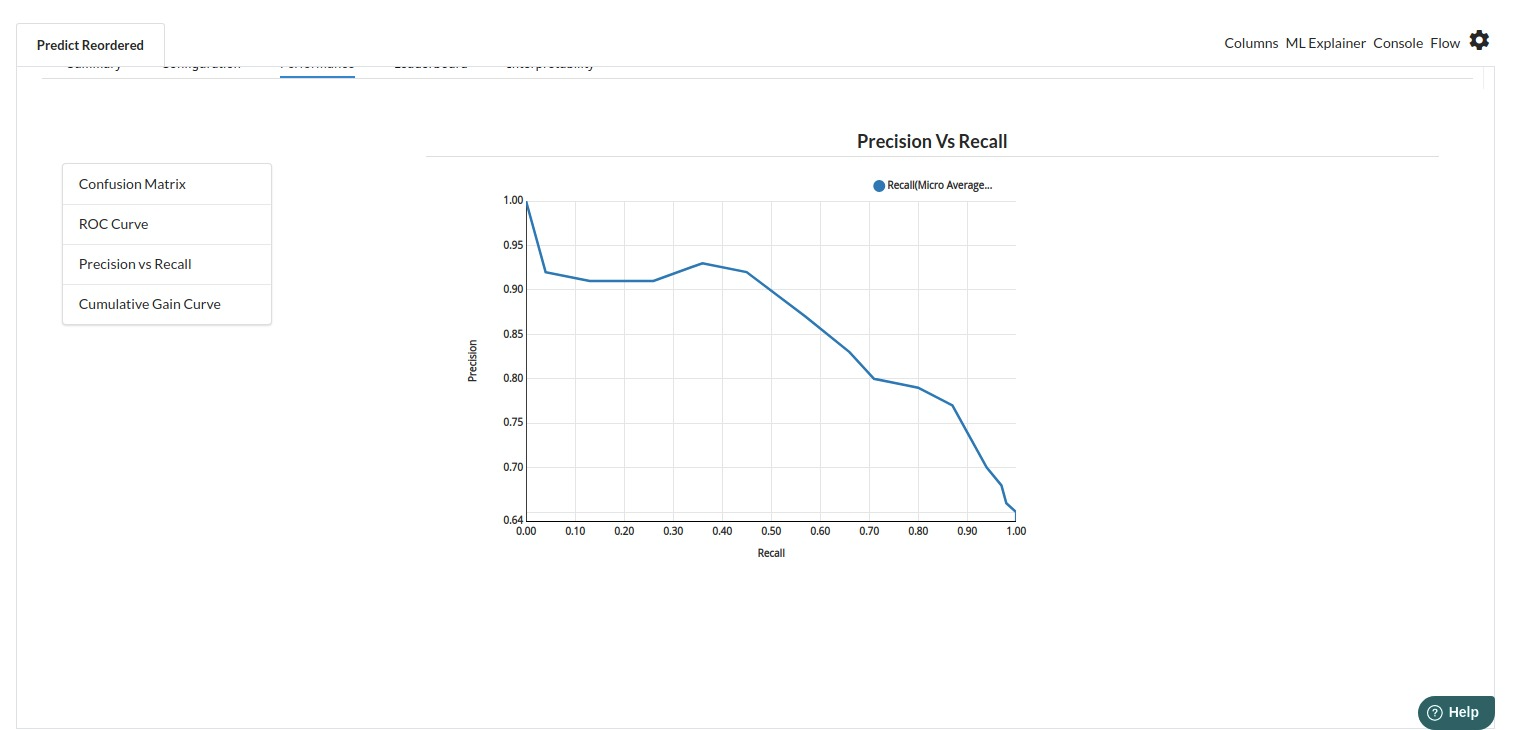
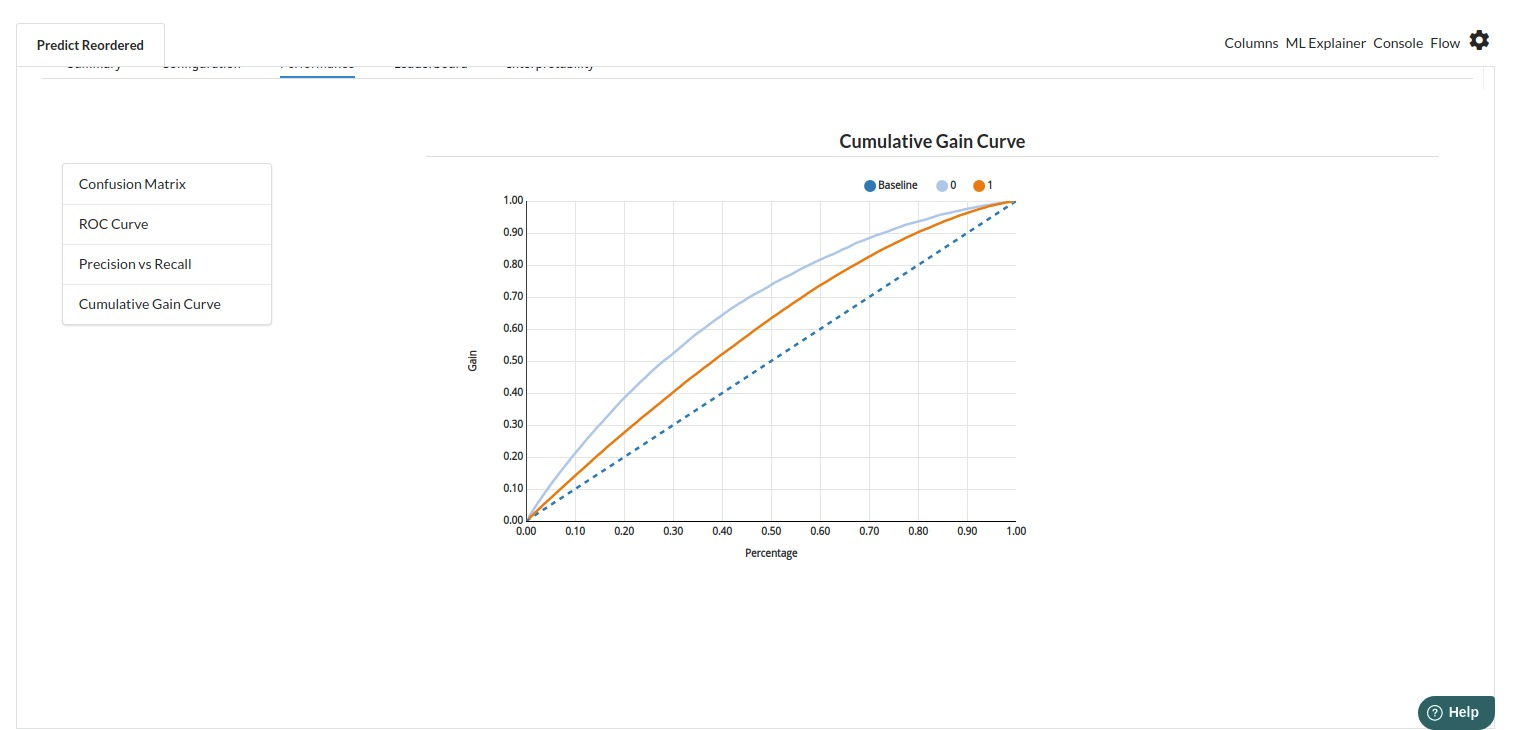
The third view under Ml explainer is Performance View . You can see confusion matrix ,ROC Curve, Precision vs Recall and Cumulative Gain Curve. Look at the built charts and decide if the charts are good enough for your model. The confusion matrix is a good indicator to understand how well your model was trained.
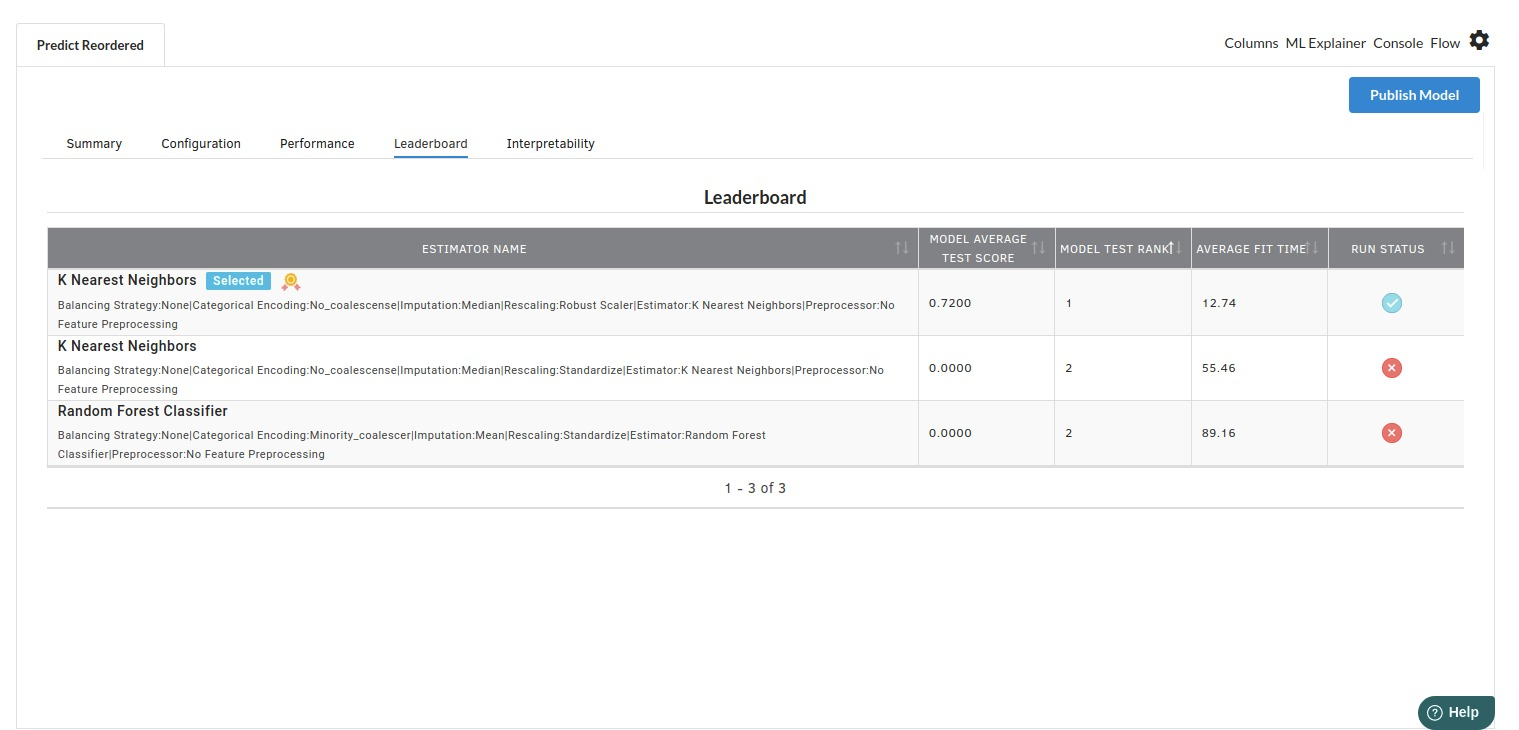
- The fourth view under Ml explainer is Leaderboard . In this view you can see the number of algorithms trained and all the feature engineering done on the algorithms used with ranking system to rank the best algorithm trained.
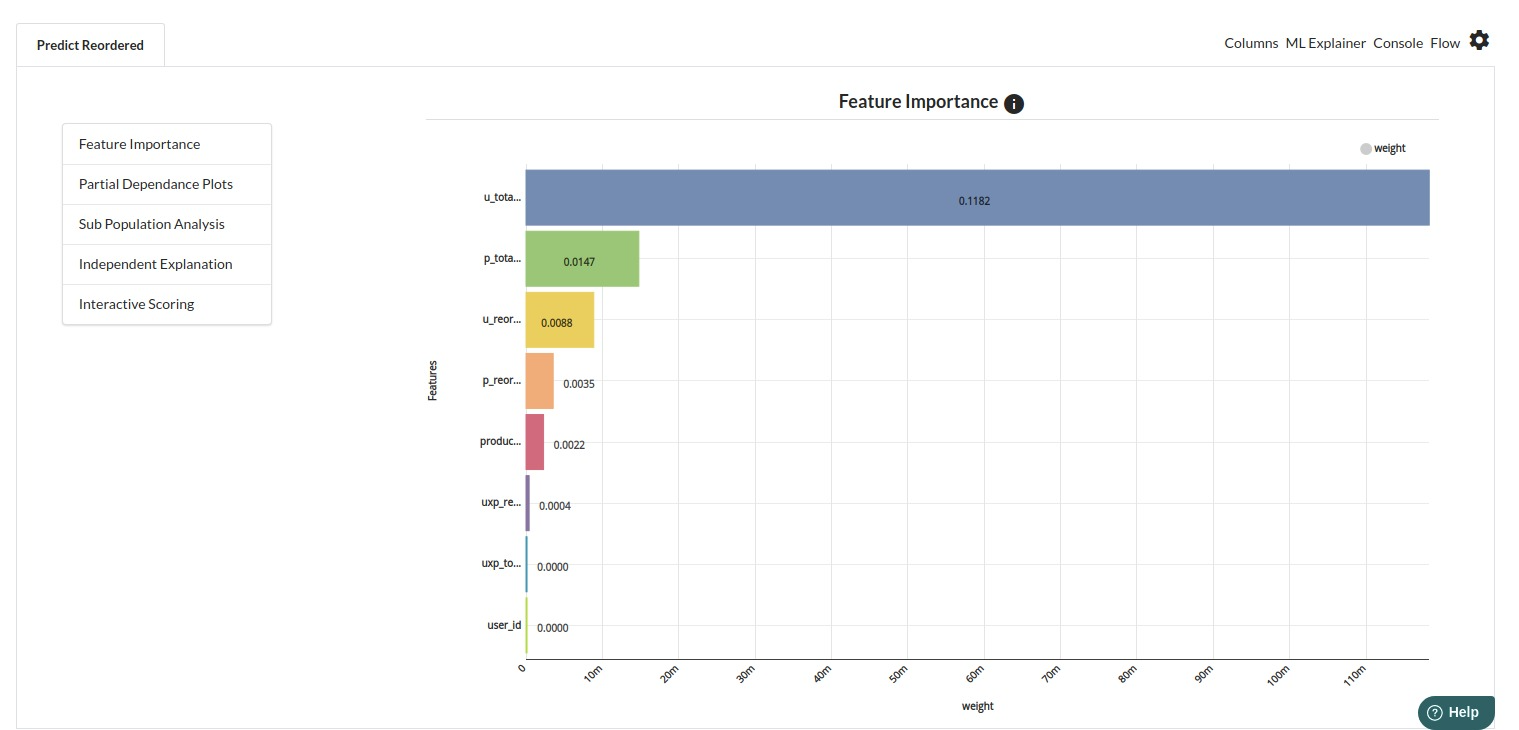
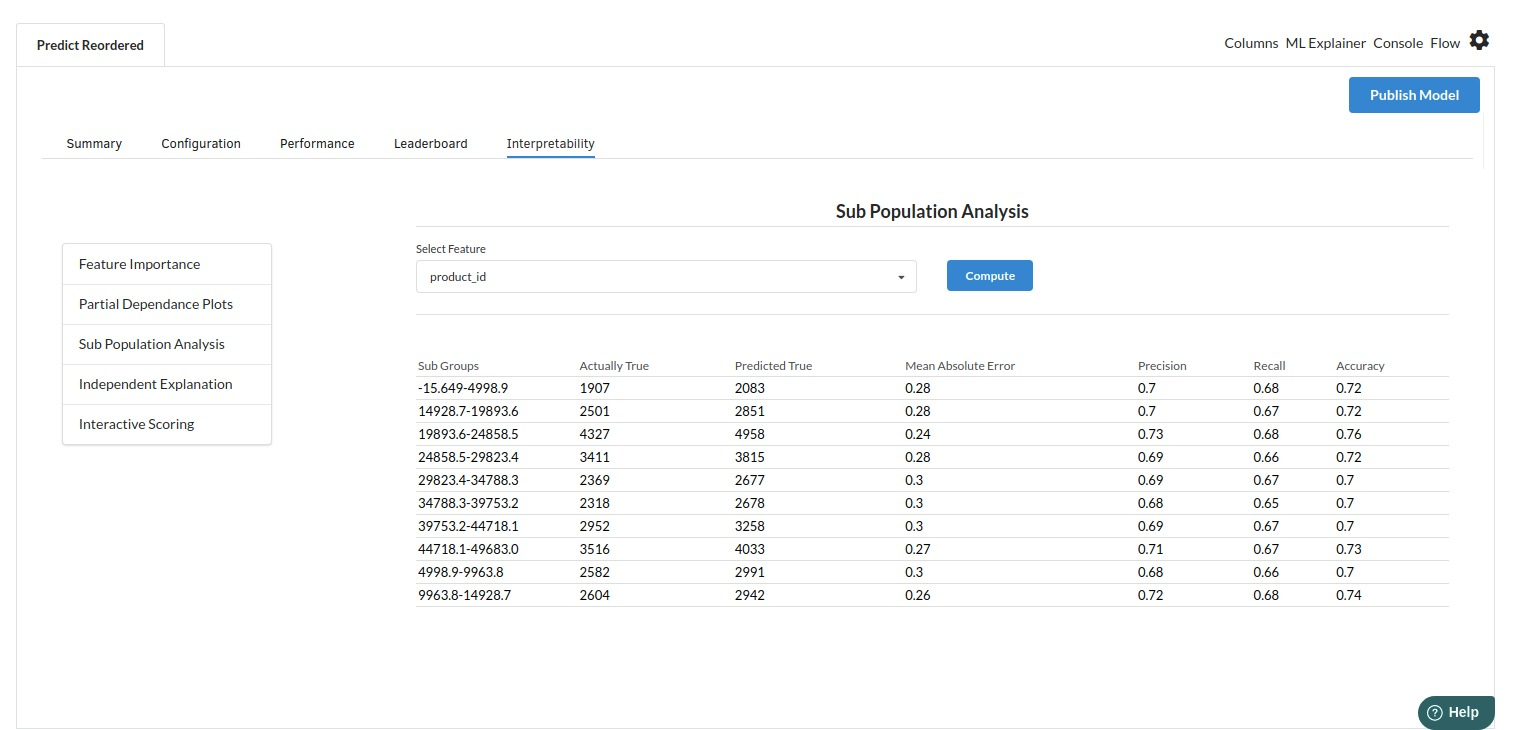
- The last view you see under ML explainer is Interpretability . In this view you will be able to interpret your model in simple terms where you will be getting results pertaining to feature importance , PDP Plots , Sub Population Analysis , Independant Explanation , Interactive Scoring . for more infomation on these results , refer to Interpretability . The Interpretability tab and the results under this tab would look like the one below.