Preventive Maintanence

What is Preventive Maintainance ?
According to wikipedia , The definition of Preventive Maintanence is techniques that are designed to help determine the condition of in-service equipment in order to estimate when maintenance should be performed. This approach promises cost savings over routine or time-based preventive maintenance, because tasks are performed only when warranted. Thus, it is regarded as condition-based maintenance carried out as suggested by estimations of the degradation state of an item.
Objective
The objective of this workflow is determine the probability of a machine failure . i.e, we are going to predict if the machine will fail or not using a classification algorithm based on features such as Torque, Air temperature, Rotational speed and so on of a machine.
Business Goals
-
Operator and machine safety By performing a regular preventive maintenance, you are assured your equipment remains to operate under safe conditions, both for the machine and the operators. Possible issues can be nipped in the but before they have a chance to cause harm.
-
Machine efficiency Normal wear and tear can result in lower machine efficiency. Preventive maintenance assures optimal working conditions and conserves the life span of the equipment.
-
Time savings A planned preventive maintenance may cause small hindrance for production, but that is nothing compared to actual downtime caused by a breakdown. Because it is planned, production can propose the optimal time and can factor in the nuisance. Preventative maintenance procedures take less time than emergency repairs and replacements.
-
Procedure Our technicians dispose of a fully equipped service vehicle with all necessary tools for maintenance and small repairs.
Relevance of Xceed
Xceed will give a NO-CODE environment for the end to end execution of this project starting with uploading of the datasets from various sources to deploying the model at the end point. Starting with exploring the data to building a model and deploying it , all of these are NO-CODE.
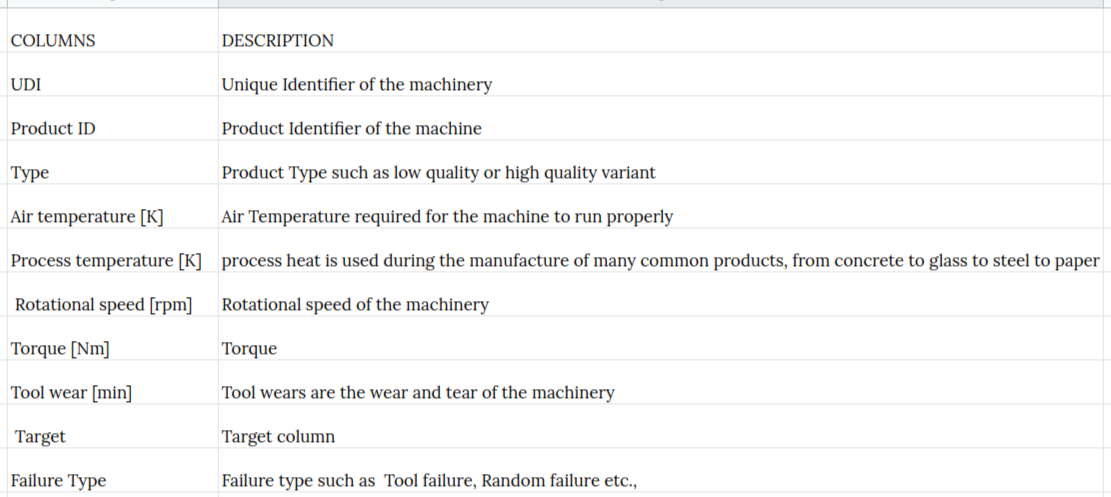
Data Requirements
we will be a relevant dataset for this workflow which will include columns as such :
Output Expectations
The output expectations from this workflow is to understand the patterns of the machinery working and the probability of a machinery failure by analysing the underlying data and building a classification ML model and deploying it after understanding how the model was built and what were the explainable points from the model.
Basic flow
- Upload the data to Xceed Analytics and create a dataset
- Create the Workflow for the experiment
- Perform initial exploration of data columns.
- Perform Cleanup and Tranform operations
- Build/Train a Classification Model
- Review the model output and Evaluate the model
- Deploy/Publish the model
Uploading the data to Xceed Analytics and create a dataset
- Upload the Preventive Maintanence demo dataset to Xceed Analytics fromt the Data Connections Page. For more information on Data Connections refer to Data Connections
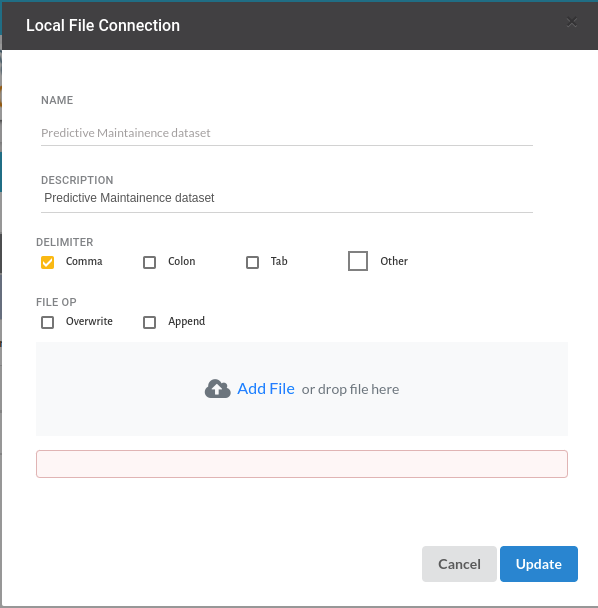
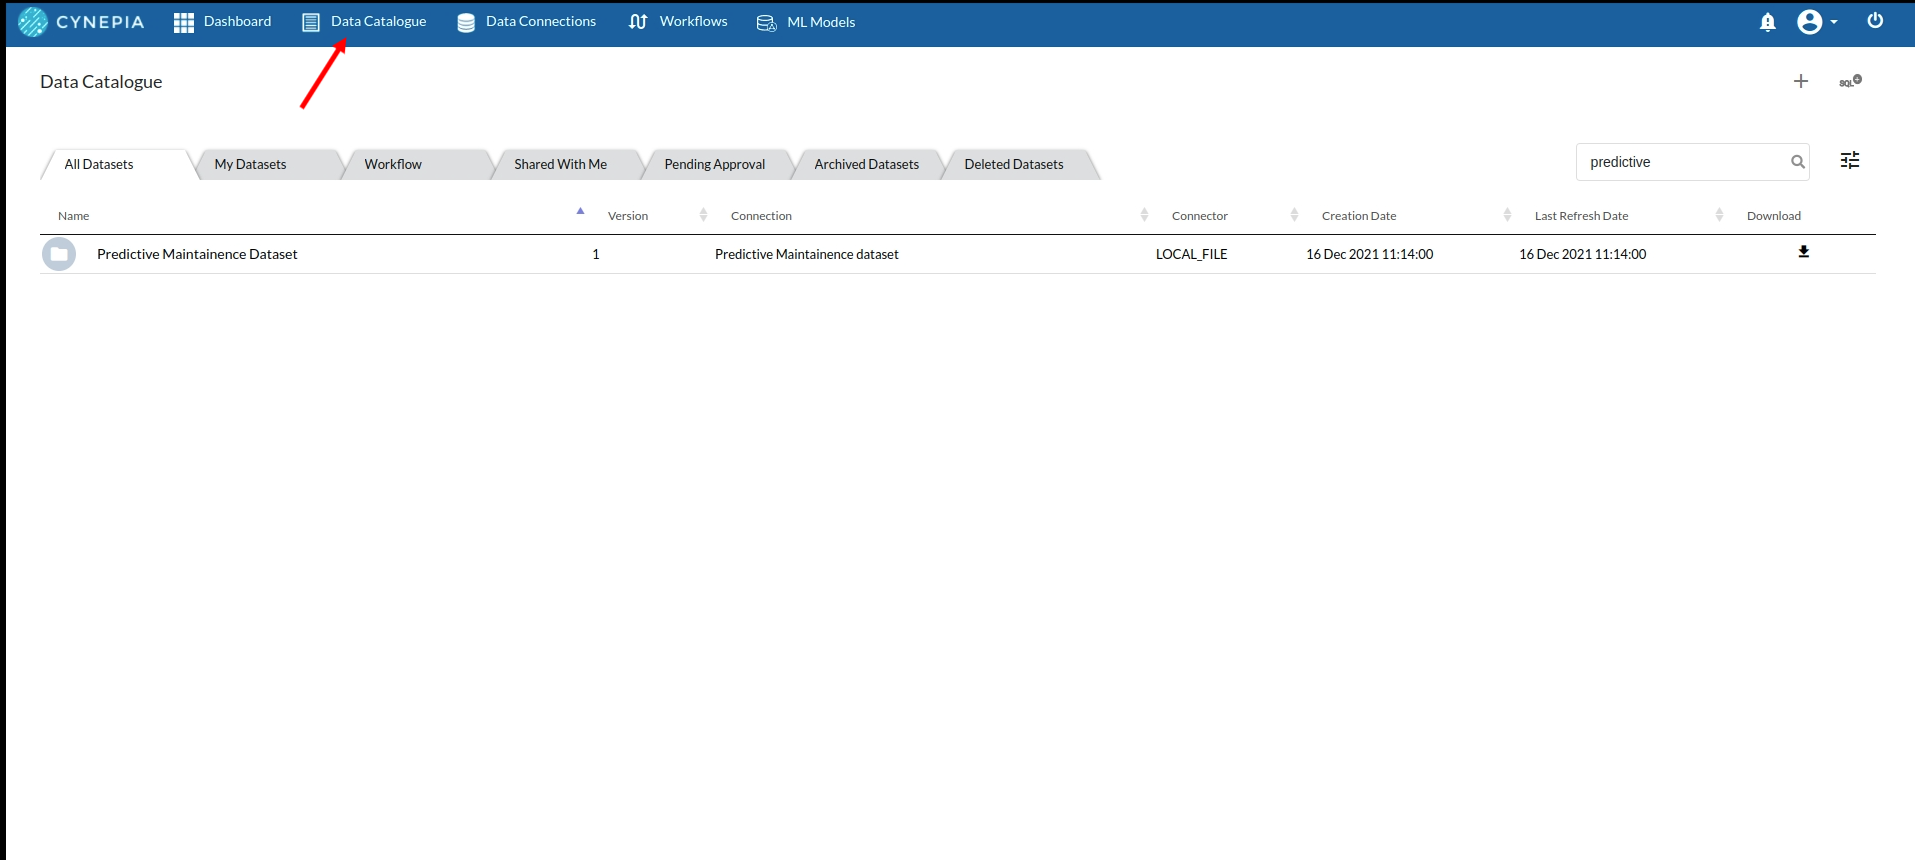
- Create a dataset under data catalogue from the uploaded datasource. For more information on how to create a dataset, refer to Data Catalogue
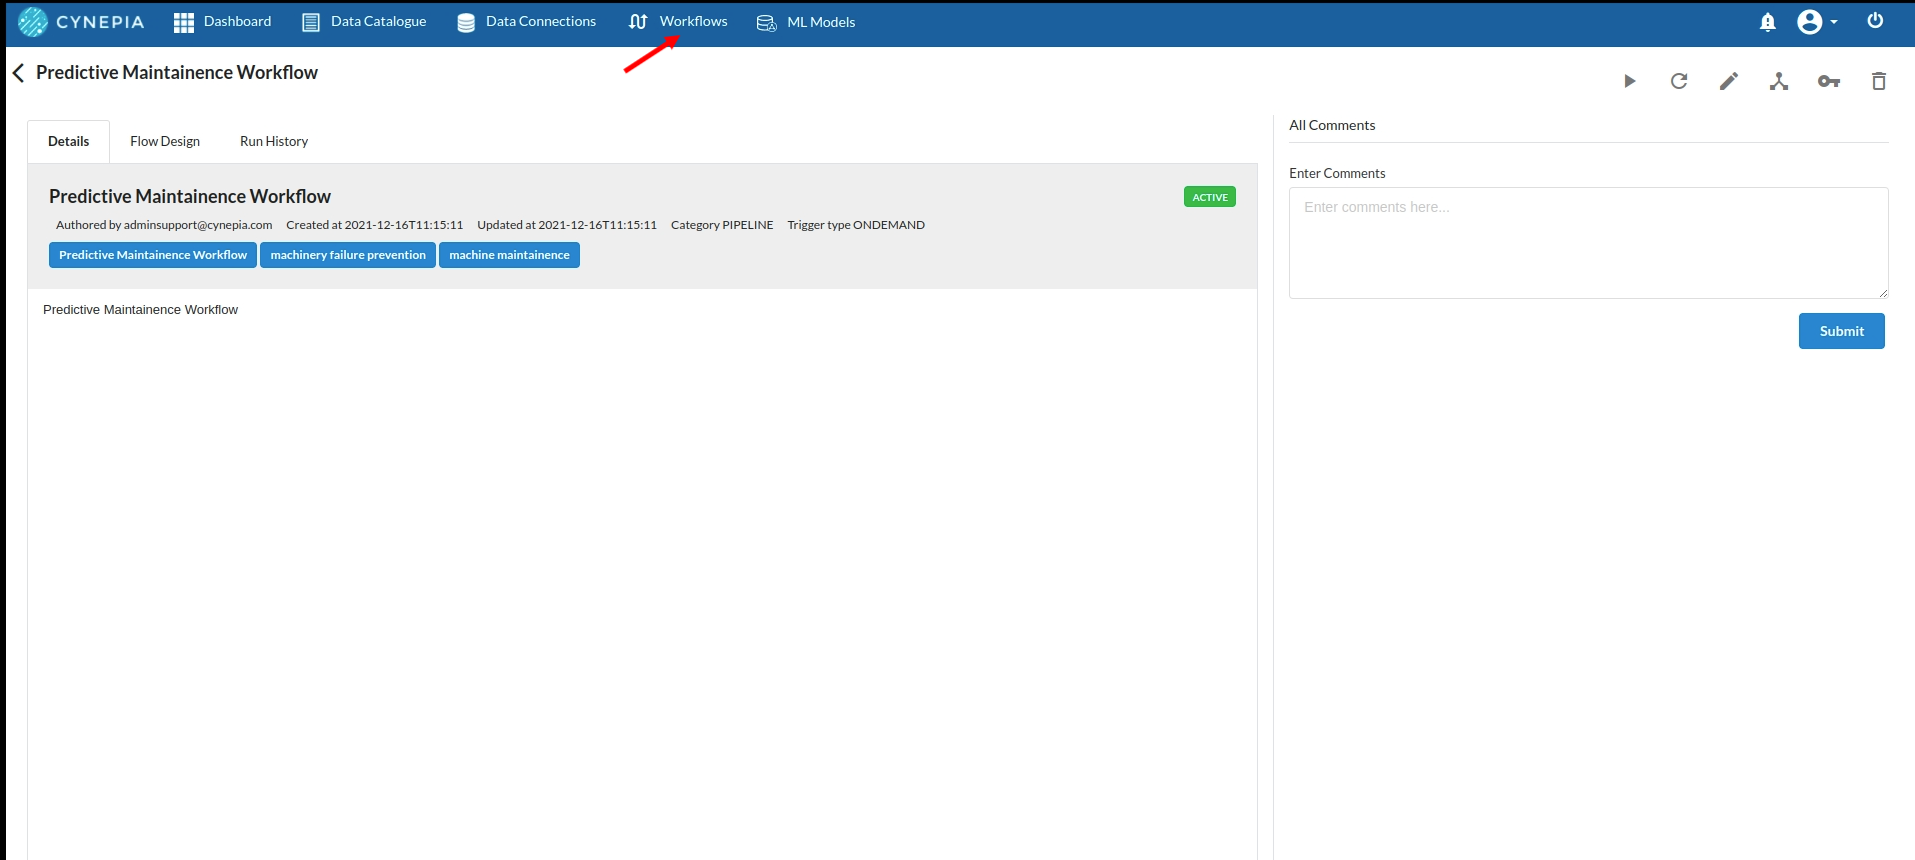
Create the Workflow for the experiment
- Go to the Workflows Tab on the Navigation and Create our first Regression Experiment/Workflow. For more information on how to create a workflow, refer Create Workflow
Perform initial exploration of data columns
Take a look at the output view and glance at the datatypes of the columns. for more information on the output window , refer to Output Window

Take a look at the distribution of the data columns with the header profile on the top of the output view.
Go to columns section to do some univariate analysis on all the columns. for more information, refer to Column Statistics
Build/Train a Classification Model
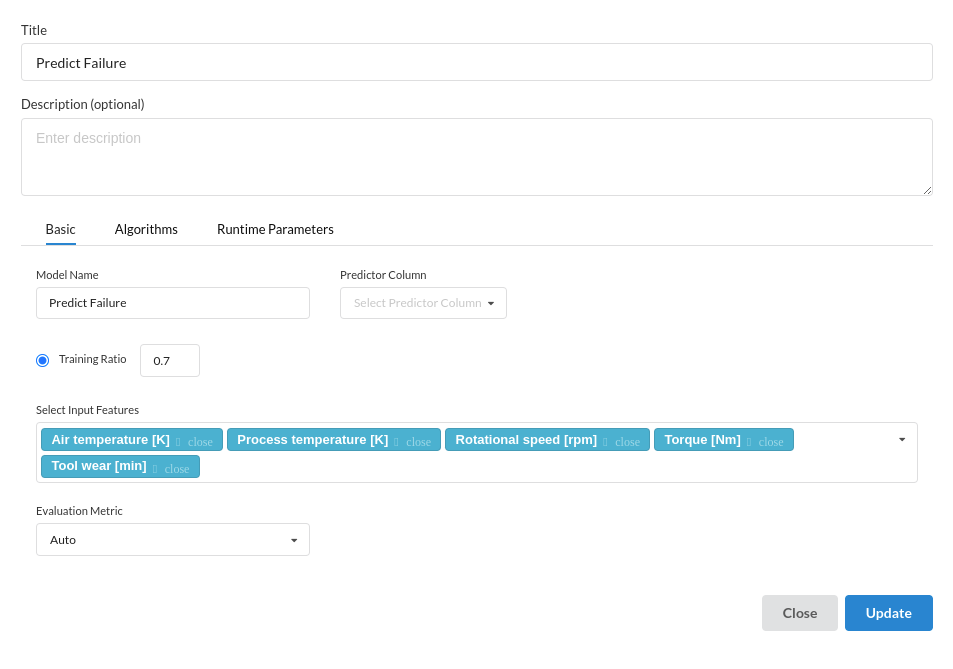
Since this is a classification problem and the end goal is to predict if the machine is going to be damaged, The proper processor for this is Classification(autopilot). The filled step for the same would look like the one below
- In the Basic view,Fill the step with the feature variables, predictor variables, Training ratio and the metric option.
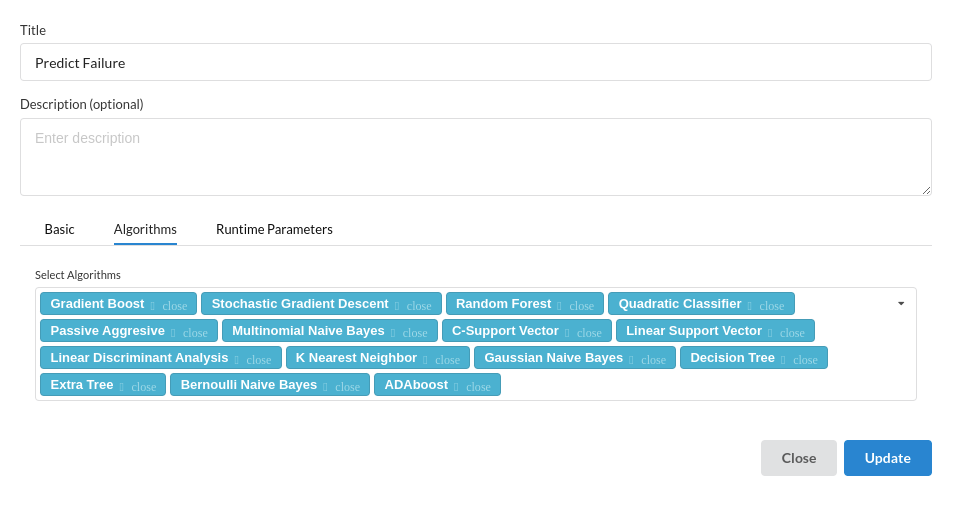
- In the Algorithms view, choose any or all the algorithms you desired to train .
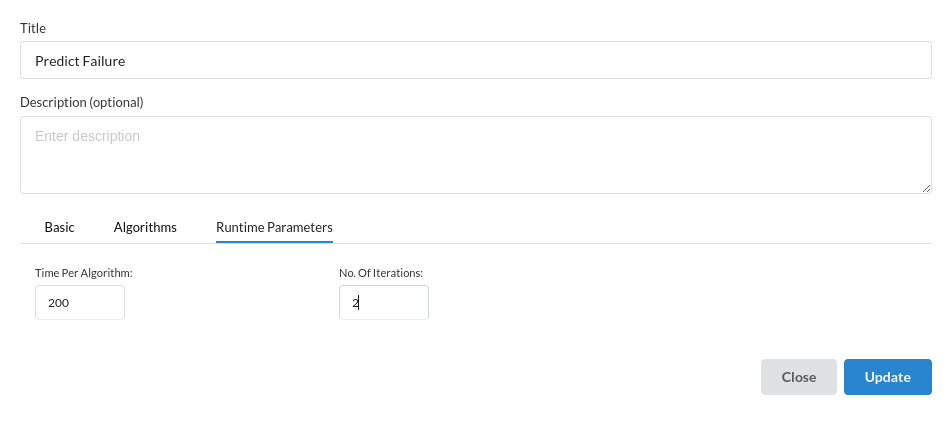
- In the Runtime parameters view, fill in the time you want to train the models on.
Review the model output and Evaluate the model
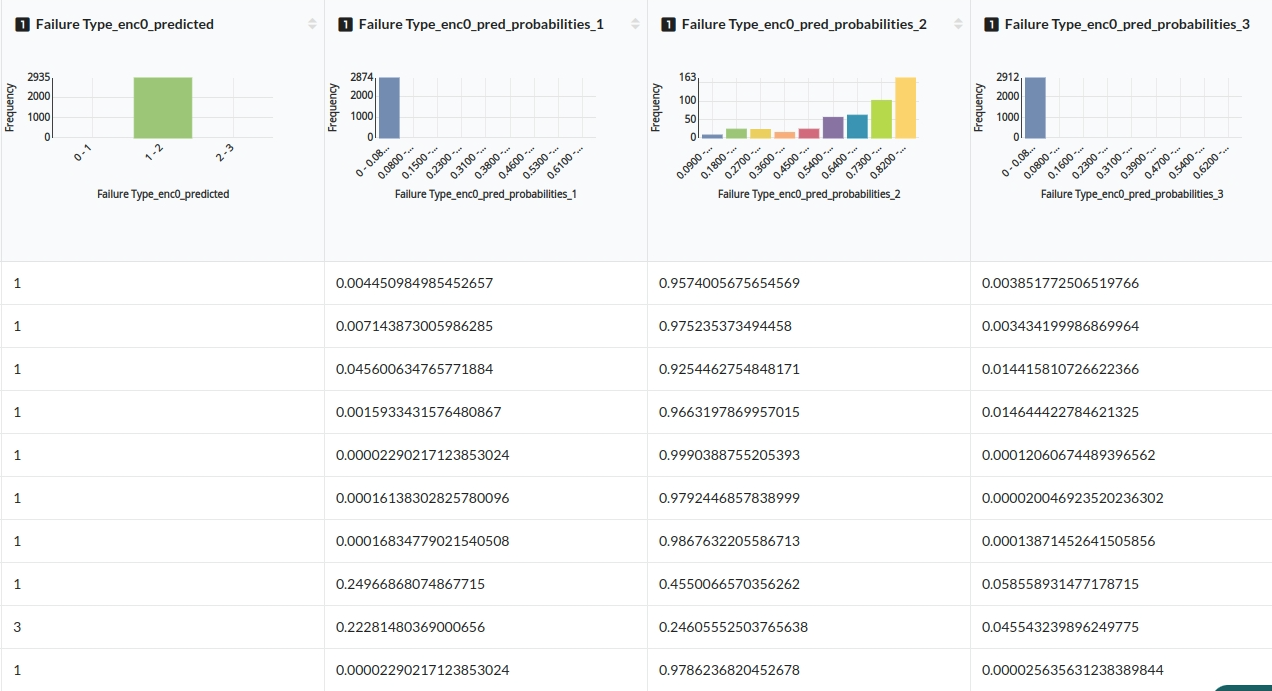
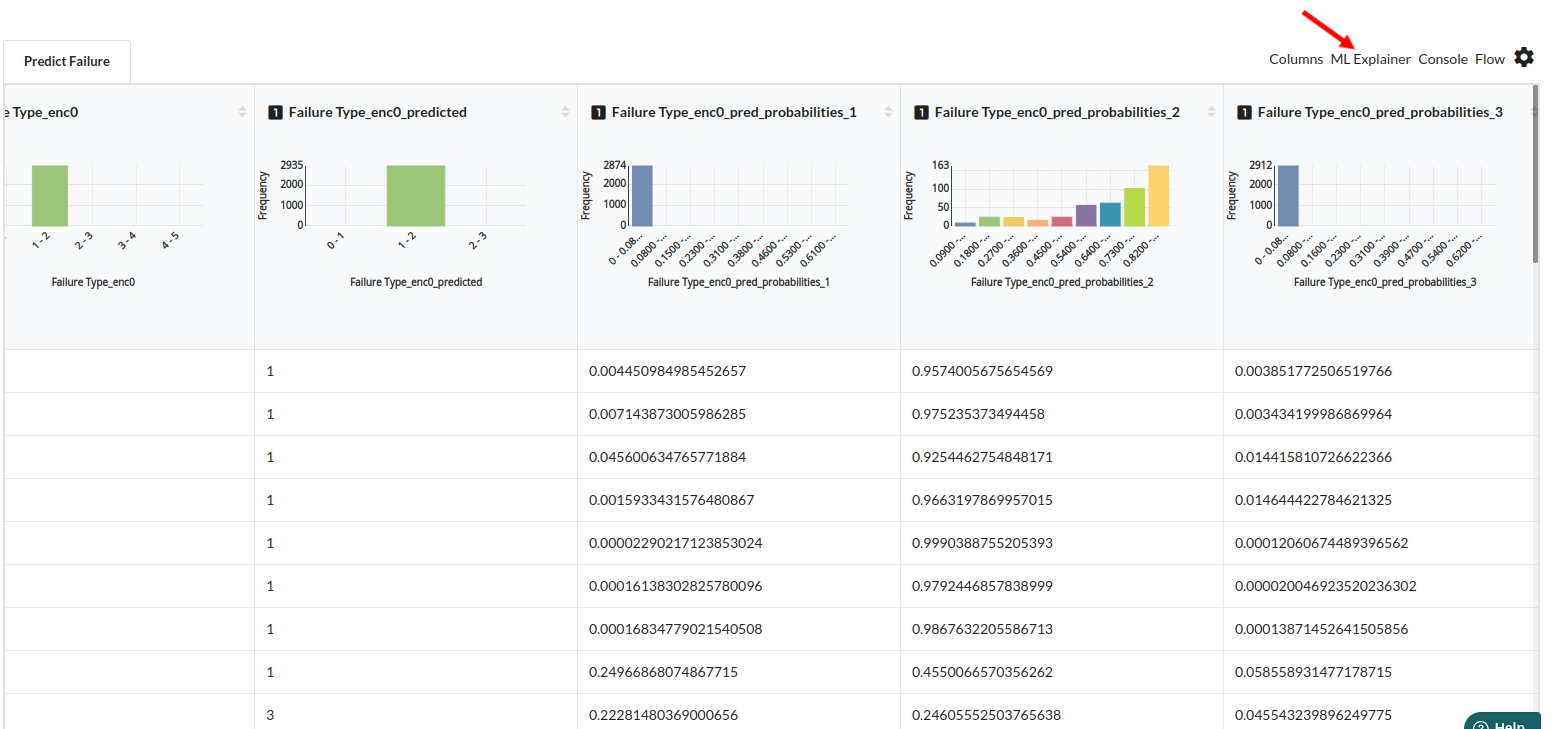
When you finish building your model you will see new columns created such as Predicted column , Class probabilities. the columns created for this workflow would look like the one below.
When you finish building your model you will see another tab in the view called Ml explainer . Click on that to evaluate your model.
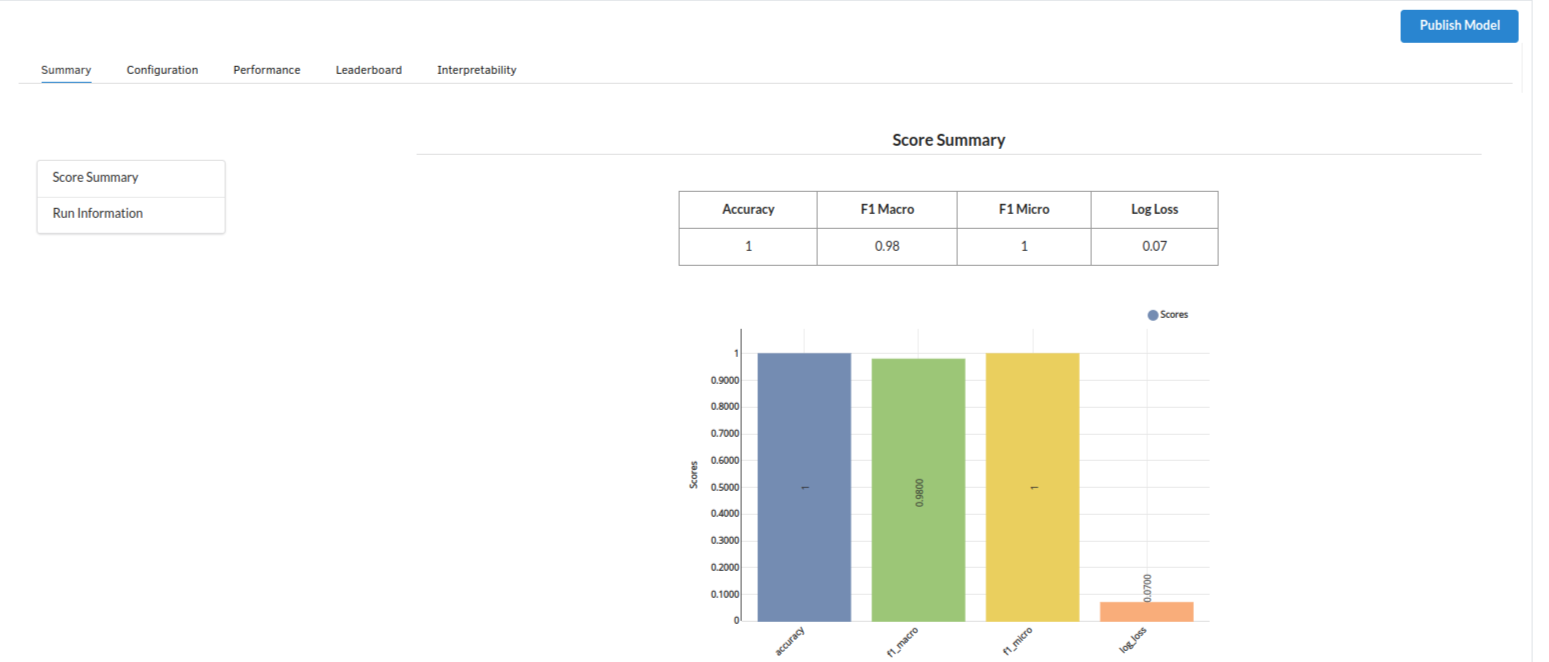
- The first view you see when you click on ML explainer is the Summary view
The first sub view under summary view is the Score Summary
The second sub view under the summary view is Run Information
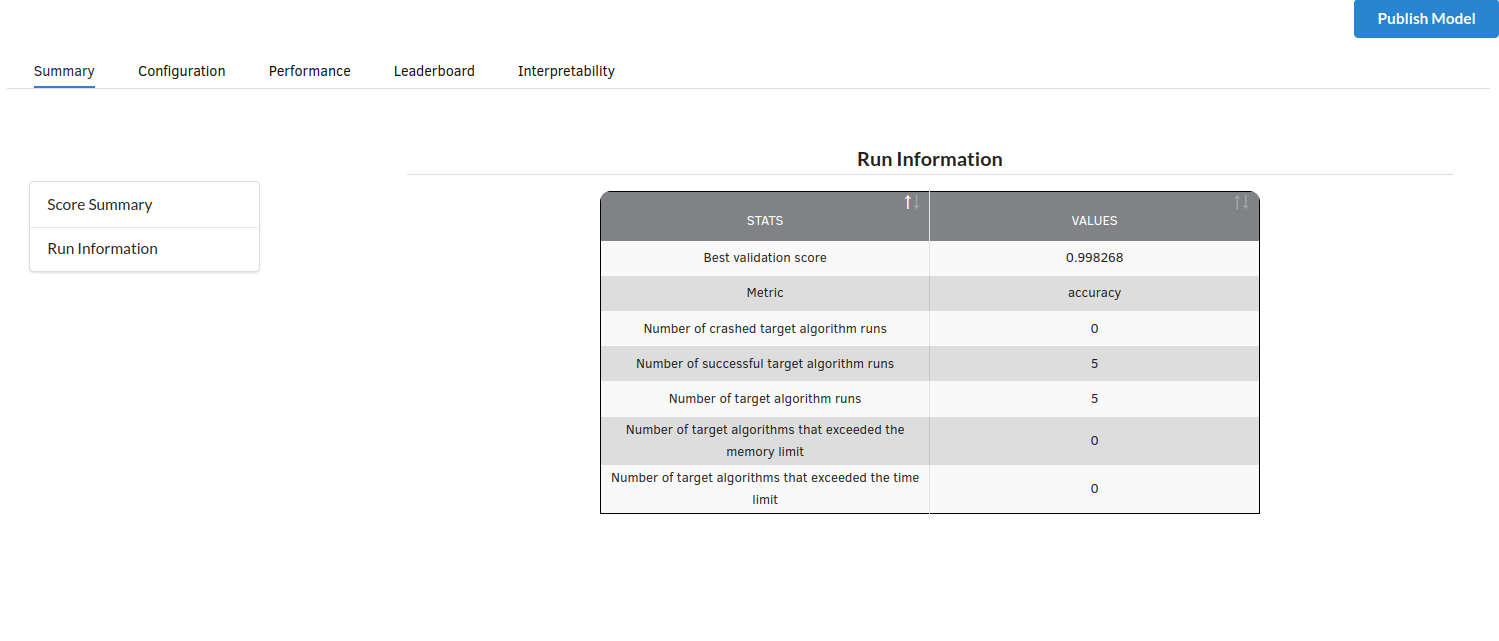
Look at the metrics score and the Run summary stats. Based on your calculations decide if Accuracy , F1 macro, F1 micro and log loss according to your expectations.if not this will be your first step to rethink the training process.
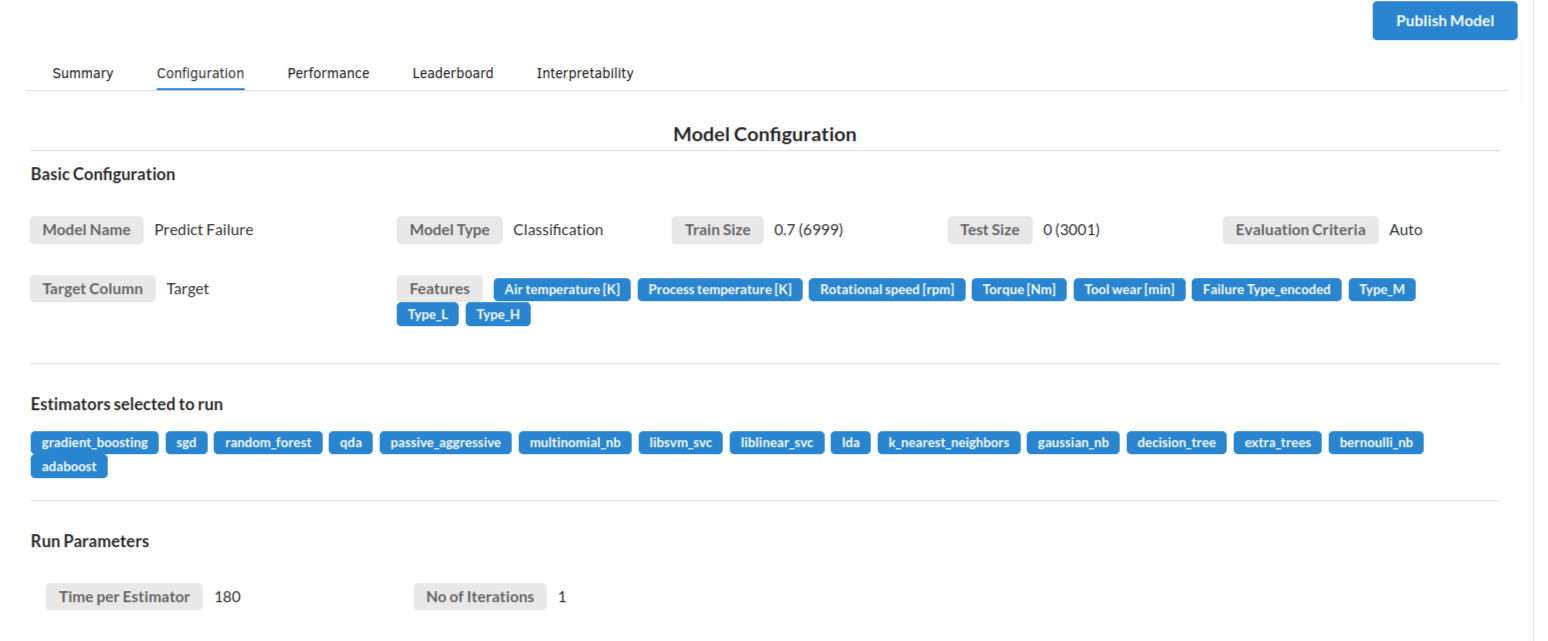
- The second view under Ml explainer is configuration view
The configuration view will give you the information about the step you filled in the Regression step . The view would look like the one below.
- The third view under Ml explainer is Performance View . You can see the Confusion Matrix , ROC Curve,Precision vs Recall and Cumulative Gain Curve charts for Classification models. Look at the built charts and decide if the charts are good enough for your model.

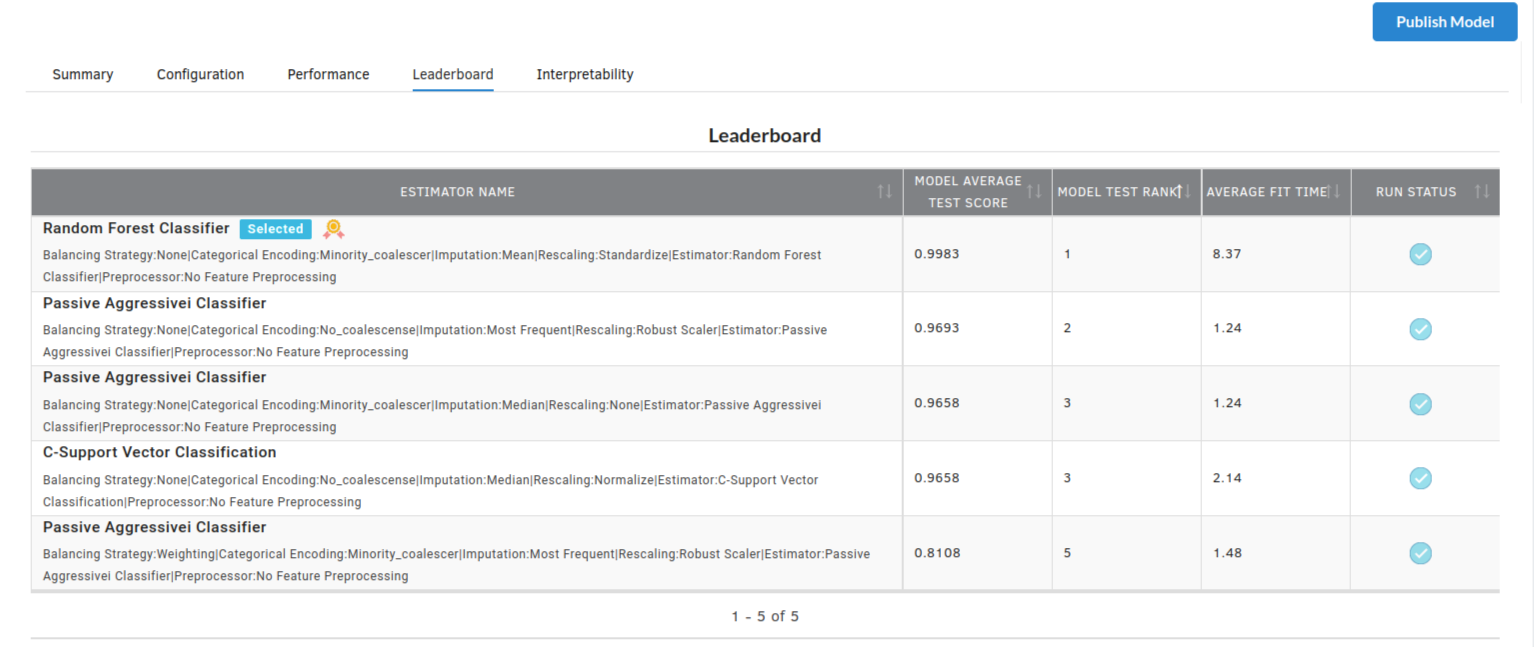
- The fourth view under Ml explainer is Leaderboard . In this view you can see the number of algorithms trained and all the feature engineering done on the algorithms used with ranking system to rank the best algorithm trained.
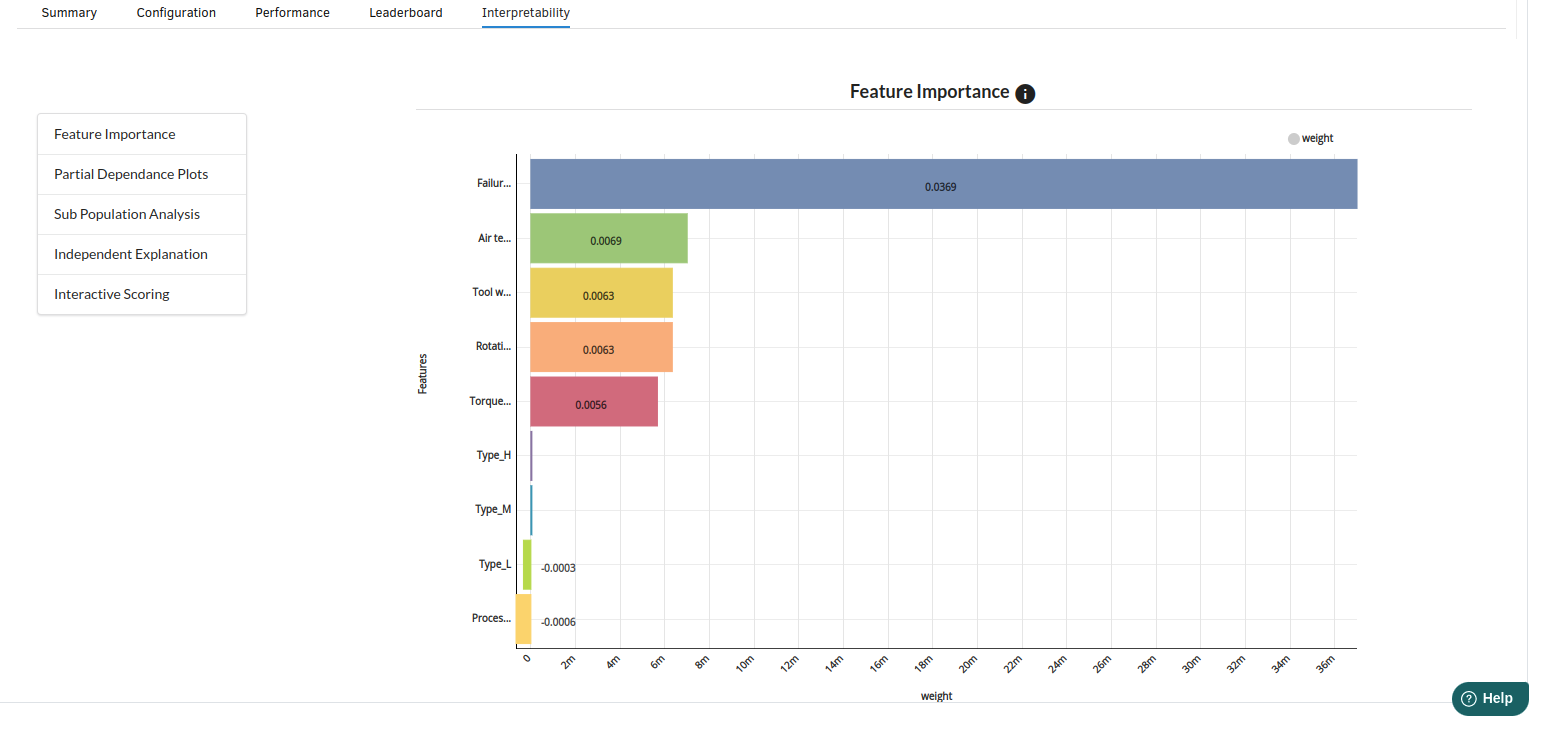
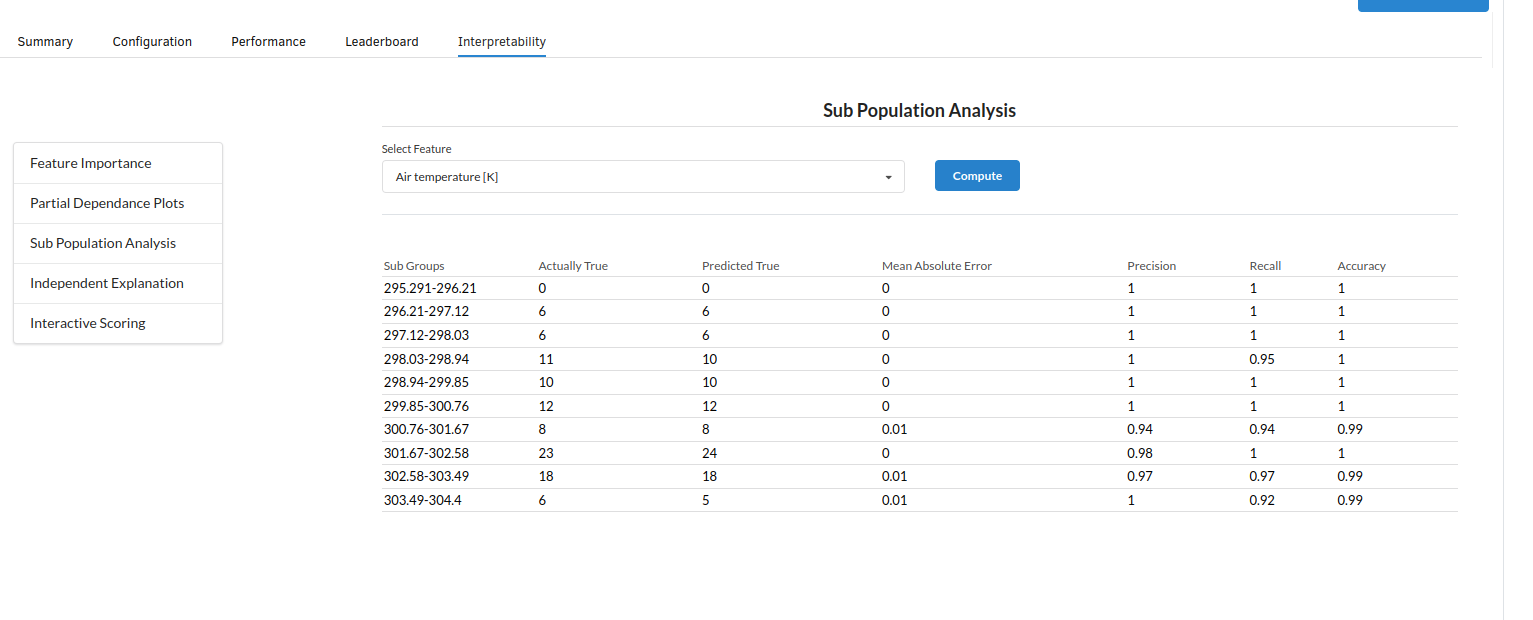
- The last view you see under ML explainer is Interpretability . In this view you will be able to interpret your model in simple terms where you will be getting results pertaining to feature importance , PDP Plots , Sub Population Analysis , Independant Explanation , Interactive Scoring . for more infomation on these results , refer to Interpretability . The Interpretability tab and the results under this tab would look like the one below.
- Feature Importance
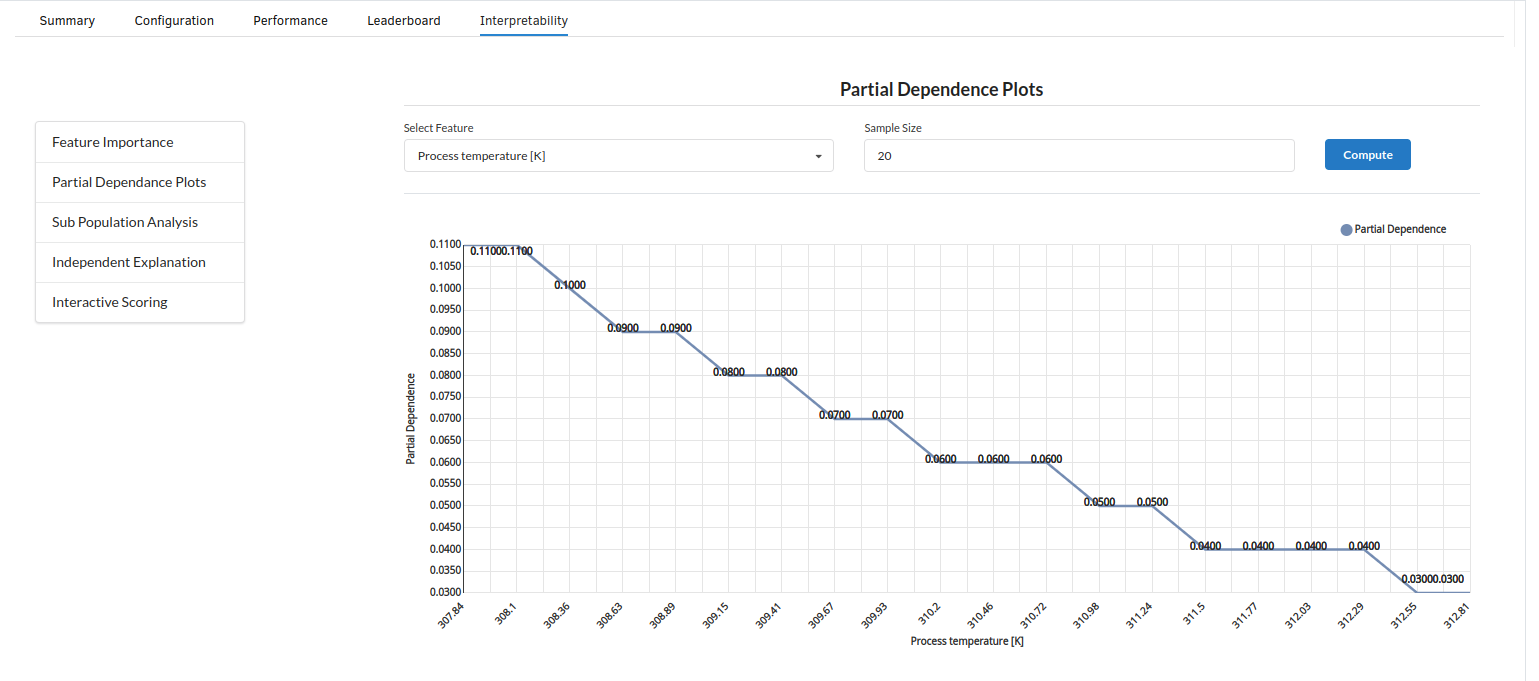
- Partial Dependance Plots
- Sub Population Analyis
for more information, refer to ML explainer Tab