Order Delivery Delay Prediction

Background
The convenience of doing business has risen dramatically since the emergence of ecommerce. One need not own or rent a physical store to do business as a businessperson. The online store is your e-commerce website. Furthermore, customers no longer need to visit stores in order to purchase their desired products. They can do it from the comfort of their own homes, and the things will be delivered right to their door. Starting an e-commerce business is not without its difficulties. One of the difficulties is that business owners must be prepared to deliver goods to their customers. The most significant flaw, though, is the delivery delay. To figure out how to avoid delivery delays, one must first understand out what causes them. Several businesses frequently have trouble delivering goods to their customers on time.Some causes of delivery delay are as follows:
-
Documentation mistakes : Misspelled addresses, incomplete order forms, and insufficient information are just a few examples. This error could be caused by either the customers or the store. When dealing with multiple tasks at the same time, the store may neglect to properly document orders. When a delivery business is given insufficient information, the package is more likely to be returned to the sender.
-
System failure : E-commerce stores are frequently open 24 hours a day, seven days a week. However, if a business uses a subpar hosting company, its website is likely to have technical issues. If there are frequent system failures, it will be unable to respond to orders. As a result, delivery will be delayed.
-
Logistical problems : For small firms, logistical issues can be a nightmare. In reality, one of the most common causes of delivery delays is logistics. The inability to handle high product demand and many requests could be a Biggest weakness. When faced with a circumstance like this, an internet business's delivery services must be outsourced.
-
Bad weather : Delivery delays might be caused by poor weather. This is beyond the delivery agent's control, yet it should not be used as an excuse for late delivery.
Delays in delivery can have a significant negative impact on any e-commerce firm. Businesses who do nothing to address delivery issues frequently see a decline in sales. The majority of customers are sincere and considerate. They are aware that human mistake can result in delivery issues. If consumers are inconvenienced by delivery delays on more than one or two instances, they are likely to lose faith in the company. As a result, it is critical that you address delays as soon as possible.Customer retention is directly related to delivery time. Customers who have their orders delivered late the first time are less inclined to shop from the same company again. Customers who are loyal will be affected by late deliveries. They are likely to wait a long time before placing another order. Customer retention is directly related to delivery time. Customers who have their orders delivered late the first time are less inclined to shop from the same company again. Customers who are loyal will be affected by late deliveries. They are likely to wait a long time before placing another order.Reputation is essential in e-commerce.
Objective
This usecase help predict the delivery delay based on various products and their estimated delivery date and actual delivery date. This delay prediction can be used for various econometric and statistical planning.
Relevance of Xceed Analytics
Xceed Analytics provides a single integrated data and AI platform that reduces friction in bring data and building machine models rapidly. It further empowers everyone including Citizen Data Engineers/Scientist to bring data together and build and delivery data and ml usecases rapidly. It's Low code/No code visual designer and model builder can be leveraged to bridge the gap and expand the availability of key data science and engineering skills.
This usecase showcases how to create , train/test, and deploy a delivery delay regression model. The datasets are obtained from Kaggle.They include customers dataset, geolocation dataset,order items datset, orders dataset, products dataset and sellers dataset.Starting with the uploading of datasets from multiple sources to the deployment of the model at the end point, Xceed will provide a NO-CODE environment for the end-to-end implementation of this project. All of these steps are built using Visual Workflow Designer, from analyzing the data to constructing a model and deploying it.
Data Requirements
We will be using the following datasets for this usecase.
- Customer dataset : contains customer information
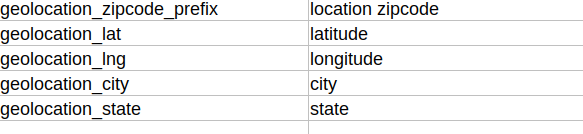
- Geolocation dataset : contains location latitude and longitude information
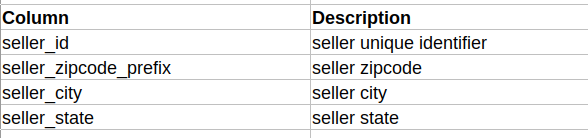
- Seller dataset : contains seller information
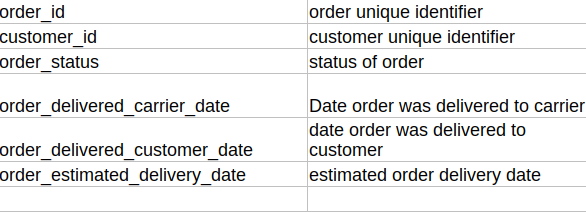
- Orders dataset : contains order related information
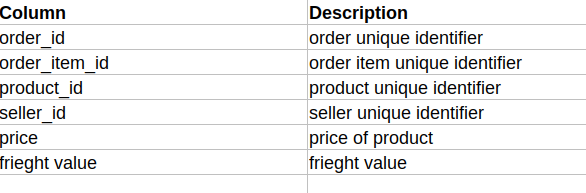
- Order items dataset : contains the information of the ordered items
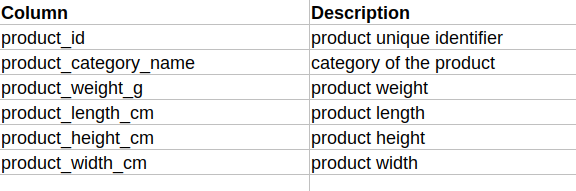
- Products dataset : contains products related information
Columns of interest in the dataset :
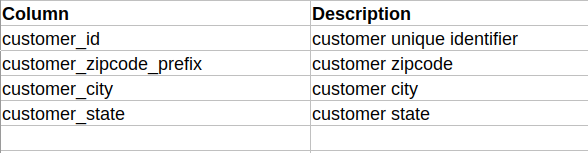
Customer Dataset:
Geolocation Dataset:
Seller Dataset:
Orders Dataset:
Order items Dataset:
Products Dataset:
Model Objective
Understanding trends in delivery delay over time and predicting future delays by analysing the underlying data, constructing a regression machine learning model, and implementing it after defining the model's major features.
Steps followed to develop and deploy the model
- Upload the data to Xceed Analytics and create a dataset
- Create the Workflow for the experiment
- Perform initial exploration of data columns.
- Perform Cleanup and Tranform operations
- Build/Train a regression Model
- Review the model output and Evaluate the model
Upload the data to Xceed Analytics and Create the dataset
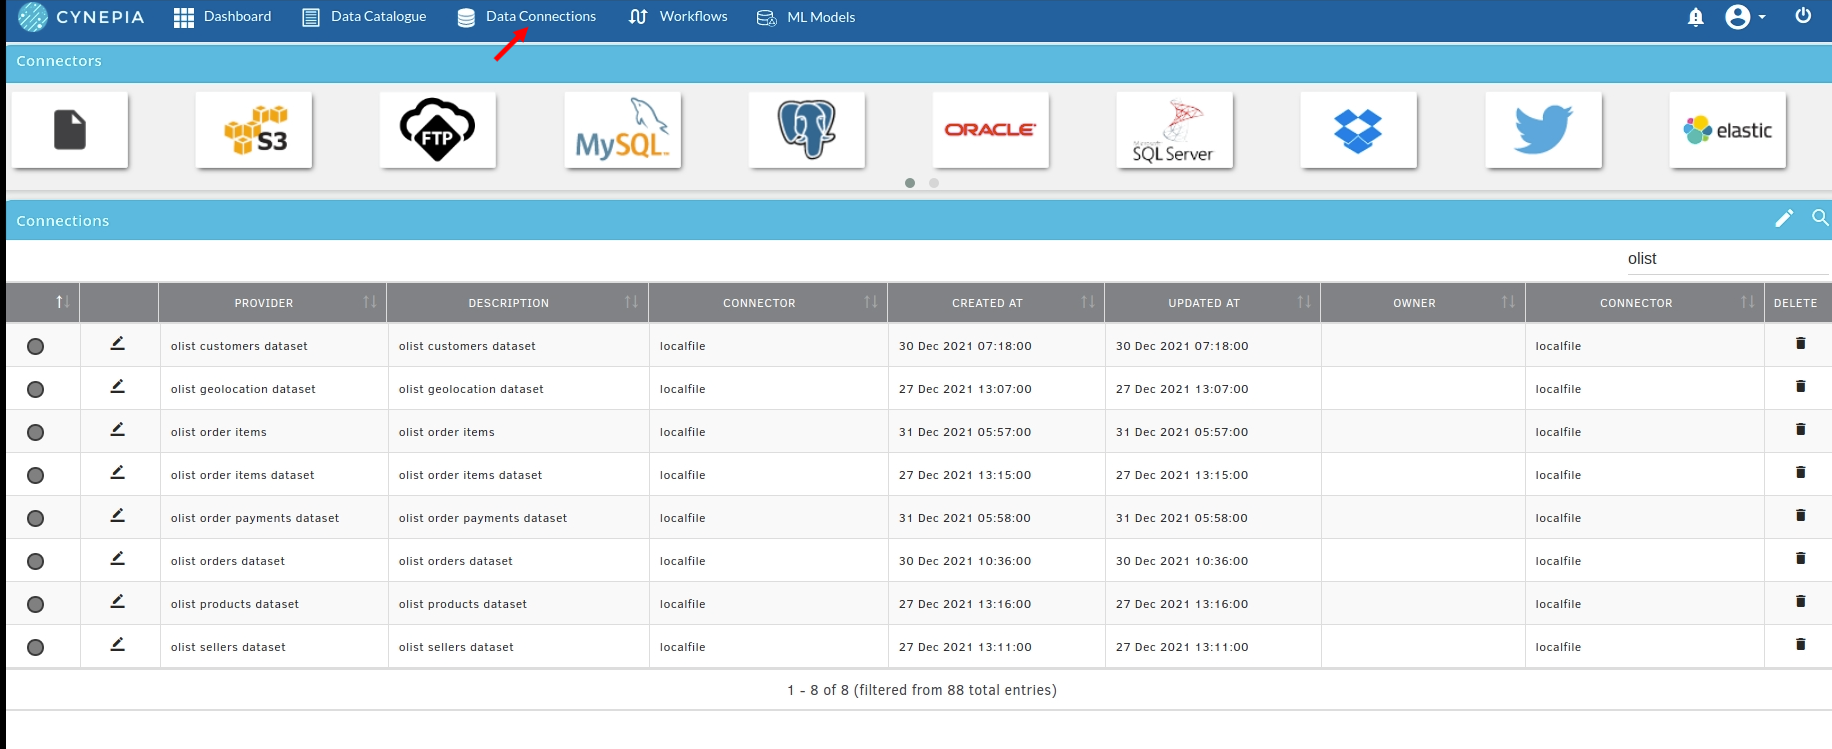
- From the Data Connections Page, upload the datasets to Xceed Analytics. For more information on Data Connections refer to Data Connectors
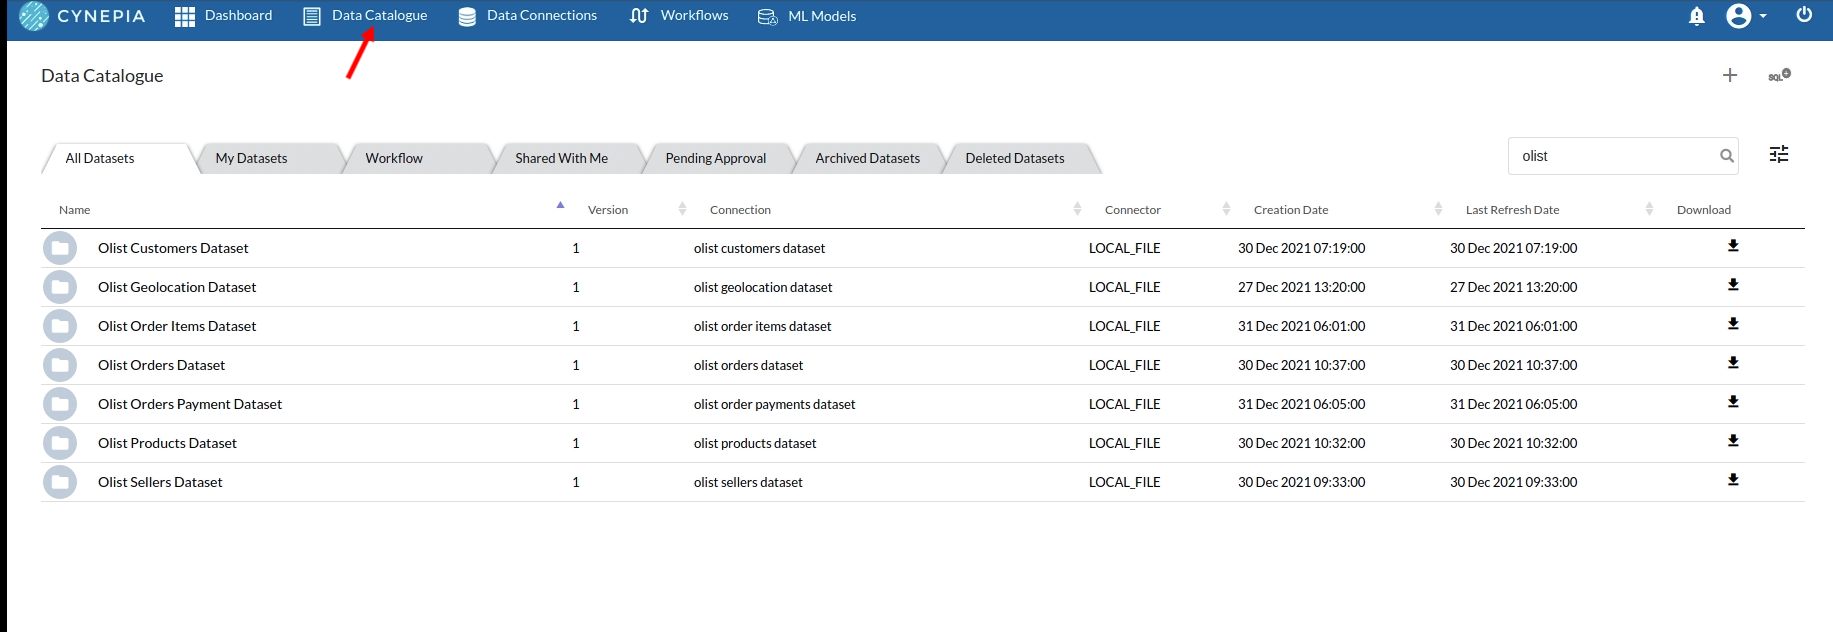
- Create a dataset for each dataset from the uploaded datasource in the data catalogue. Refer to Data Catalogue for more information on how to generate a dataset.
Create the Workflow for the experiment
- Lets Create our Workflow by going to the Workflows Tab in the Navigation. Create Workflow has more information on how to create a workflow.
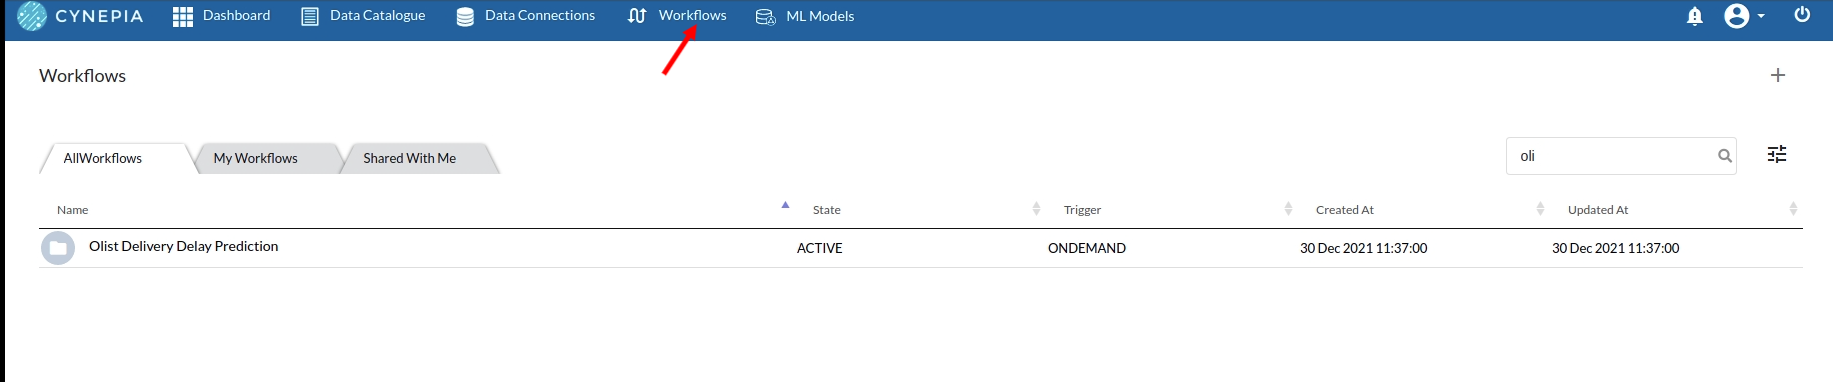
- you will see an entry on the workflow's page listing the workflow section once it's been created.
- To navigate to the workflow Details Page, double-click on the Workflow List Item and then click Design Workflow. Visit the Workflow Designer Main Page for additional information.
- By clicking on + icon you can add the Input Dataset to the step view. The input step will be added to the Step View.
Perform initial exploration of data columns.
- Examine the output view with Header Profile, paying special attention to the column datatypes. Refer to Output Window,for more information about the output window.
- Column Statistics Tab (Refer to Column Statistics for more details on individual KPI)
Perform Cleanup and Transform Operations
- Before we can build our model, we need to perform a few cleanup modifications. Some of the important operations include:
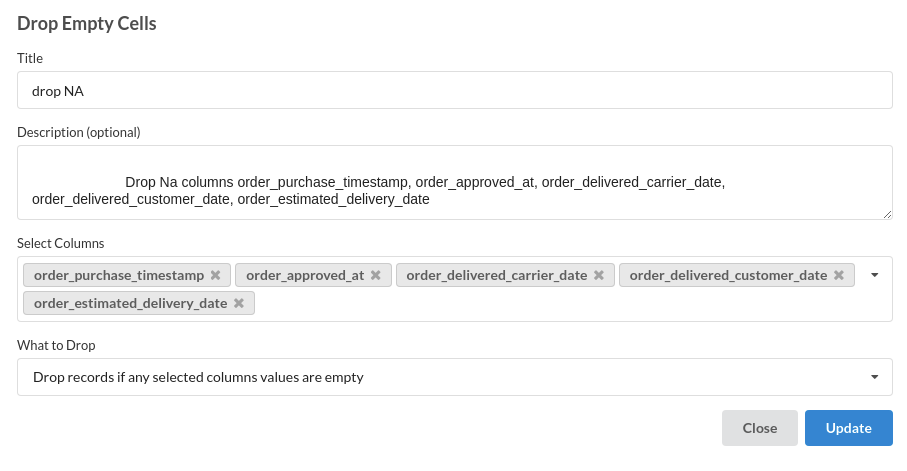
- Clean the individual datsets separately in separate recipes.
- For example : Under Orders dataset, drop null values
- Filter by delivered orders
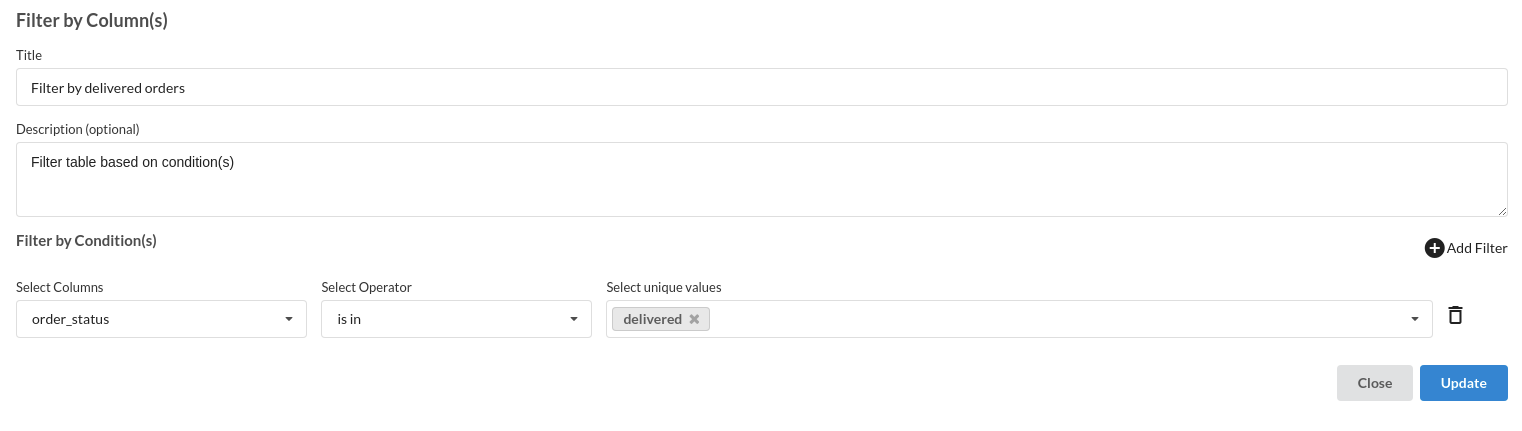
refer Filter records
- Adding some computed columns based on datetime
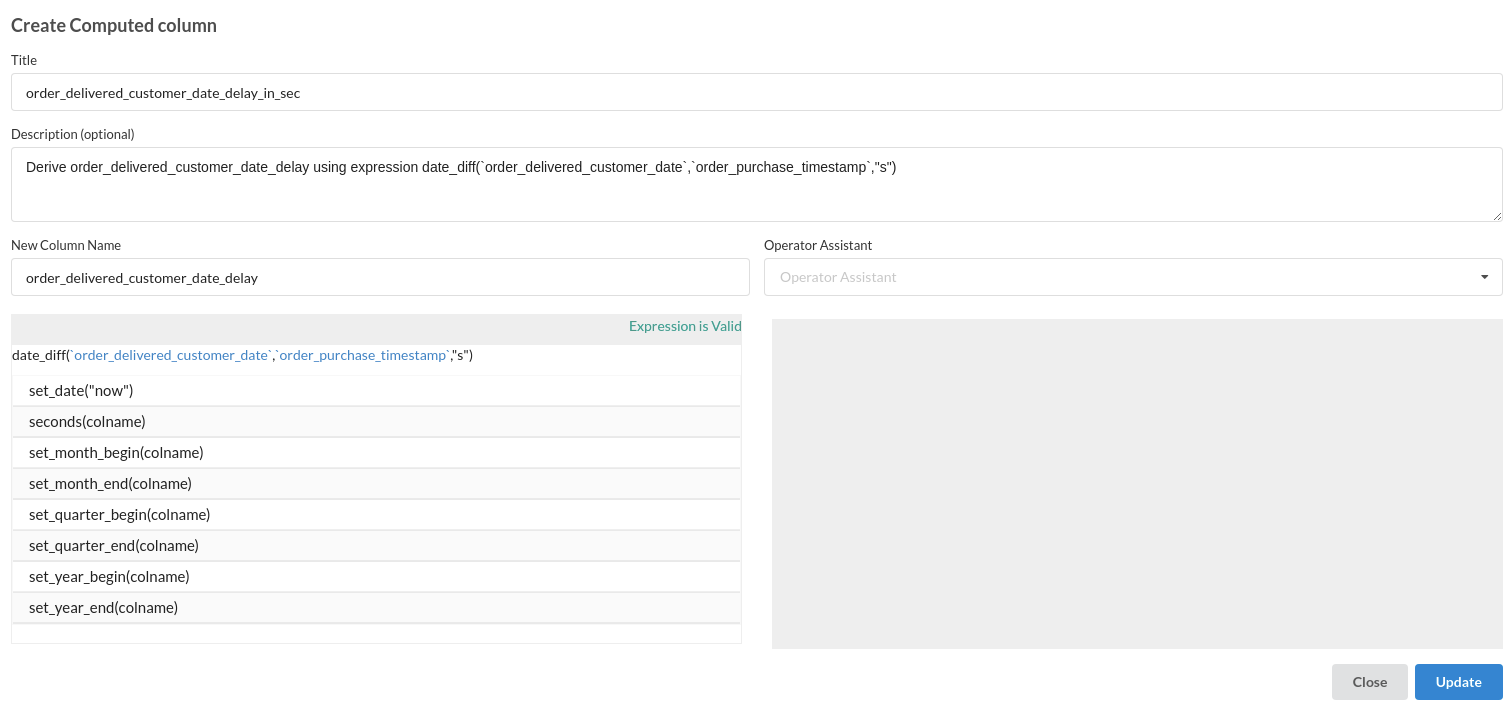

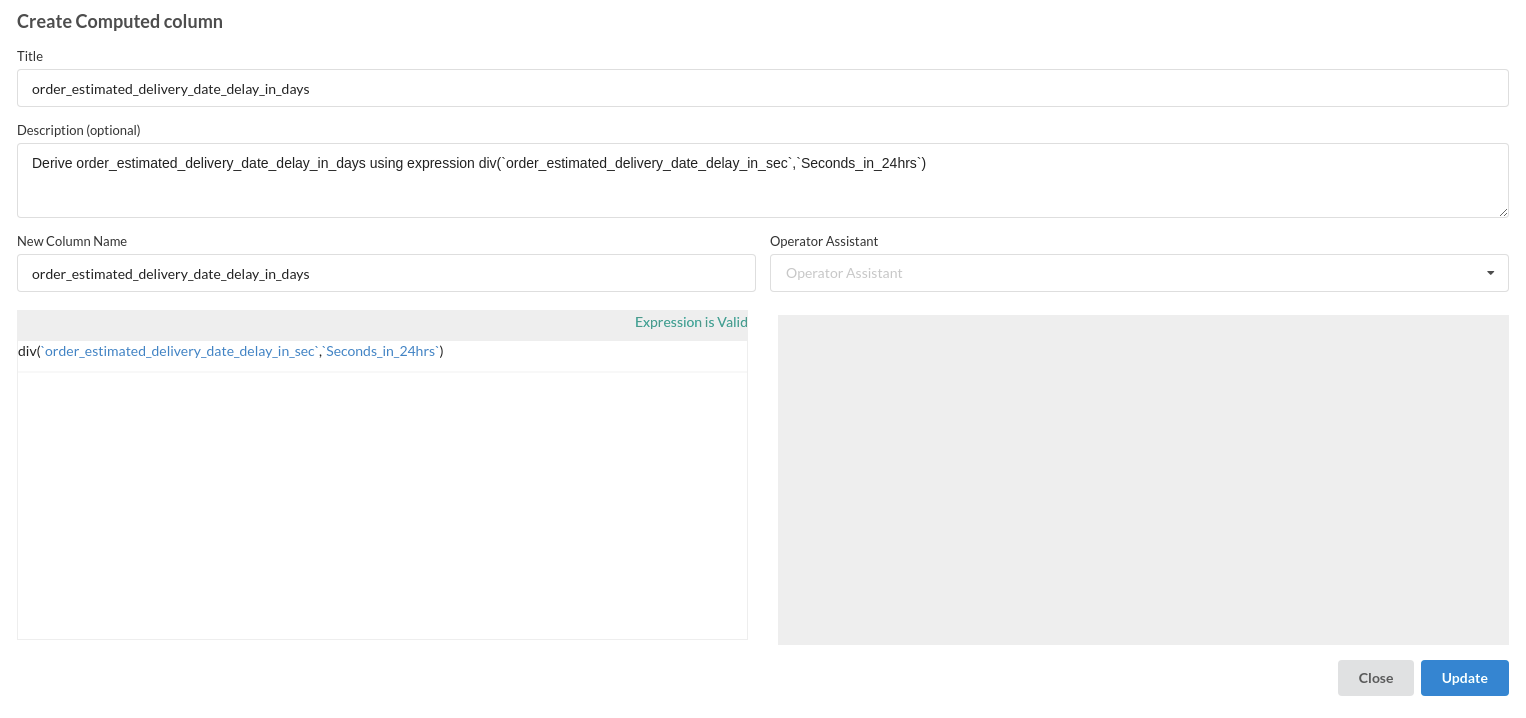
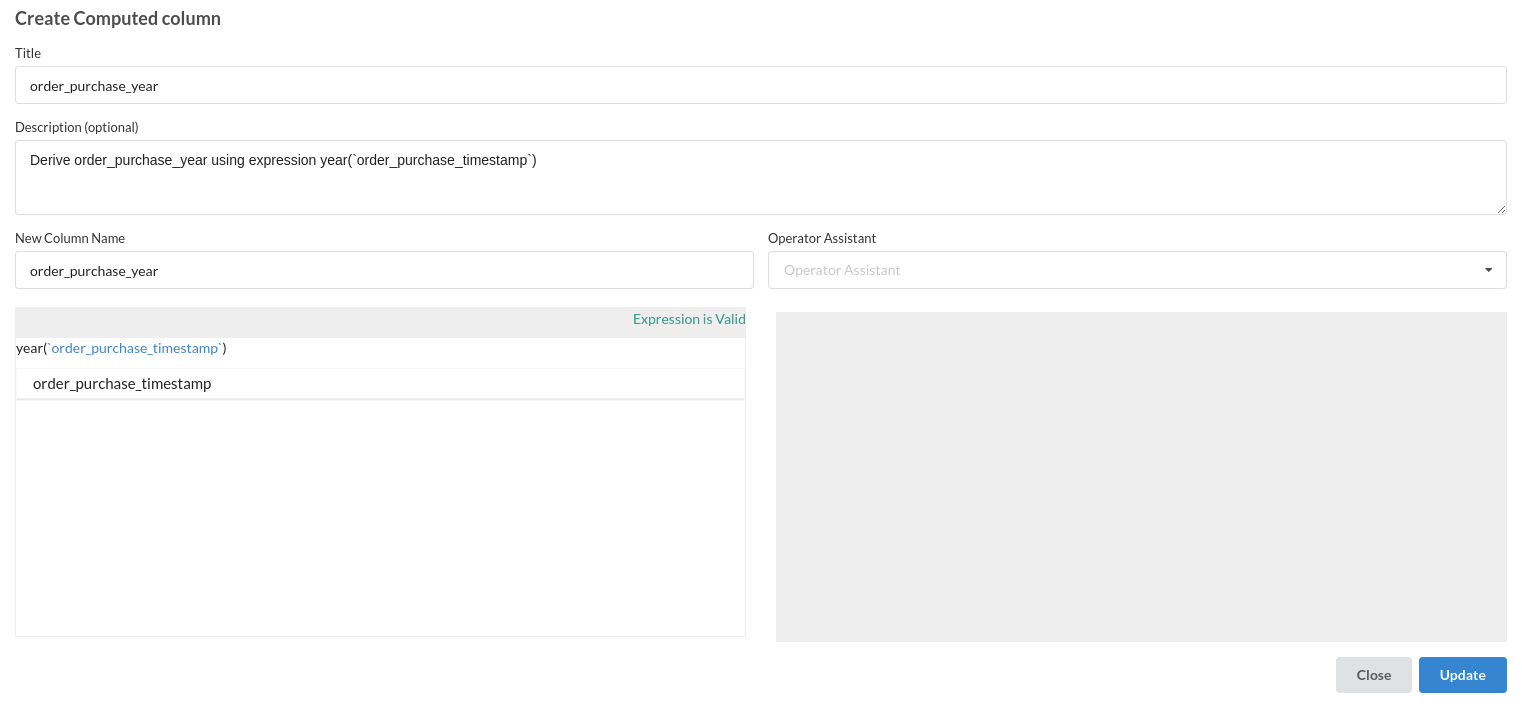
refer Calculate
- In the final recipe, perform the final join operation
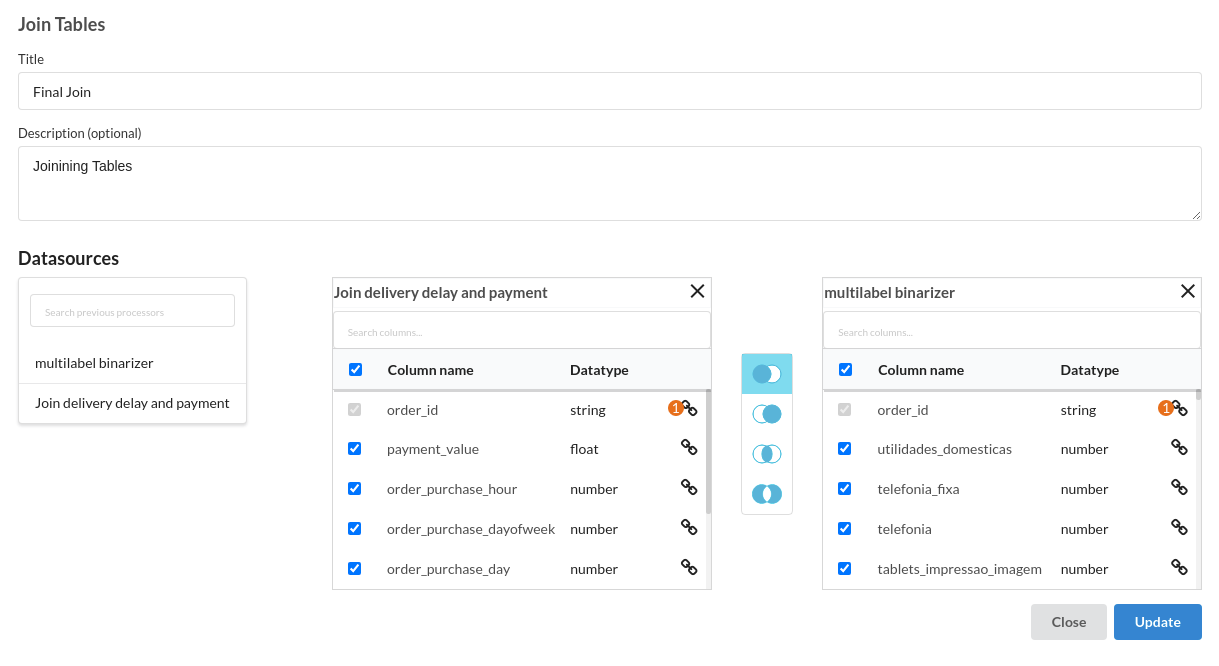
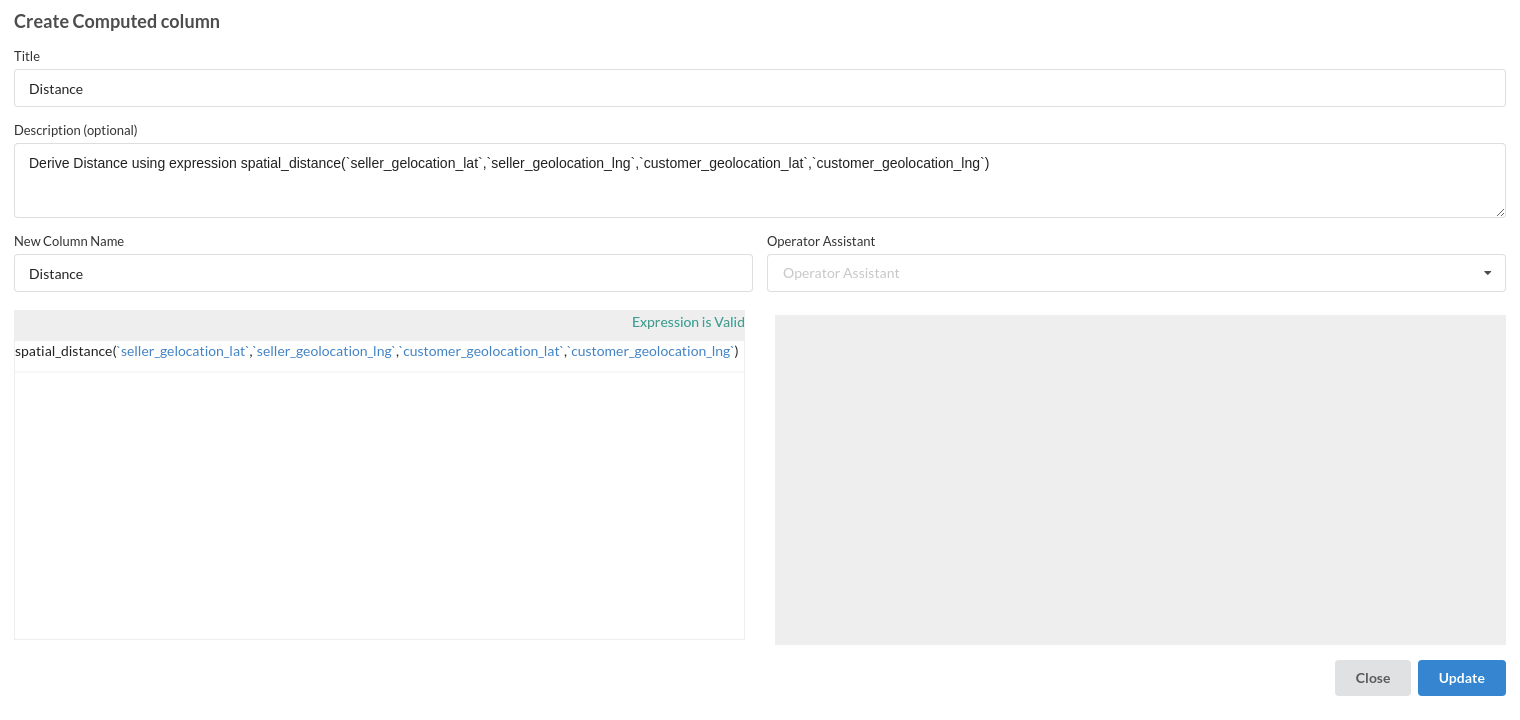
- Compute the distance between the buyer and seller
- Compute sin and cos of all datetime columns

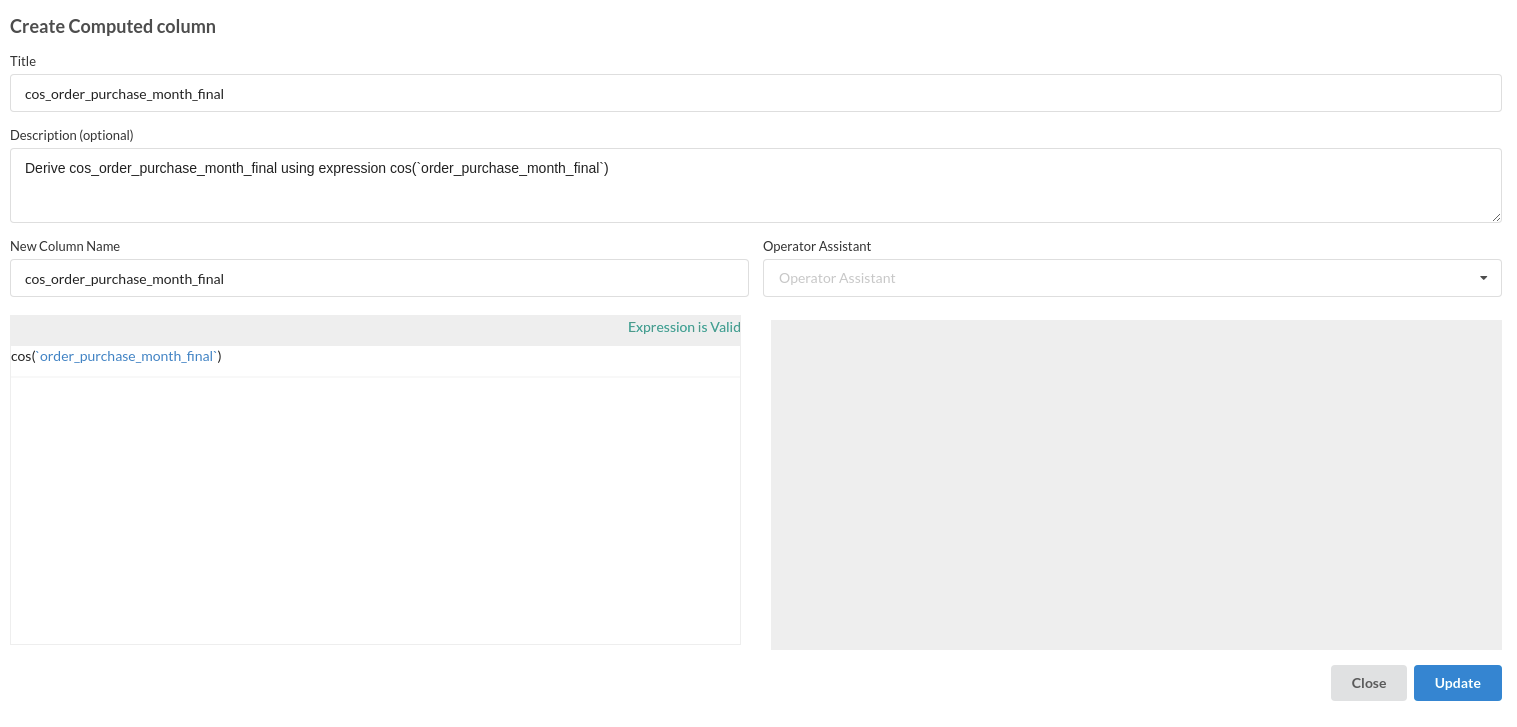
All of th arithmetic based operations are under Expression
Build/Train a regression Model
- We now have a dataset to work with in order to create our regression model. Some of the actions we take before developing a model are listed below. 1.Feature Selection 2.Feature Encoding 3.Choose the algorithm and train the model.
1.Feature Selection
- Go to the Column Profile View and select Multi-variate profile to construct a correlation matrix to manually identify the features of interest. The peason correlation is shown by Xceed Analytics. Select all of the columns that are strongly correlating to the target feature.
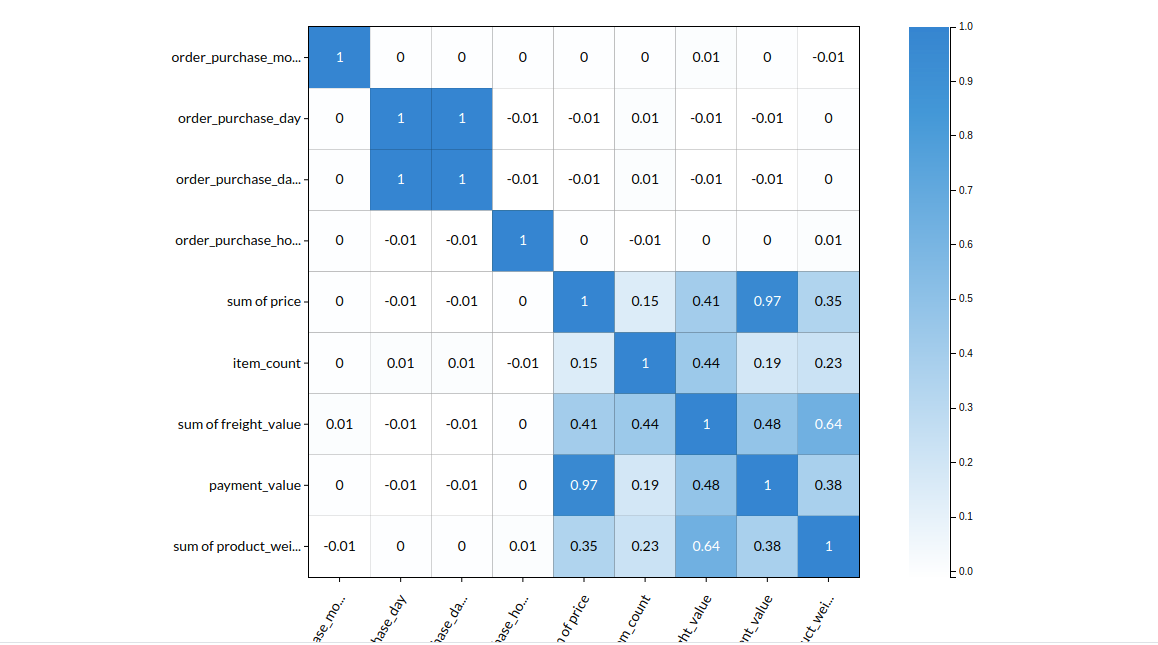
- Some of the features we chose that can explain our target variable based on the observed correlation are:
Day
Month
Year
Price
Item count Freight value. etc
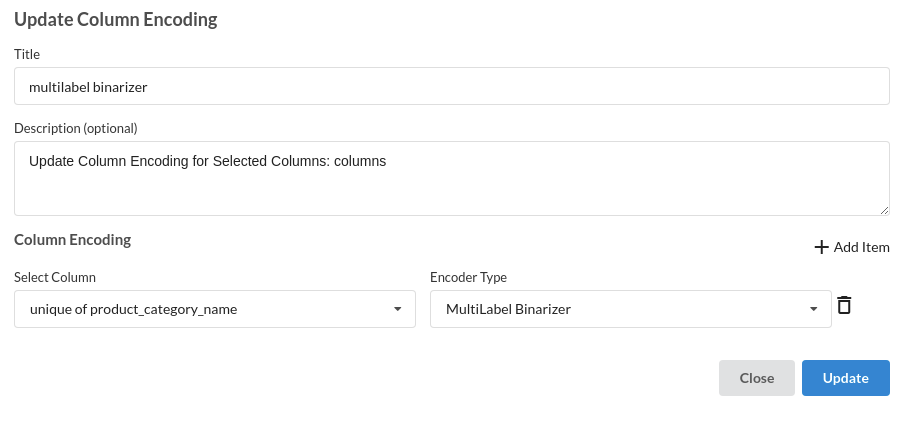
2.Feature Encoding
- Take all of the categorical columns and encode them based on the frequency with which they occur.Here, multilabel binarizer is used.
3.Choose the algorithm and train the model.
- Because we're estimating a continuous variable- delivery delay for the prediction model. From the Transformer View, select Regression(auto pilot) and put in the relevant information. Refer to Regression for more information on model parameters (autopilot)
Review the model output and Evaluate the model
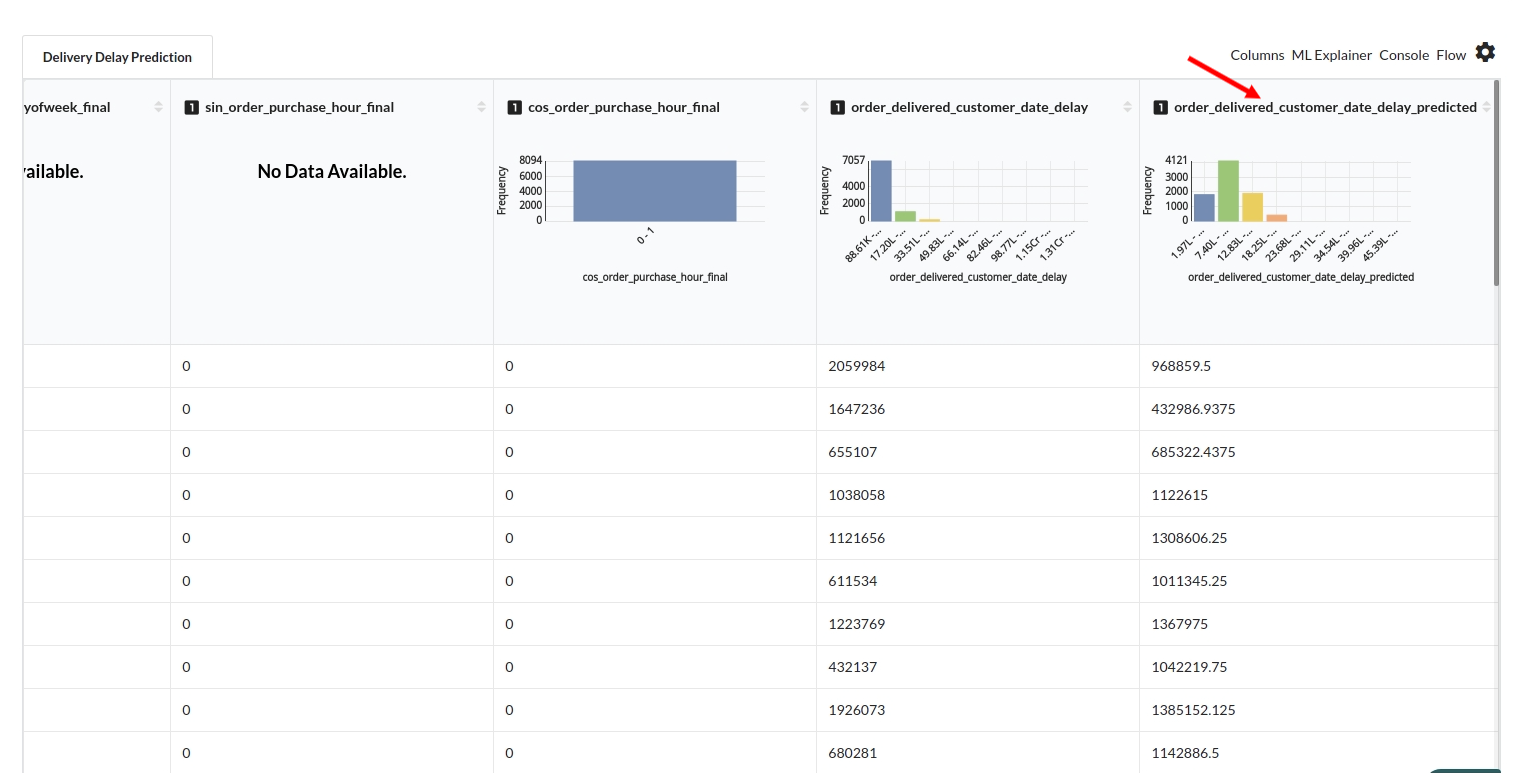
After you finish building the model, it is time to review the model output. Look at the output window to first review your predicted results .Since this is a regression problem you will get a new column in the view like the one below.
When you finish building your model you will see another tab in the view called Ml explainer . Click on that to evaluate your model.
- The first view you see when you click on ML explainer is the Summary view
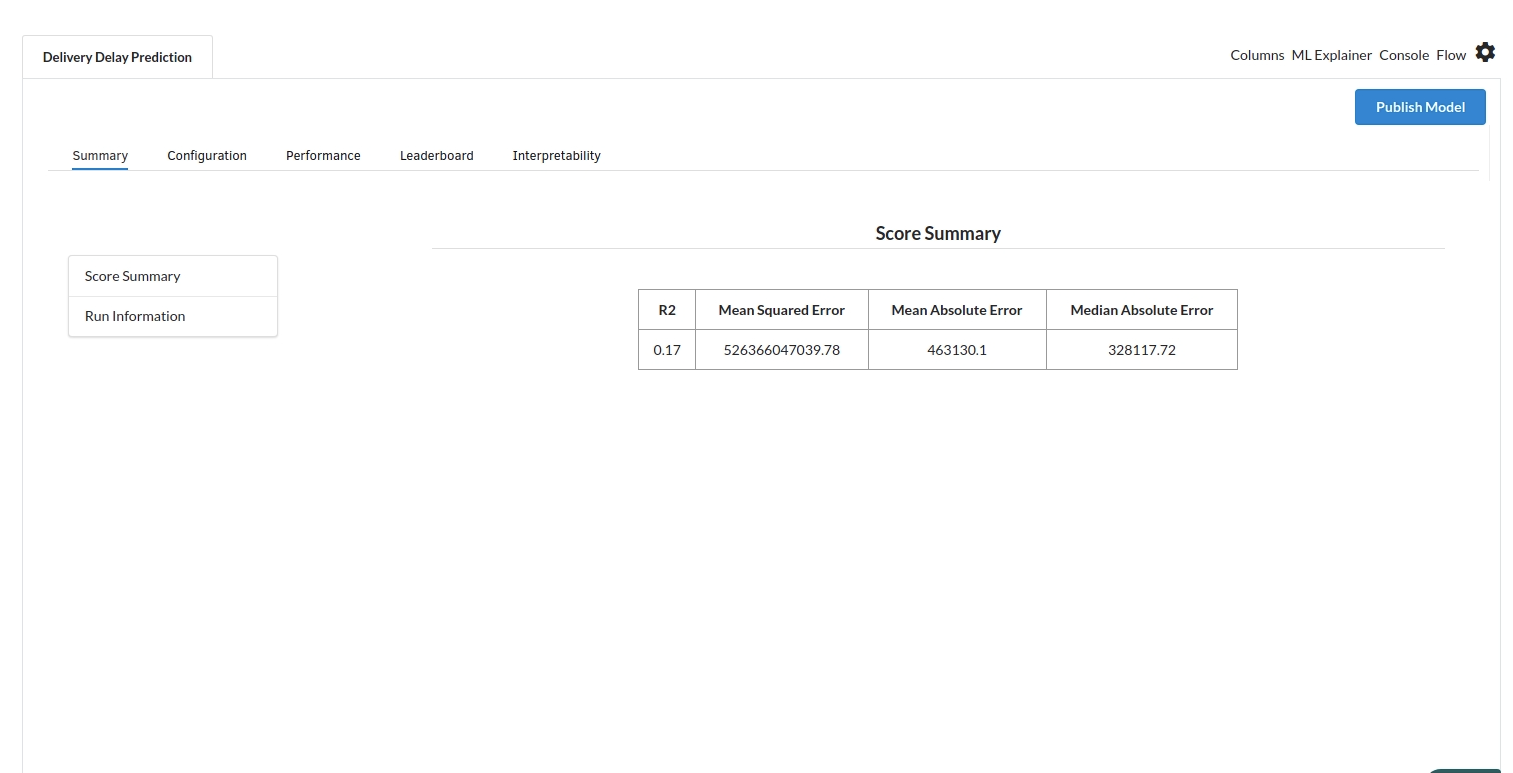
Look at the metrics score and the Run summary stats. Based on your calculations decide if the R2, mean Sqaured Error and Mean Absolute Error are according to your expecation. if not this will be your first step to rethink the training process.
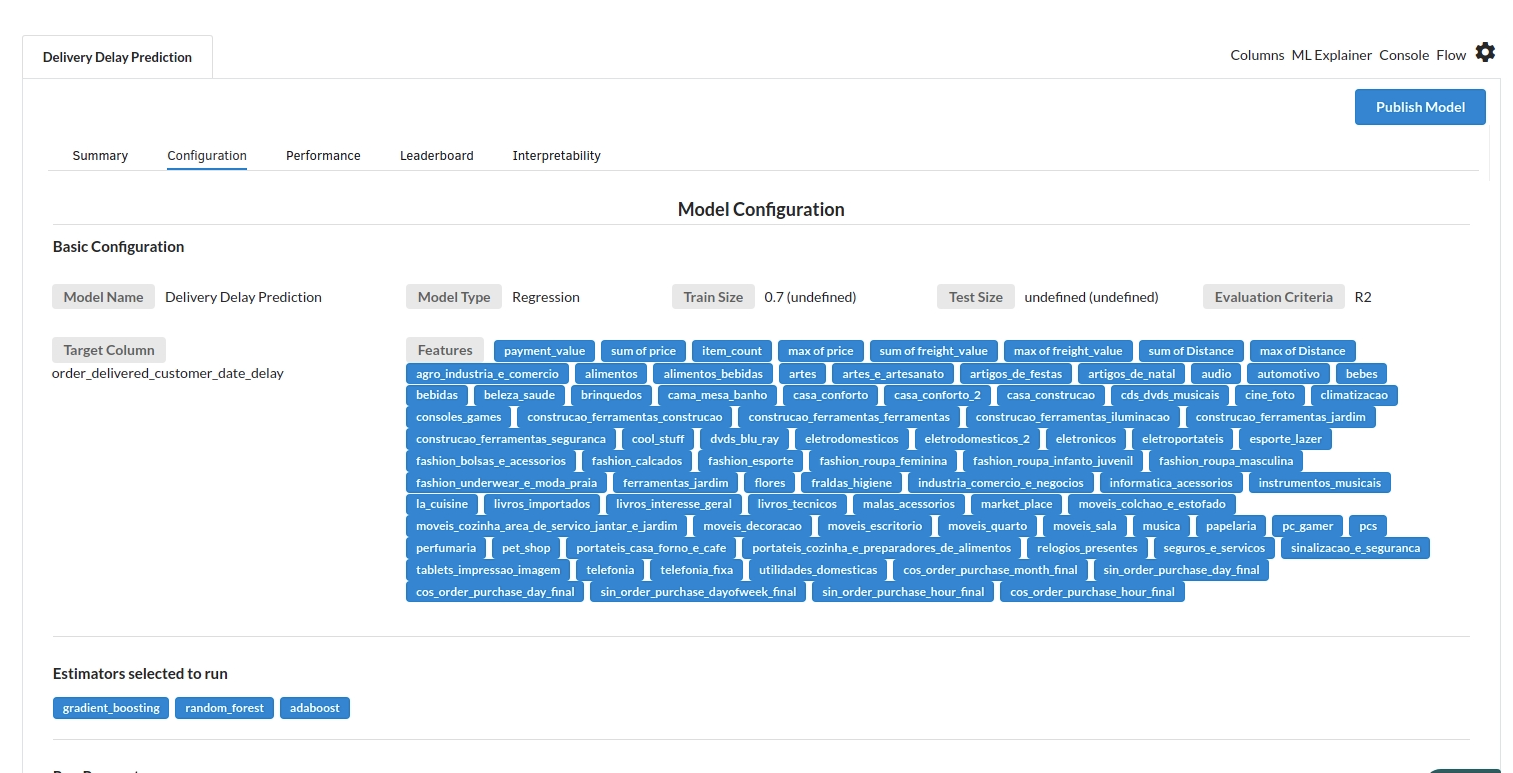
- The second view under Ml explainer is configuration view
The configuration view will give you the information about the step you filled in the Regression step . The view would look like the one below.
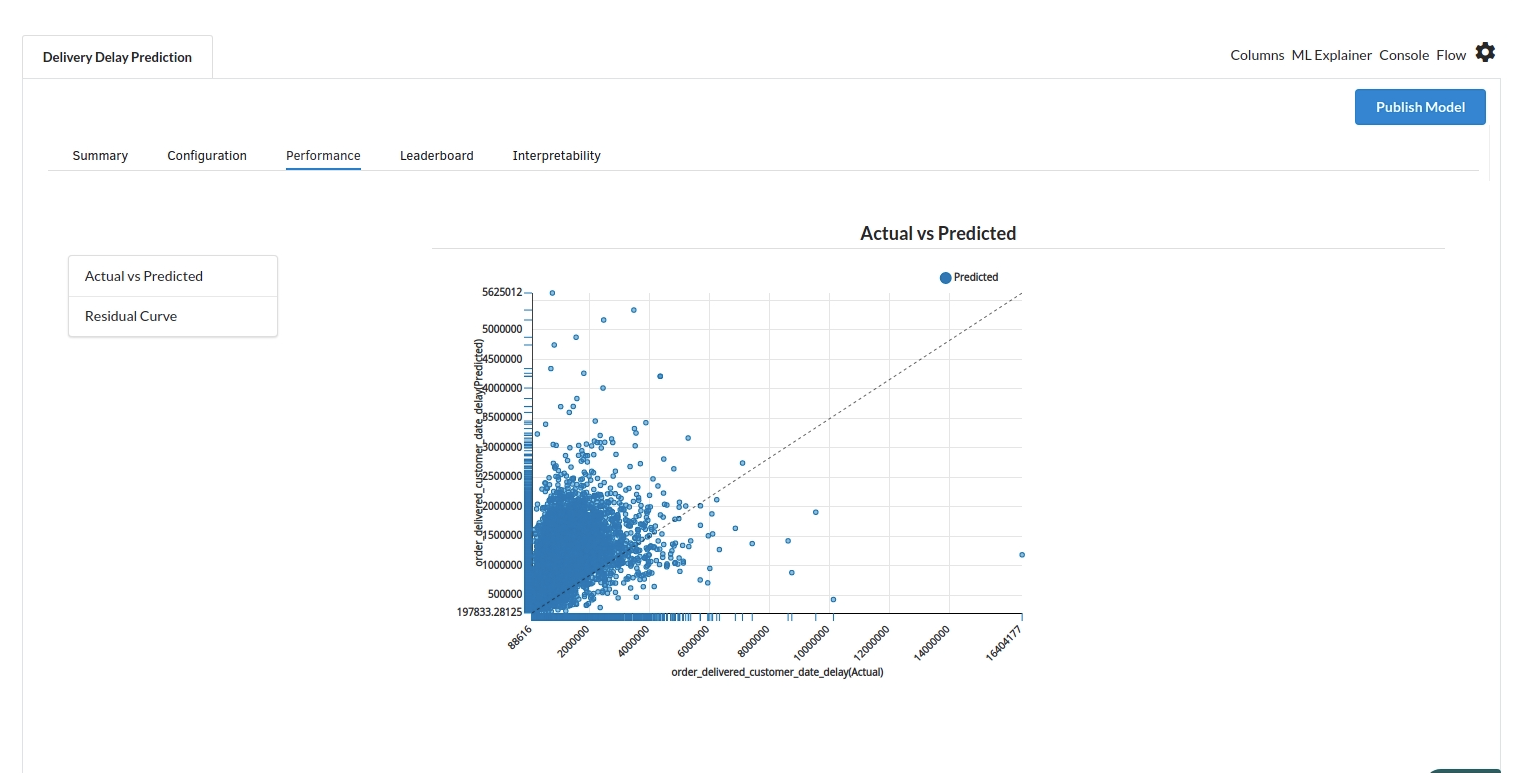
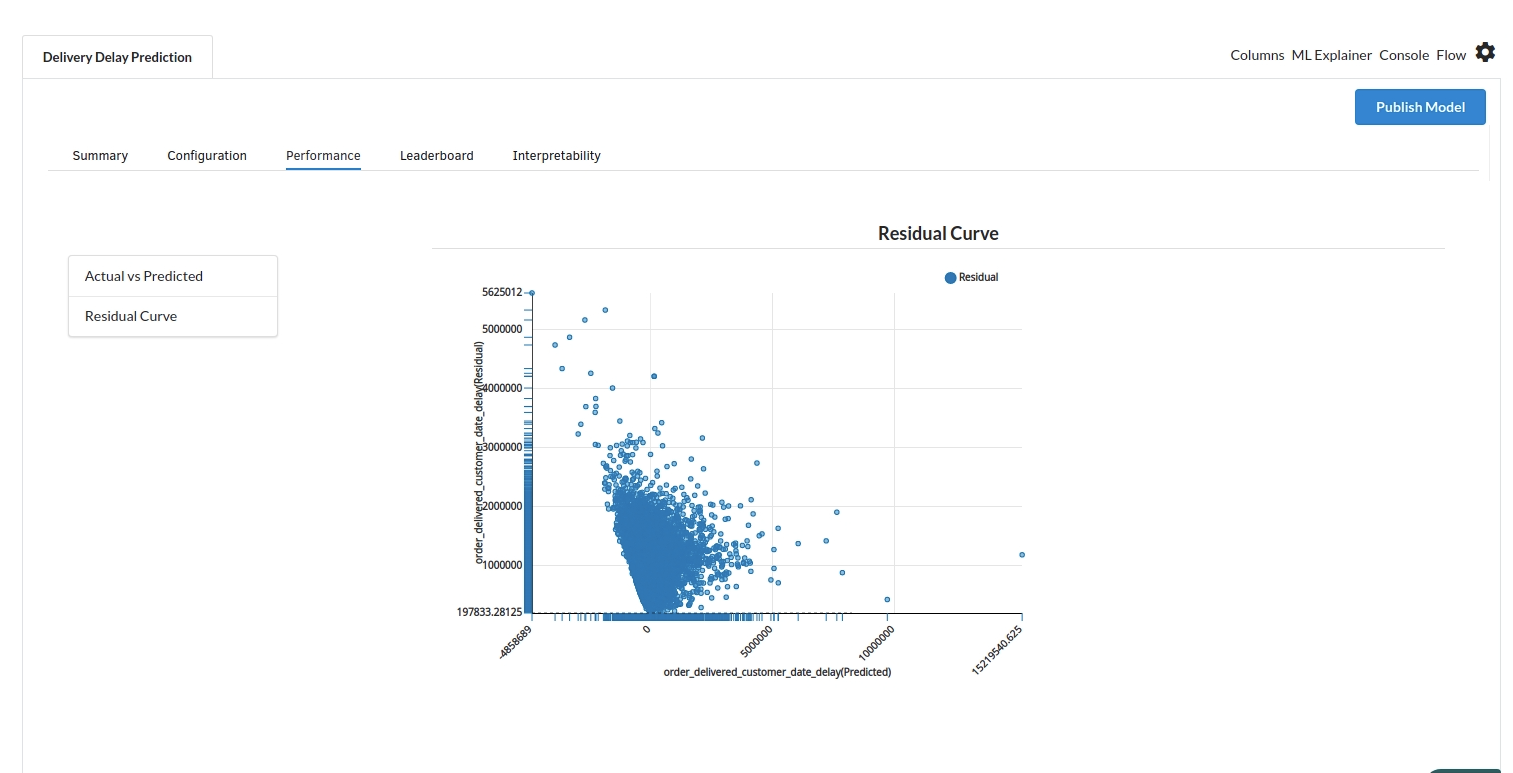
- The third view under Ml explainer is Performance View . You can see the actual vs predicted and the residual curve charts for regression. Look at the built charts and decide if the charts are good enough for your model. The actual vs predicted chart is a good indicator to understand how well your model was trained .
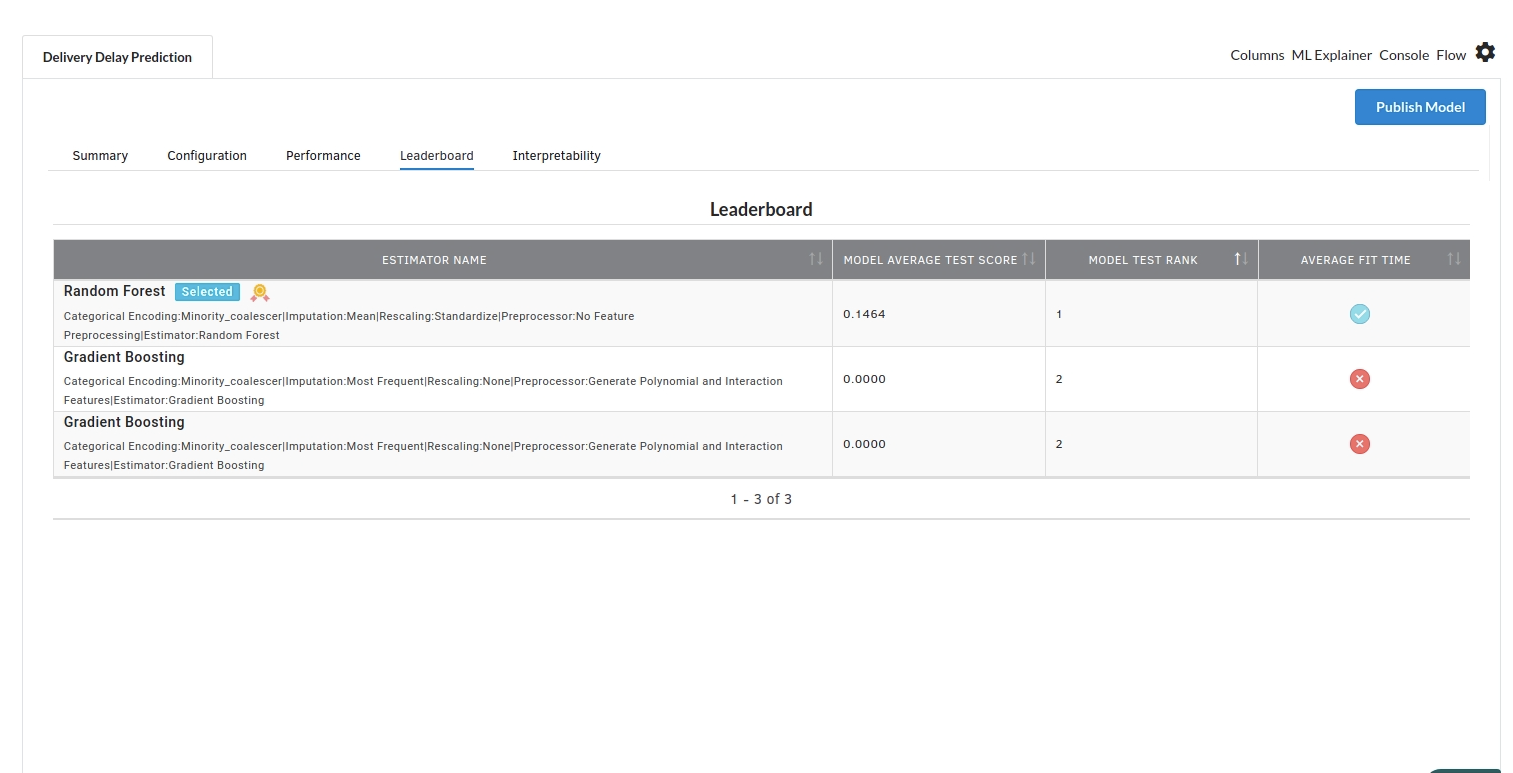
- The fourth view under Ml explainer is Leaderboard . In this view you can see the number of algorithms trained and all the feature engineering done on the algorithms used with ranking system to rank the best algorithm trained.
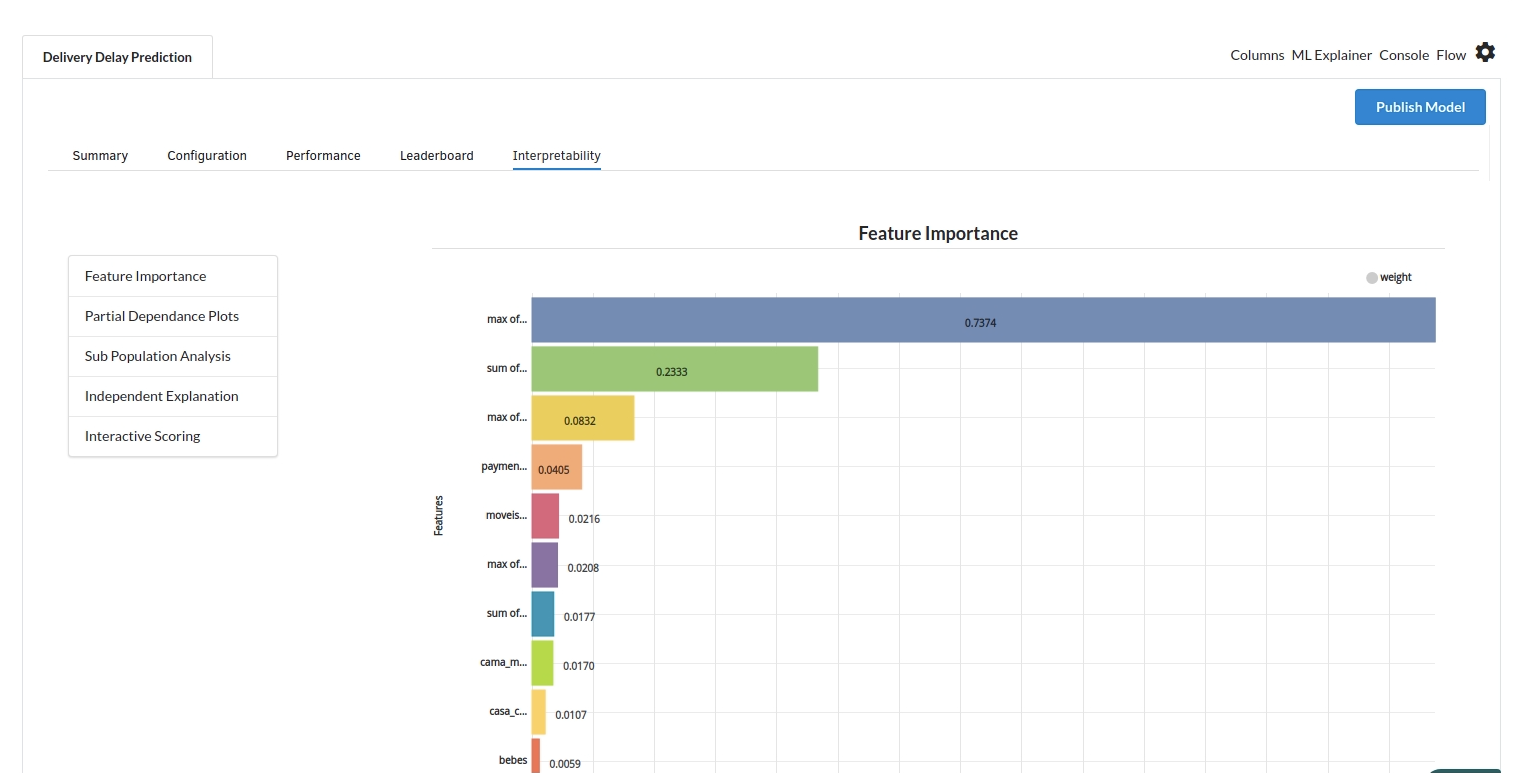
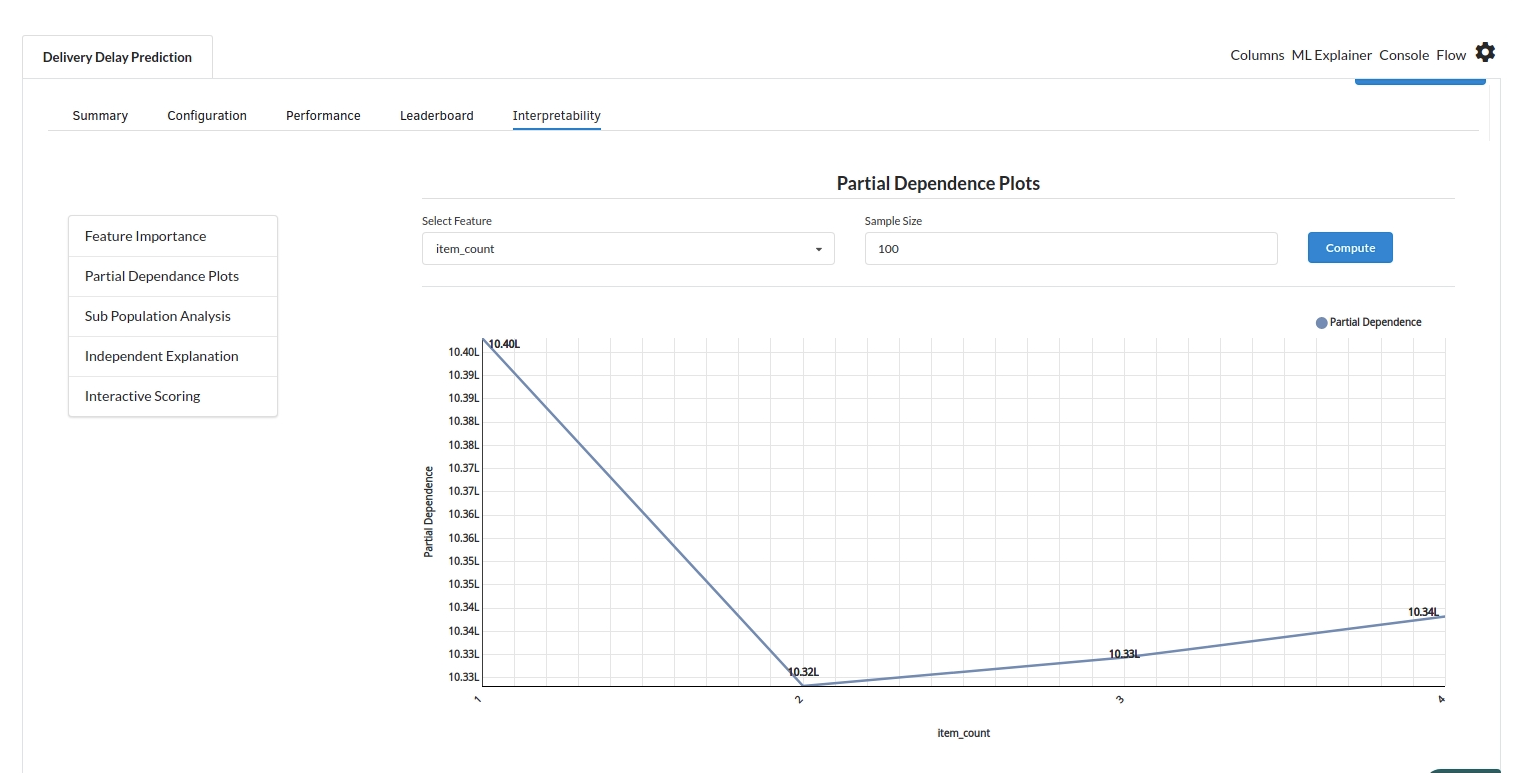
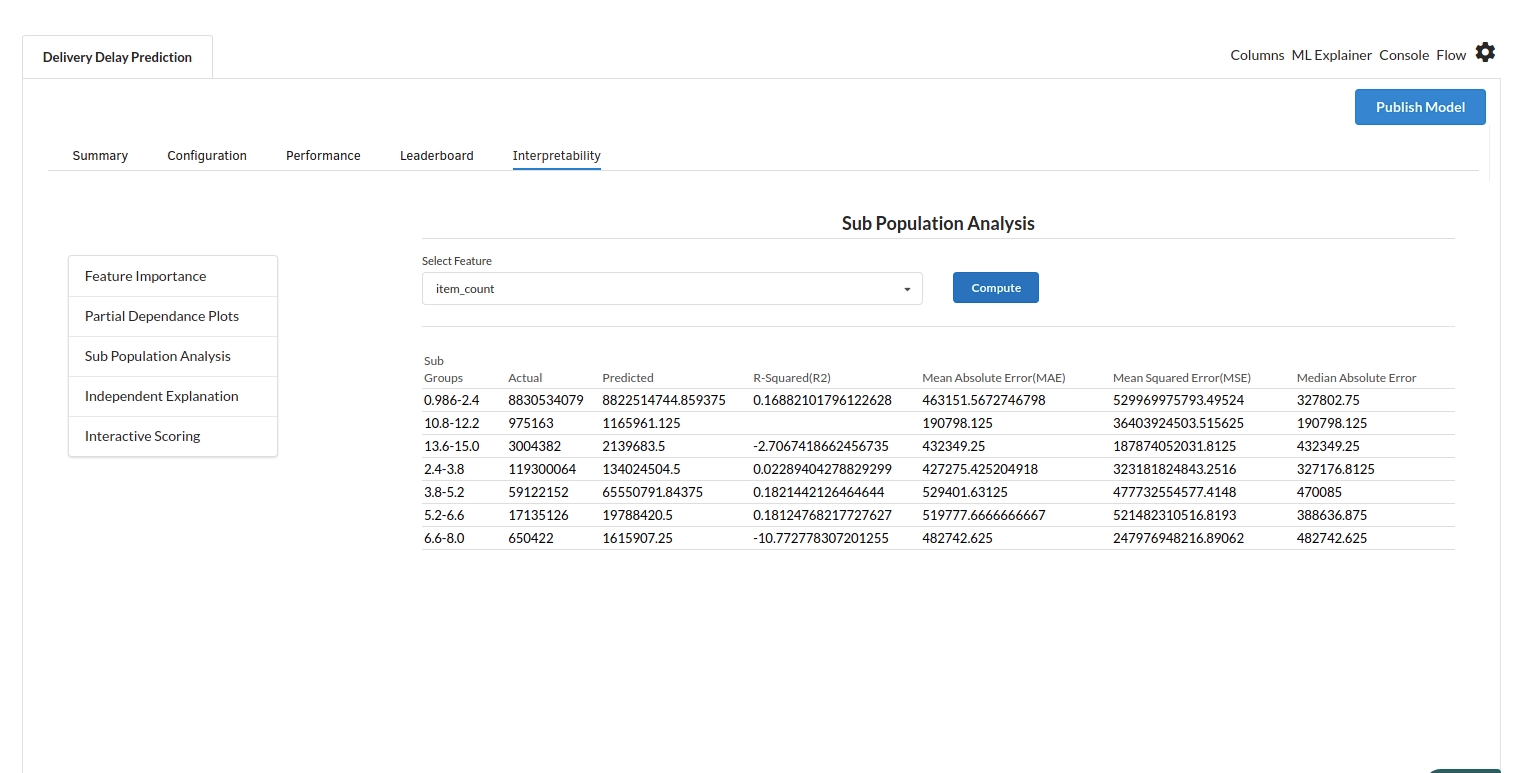
- The last view you see under ML explainer is Interpretability . In this view you will be able to interpret your model in simple terms where you will be getting results pertaining to feature importance , PDP Plots , Sub Population Analysis , Independant Explanation , Interactive Scoring . for more infomation on these results , refer to Interpretability . The Interpretability tab and the results under this tab would look like the one below.