Bike Sharing Demand

Background
Shared economy is a highly flexible economic model in which goods and services are offered, bought, or shared between private individuals — essentially a peer-to-peer (P2P) model. People have shared assets for thousands of years, but with the advent of technology and the utilization of big data, asset owners and people seeking those assets can now discover one other more easily. Simply explained, sharing economies enable individuals and organisations to profit from their underutilized or idle assets by renting them out.
The concept of a shared economy has quickly acquired momentum in today's world. As a result, an increasing number of people are switching from the old system to one that allows for the sharing of resources, information, ideas, and services, allowing for more collaboration.Individuals, peers, and small enterprises can share office space, services, resources, and skills in this new economic structure at a fraction of the cost of the existing system.The sharing economy enables us to add more value to the assets we already possess while also facilitating and frequently lowering the cost of accessing the assets we require. The sharing economy has disrupted a wide range of businesses, so we should expect to see a growing number of success stories.However there are various challenges involved. The major ones being balancing between the available supply and demand, affordability and regulatory supervision.
A bike sharing program is a type of shared transportation service in which bicycle are made available for short-term rental to individuals for a fee.
Benefits of Bike Sharing
- Transportation flexibility,
- lower vehicle emissions,
- environmental impact
- health benefits,
- reduced traffic
- reduced fuel consumption
- financial savings for people
Objective
This use case helps predict bike sharing demand. These predictions can be used to establish the ideal demand based on a variety of parameters that might help the operator address the demand and supply dilemma, such as where to build new stations or expand existing ones. They must also figure out how to keep a sufficient number of bicycles in stock.
Relevance of Xceed
Xceed Analytics provides a single integrated data and AI platform that reduces friction in bring data and building machine models rapidly. It further empowers everyone including Citizen Data Engineers/Scientist to bring data together and build and delivery data and ml usecases rapidly. It's Low code/No code visual designer and model builder can be leveraged to bridge the gap and expand the availability of key data science and engineering skills.
This usecase showcases how to create, train/test, and deploy a bike sharing demand regression model. UCI was used to obtain the dataset. Xceed will provide a NO-CODE smooth environment for the end-to-end implementation of this project, starting with the uploading of dataset from source to the deployment of the model at the end point. From data analysis to model construction and deployment, all of these phases are handled with care.
As mentioned earlier, we will use NO-CODE environment for the end-to-end implementation of this project. All of these steps are built using Visual Workflow Designer, from analyzing the data to constructing a model and deploying it.
Data Requirements
This dataset was obtained from UCI Machine leaarning repository and comprises the hourly and daily counts of rental bikes in the Capital bikeshare system from 2011 to 2012, together with weather and seasonal data.
Columns include :
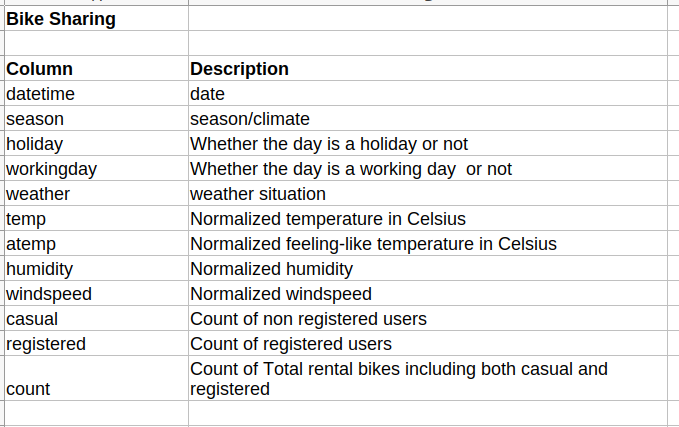
Model Objective:
Understanding the data's trends and estimating the total count of rental bikes, both casual and registered, by analyzing the underlying various factors such as such as seasons, months, days of the week, peak timings, working and non-working days, temperature, humidity, building a regression ML model, and deploying it after determining what the model's significant features were, is the expected outcome of this approach.
Steps followed to develop and deploy the model
- Upload the data to Xceed Analytics and create a dataset
- Create the Workflow for the experiment
- Perform initial exploration of data columns
- Perform Cleanup and Tranform operations
- Build/Train a regression Model
- Review the model output and Evaluate the model
- Improve on the metrics which will be useful for the productionizing
- Deploy/Publish the model
Upload the data to Xceed Analytics and Create the dataset
- From the Data Connections Page, upload the the dataset to Xceed Analytics. For more information on Data Connections refer to Data Connections
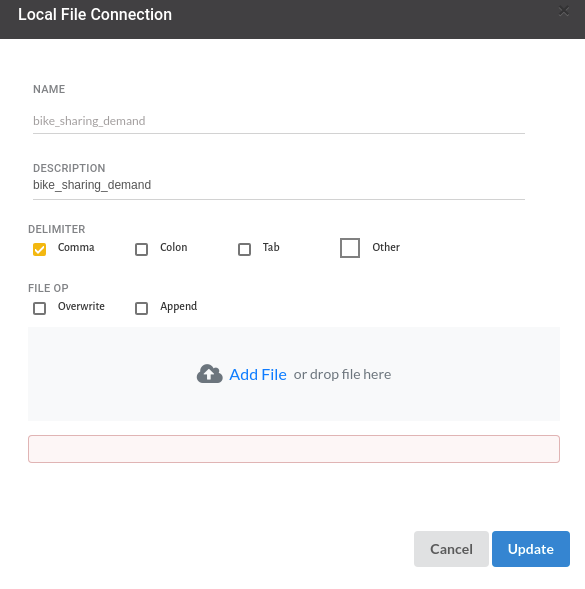
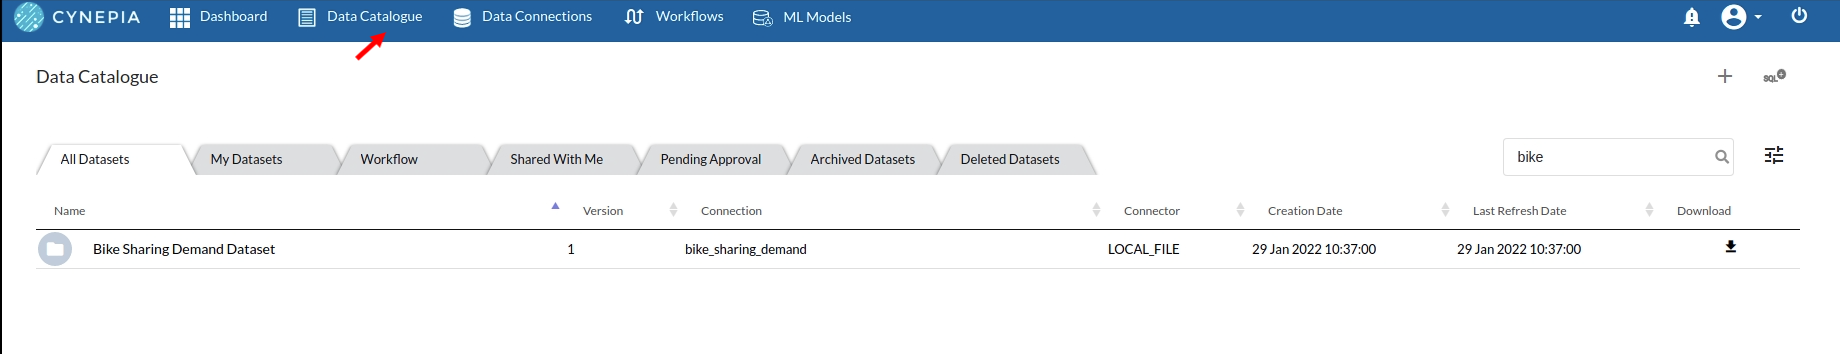
- Create a dataset for the dataset from the uploaded datasource in the data catalogue. Refer to Data Catalogue for more information on how to generate a dataset.
Create the Workflow for the experiment
- Lets Create our Workflow by going to the Workflows Tab in the Navigation. Create Workflow has more information on how to create a workflow.
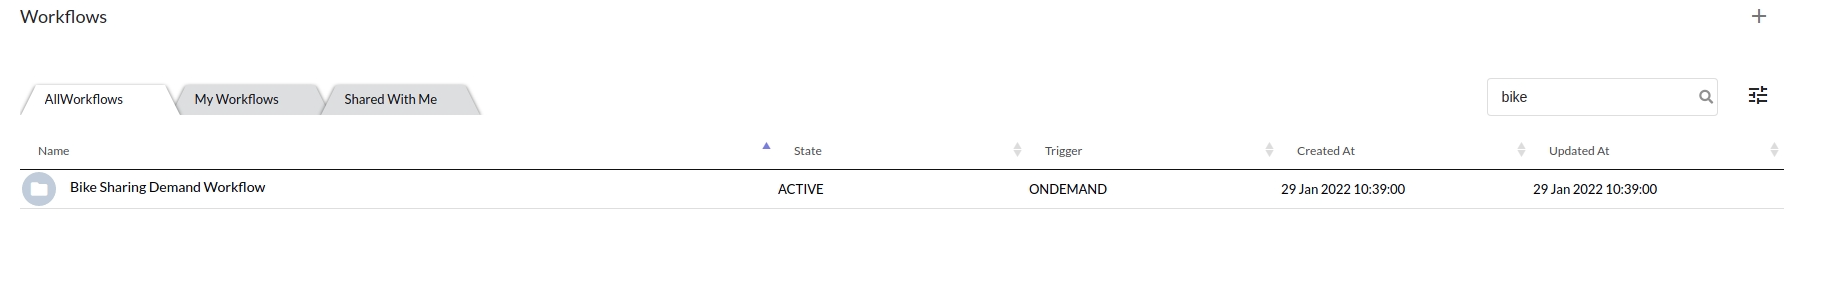
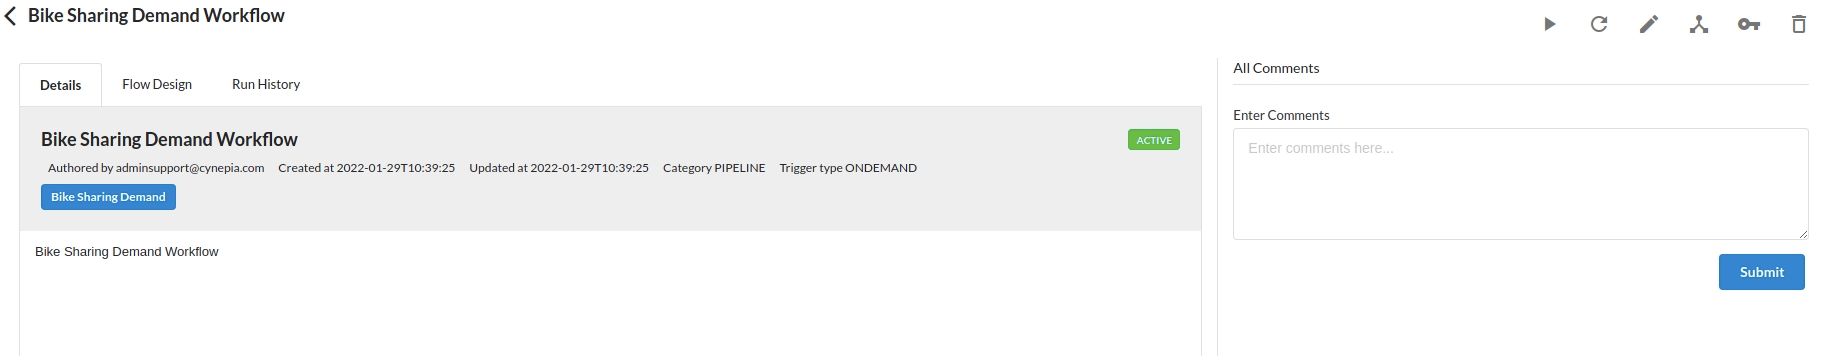
- We'll see an entry on the workflow's page listing our workflow once it's been created.To navigate to the workflow Details Page, double-click on the Workflow List Item and then click Design Workflow. Visit the Workflow Designer Main Page for additional information.By clicking on '+,' you can add the Input Dataset to the step view. The input step will be added to the Step View.
Perform initial exploration of data columns.
- Examine the output view with Header Profile, paying special attention to the column datatypes. Refer to Output Window for more information about the output window.
- Column Statistics Tab (Refer to Column Statistics for more details on individual KPI)
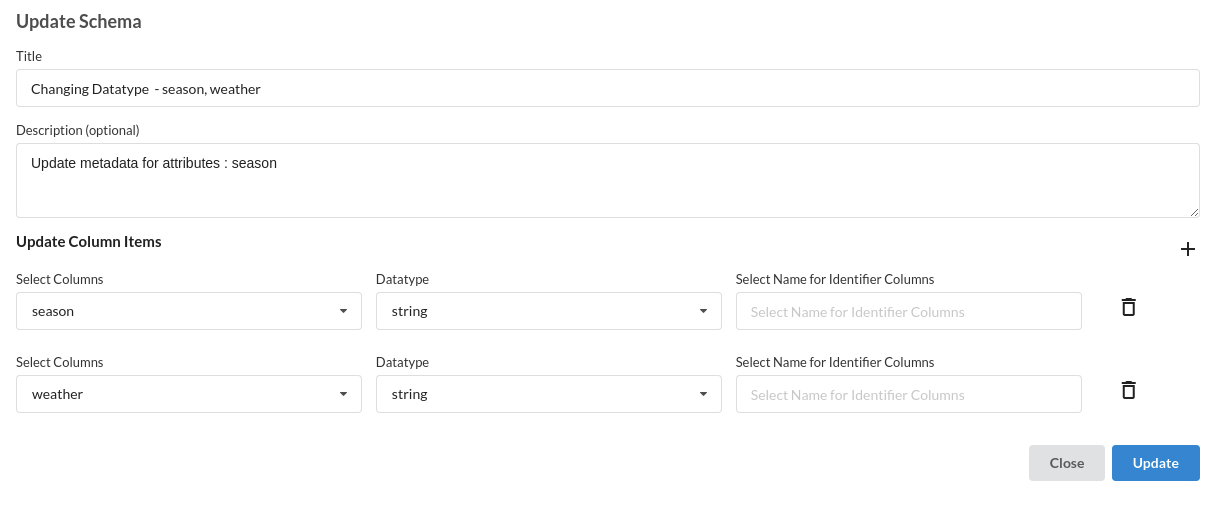
Perform Cleanup and Transform Operations
- Before we can build our model, we need to perform a few cleanup modifications.
- Updating the datatypes of weather and season column
Build/Train a regression Model�
- We now have a dataset to work with in order to create our regression model. Some of the actions we take before developing a model are listed below.
- Feature Selection
- Feature Encoding
- Choose the algorithm and train the model.
1. Feature Selection
- Go to the Column Profile View and select Multi-variate profile to construct a correlation matrix to manually identify the features of interest. The peason correlation is shown by Xceed Analytics. Select all of the columns that are strongly correlating to the target feature.
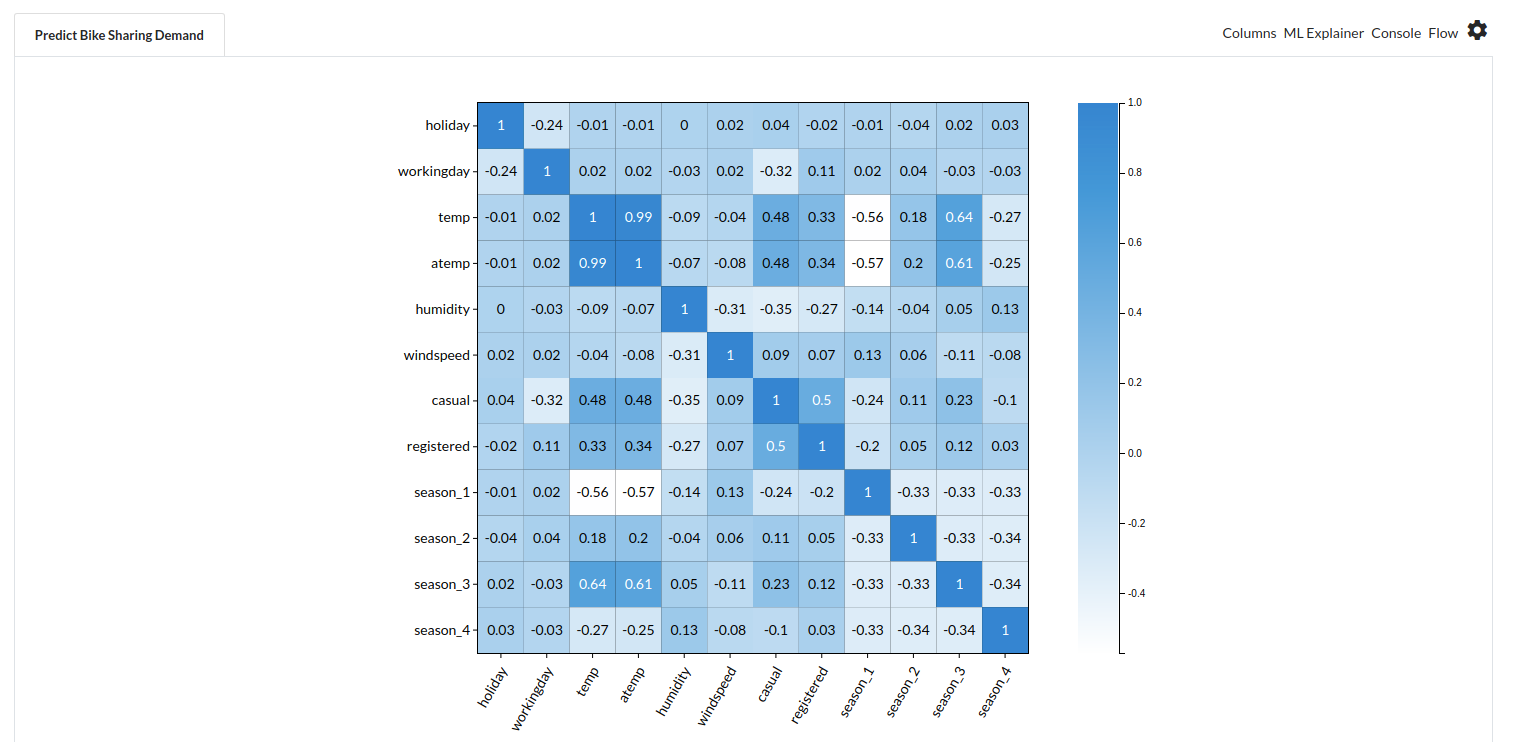
- Some of the features we chose that can explain our target variable based on the observed correlation are:
- holiday
- workingday
- temp
- windspeed
- humidity
- season etc
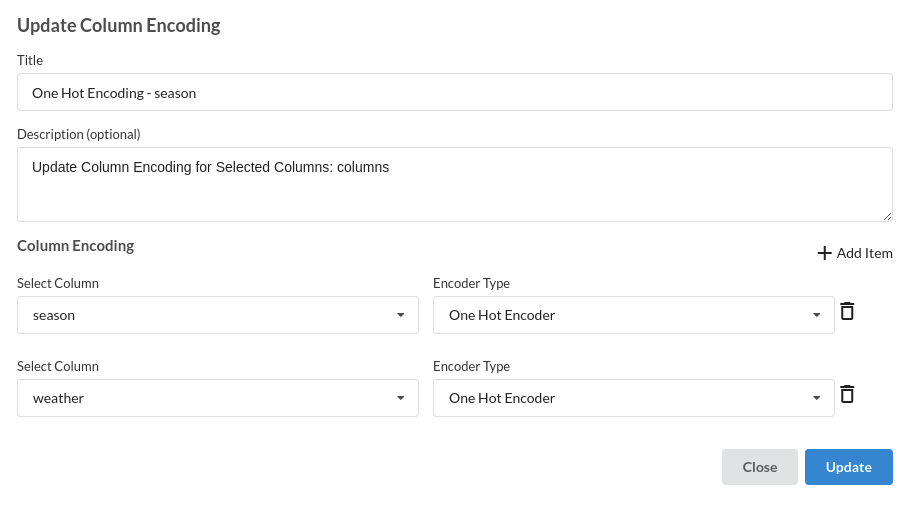
2. Feature Encoding
Take all of the categorical columns and encode them based on the frequency with which they occur.
3. Choose the algorithm and train the model.
- Because we're estimating a continuous variable- count for the prediction model, From the Transformer View select Regression(auto pilot) and put in the relevant information. Refer to Regression for more information on model parameters (autopilot)
Review the model output and Evaluate the model
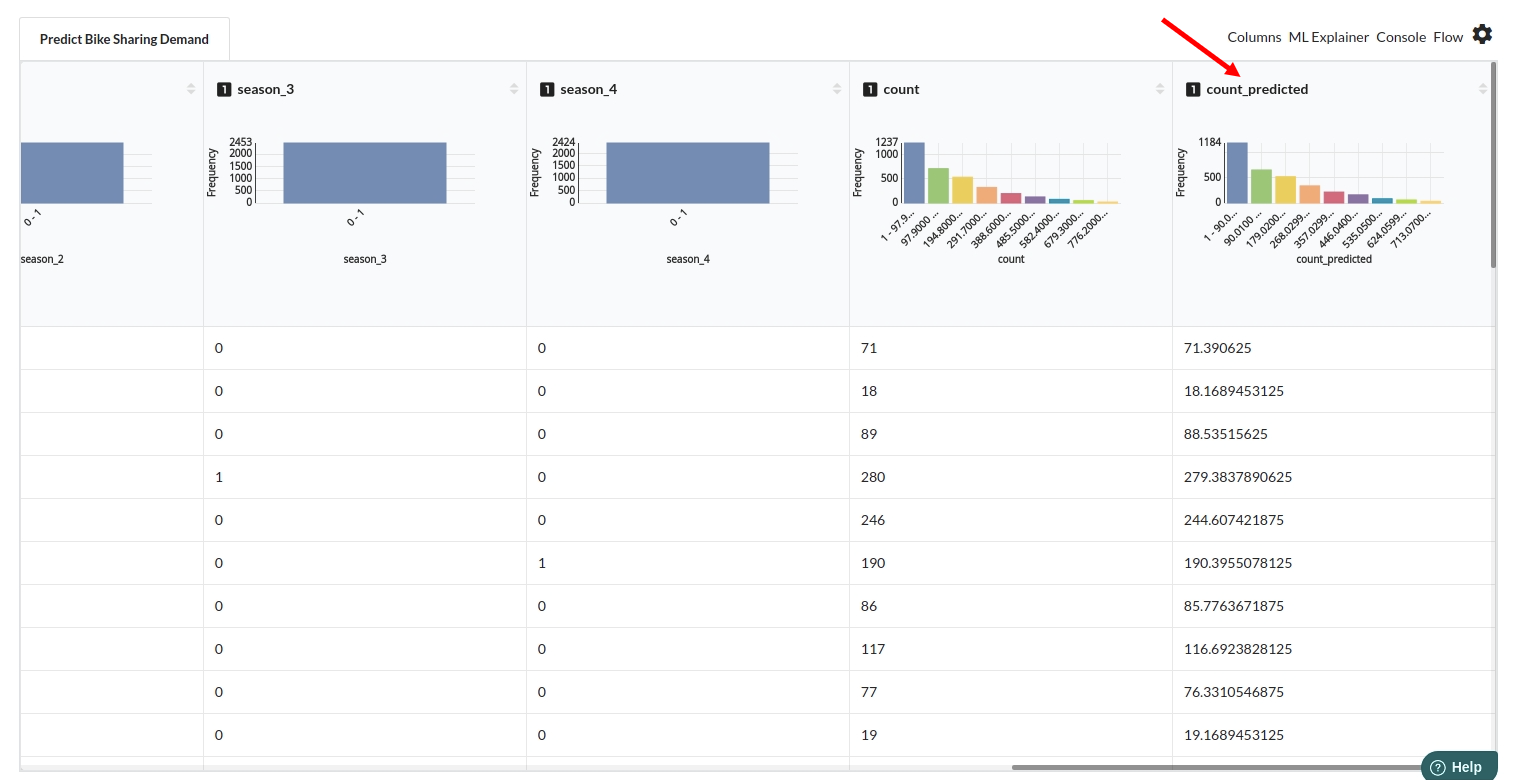
After you finish building the model, it is time to review the model output. Look at the output window to first review your predicted results .Since this is a regression problem you will get a new column in the view like the one below.
When you finish building your model you will see another tab in the view called Ml explainer . Click on that to evaluate your model.
- The first view you see when you click on ML explainer is the Summary view
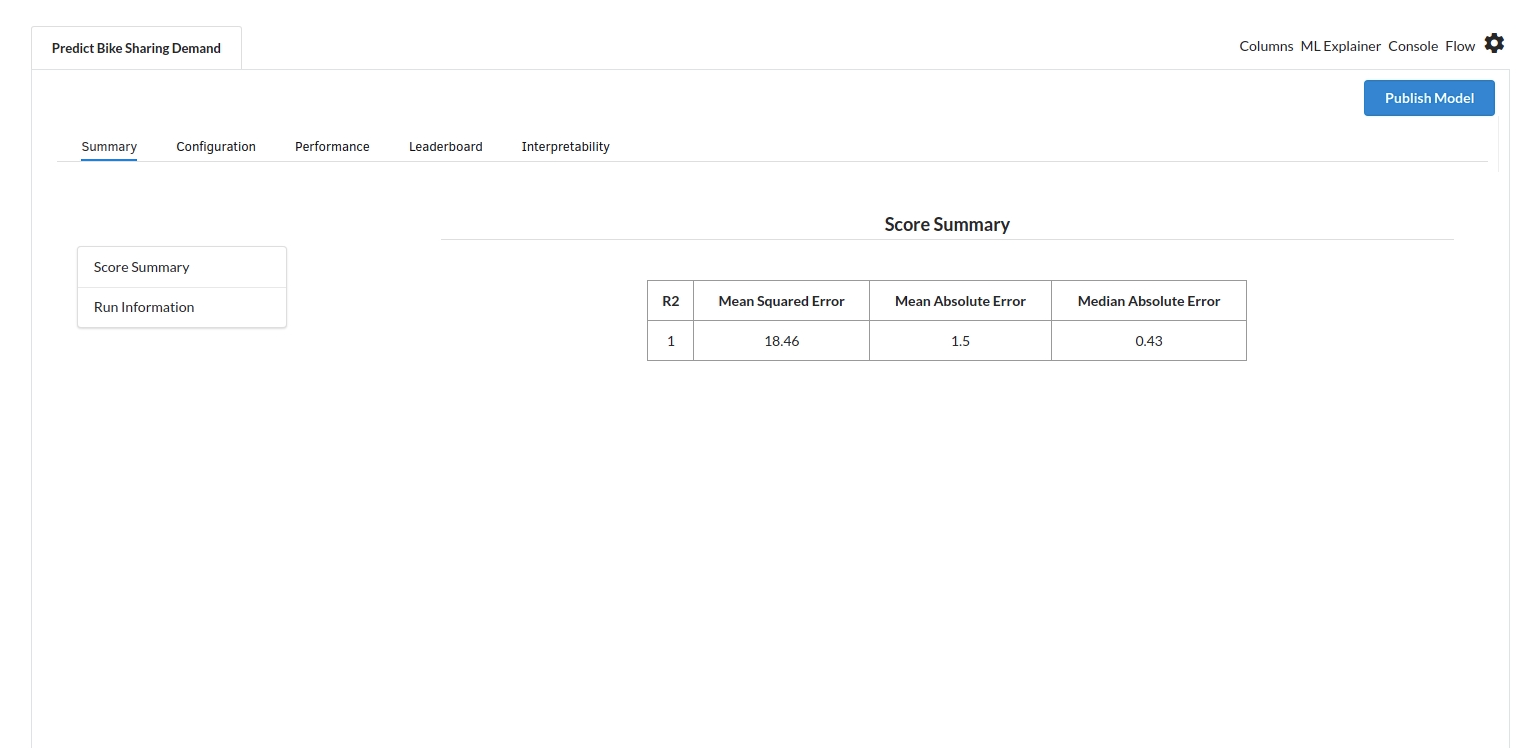
Look at the metrics score and the Run summary stats. Based on your calculations decide if the R2, mean Sqaured Error and Mean Absolute Error are according to your expecation. if not this will be your first step to rethink the training process.
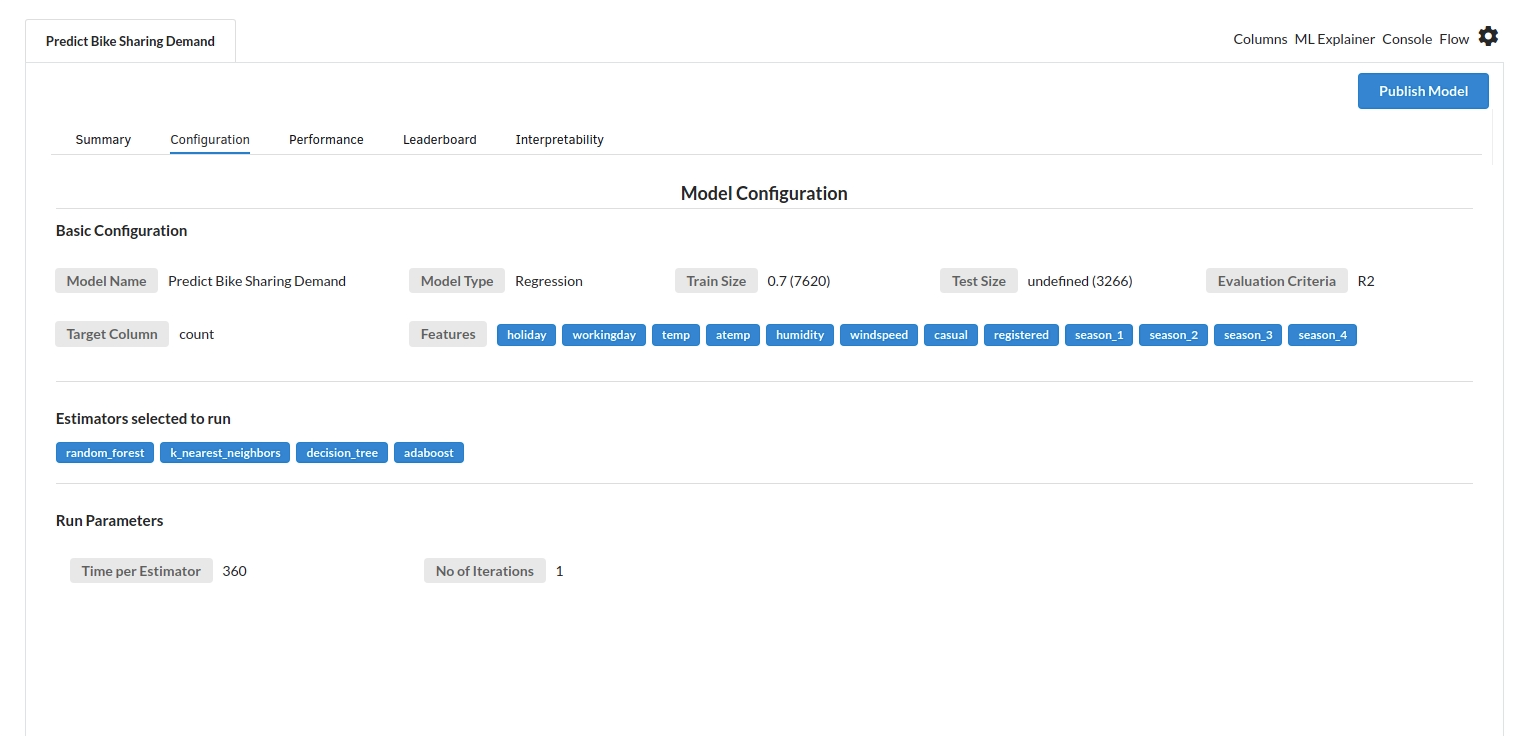
- The second view under Ml explainer is configuration view
The configuration view will give you the information about the step you filled in the Regression step . The view would look like the one below.
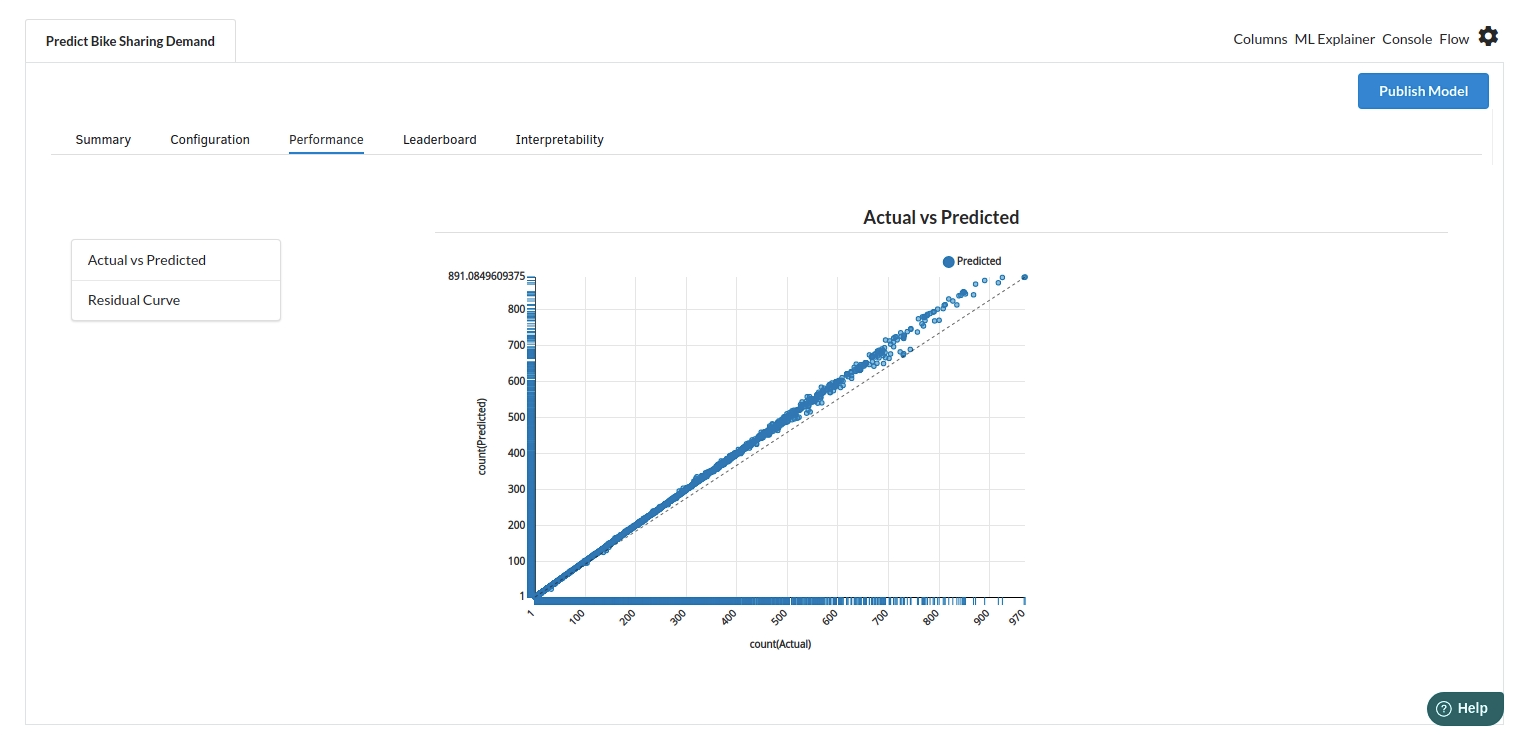
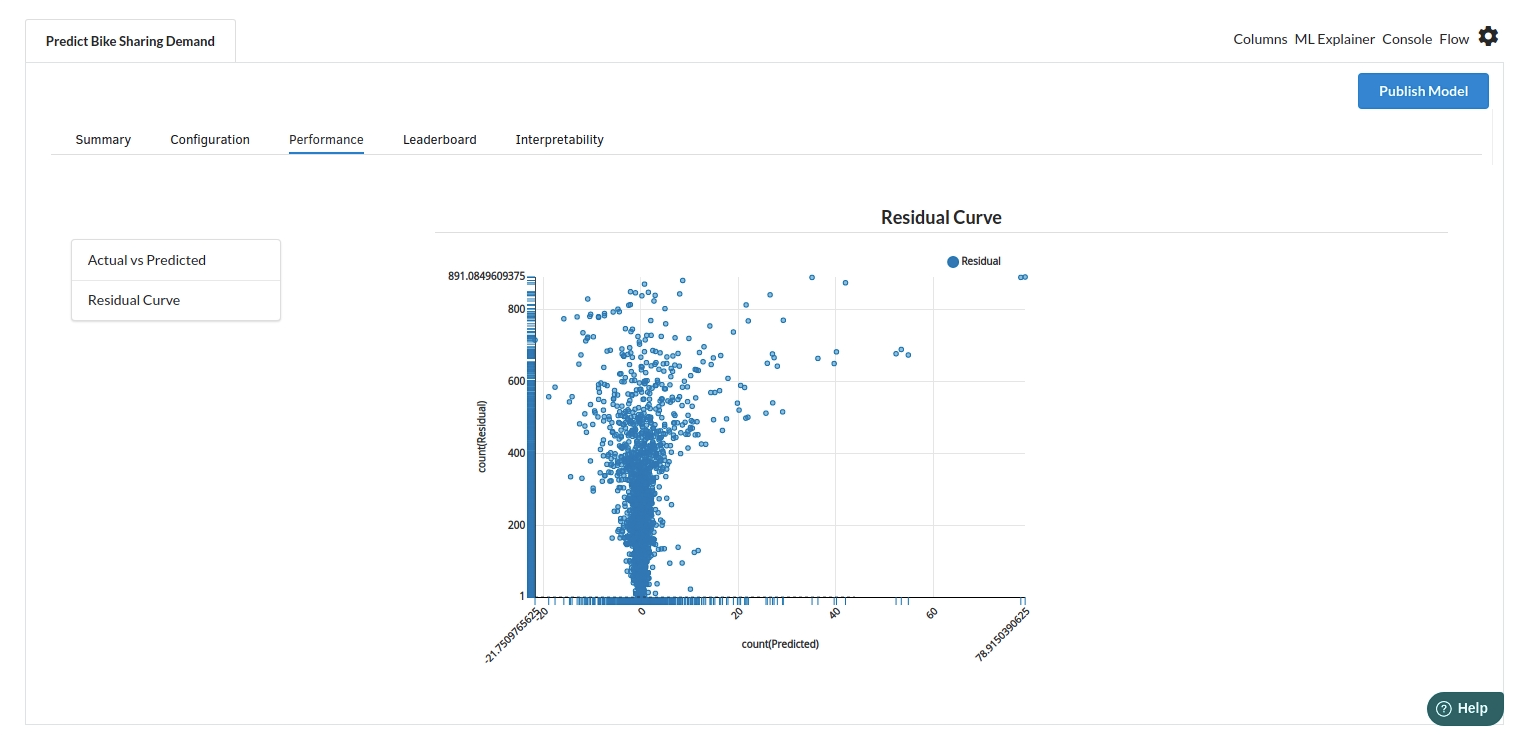
- The third view under Ml explainer is Performance View . You can see the actual vs predicted and the residual curve charts for regression. Look at the built charts and decide if the charts are good enough for your model. The actual vs predicted chart is a good indicator to understand how well your model was trained .
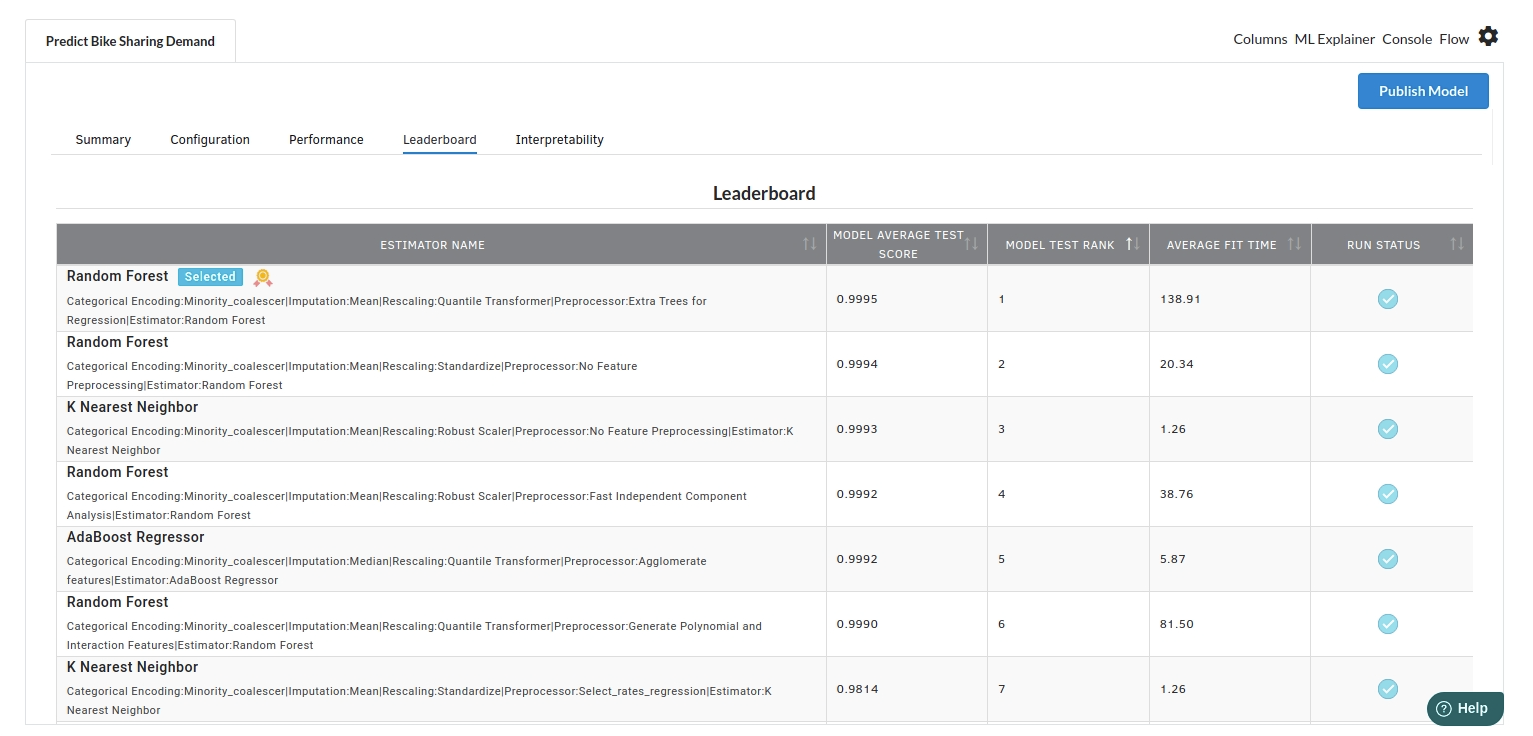
- The fourth view under Ml explainer is Leaderboard . In this view you can see the number of algorithms trained and all the feature engineering done on the algorithms used with ranking system to rank the best algorithm trained.
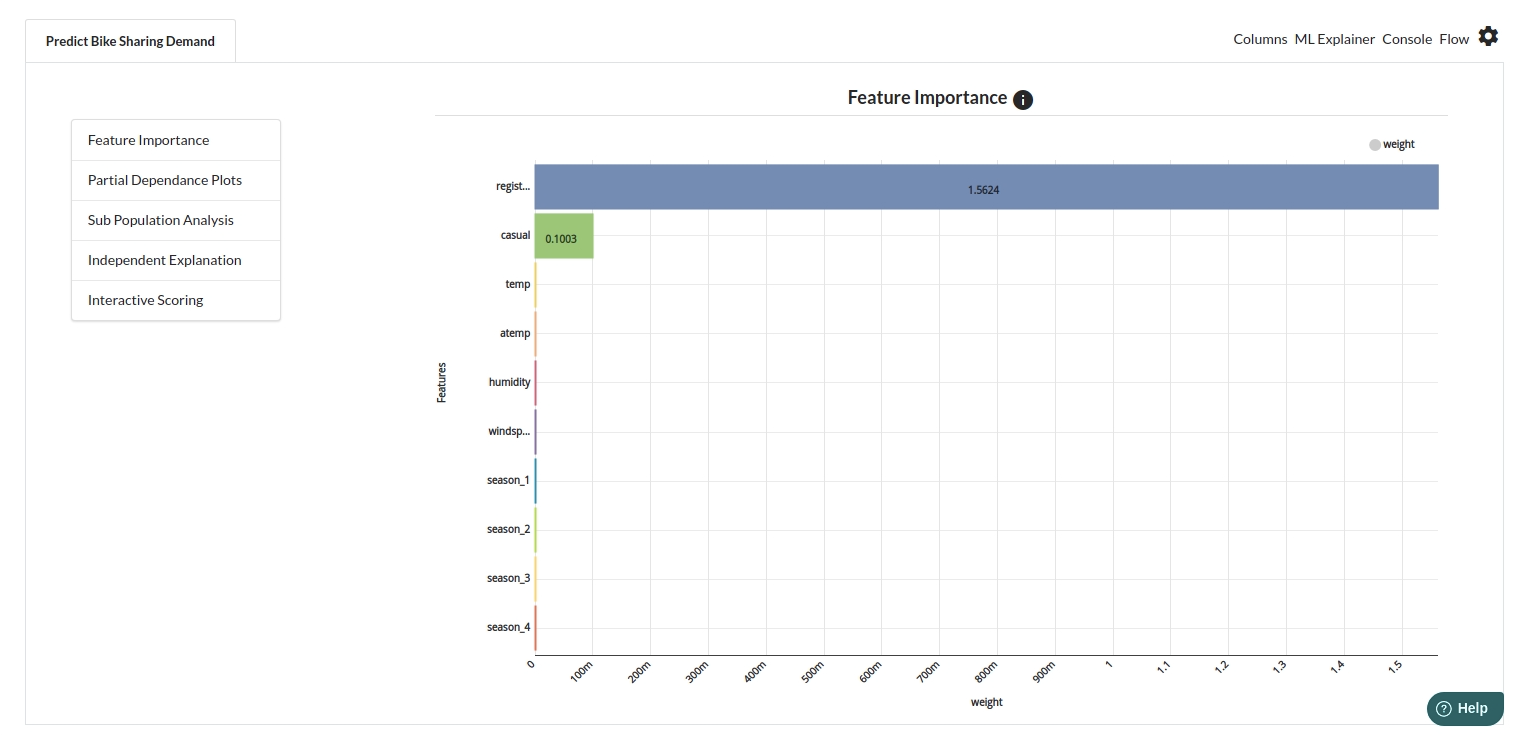
- The last view you see under ML explainer is Interpretability . In this view you will be able to interpret your model in simple terms where you will be getting results pertaining to feature importance , PDP Plots , Sub Population Analysis , Independant Explanation , Interactive Scoring . for more infomation on these results , refer to Interpretability . The Interpretability tab and the results under this tab would look like the one below.