Delinquency Analysis

What is Deliquency in Banking ?
According to Investopedia , The term delinquent refers to the state of being in arrears. i.e you are high in debt. When someone has missed their payment of loans past a due date they are considered deliquent and if the loan is not cleared slowly then the customer is termed as defaulter.
Delinquence VS Default
Delinquency occurs as soon as a borrower misses a payment on a loan. Being consistently delinquent can lead to default. Default occurs when a borrower fails to repay a debt as specified in the original contract.
Objective
The Objective of this workflow is to analyse the delinquent customers in a bank or NBFC and understand their pattern of payment using Customer Details and their Delinquency details . We willalso be building a Dashboard to under the delinquency visually .
Business Goals
- Helps Banks or NBFCs(Non Banking Finance Co-operations) to take decisions if anyone is near to being default
- Will help Bank or NBFCs to understand how are their branches in are performing in repayment collections.
- Delinquency Trends can further help understand the portfolio quality trends over time.
Relevance of Xceed
Xceed will provide a NO-Code Environment where you can clean your data, create all kinds of KPIs required for your workflow and visualize all the results in a sophisticated manner and also helps you with version management too where you can get the results of previous runs and analyse how much has the customer or the branch improved over a period of time.
Data Requirements
For this workflow you will be needing 2 types of data such as :
- Customer Details
- Delinquency details
Basic Flow
- Upload all the datsets required for this workflow
- Create datasets under the data catalogue section.
- Create workflow/Experiment
- Initial Exploration and cleanup of the datasets
- Create KPIs necessary for the analysis
- Output Processor of the workflow
- Initial exploration of the dashboard service
- Create necessary visualizations for workflow.
Output Expectation
- A Cleanly built dashboard which can be useful for the decision making in delinquency analysis.
Basic Flow Steps
Upload all the datasets required for this workflow
For more information on uploading datasets, Refer to Data Connectors
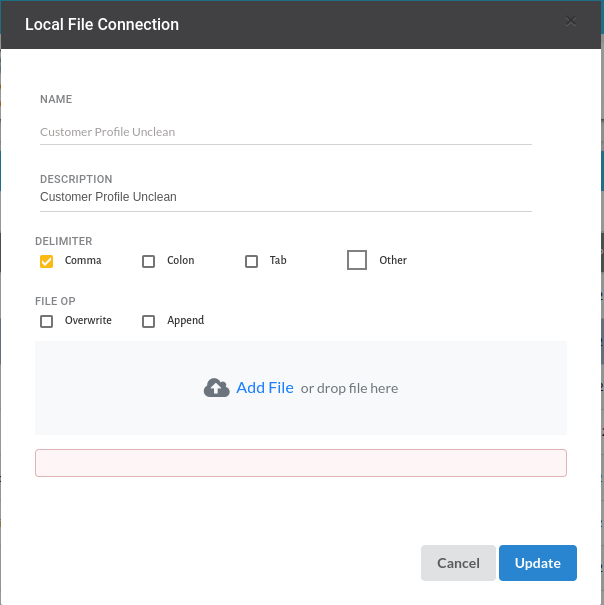
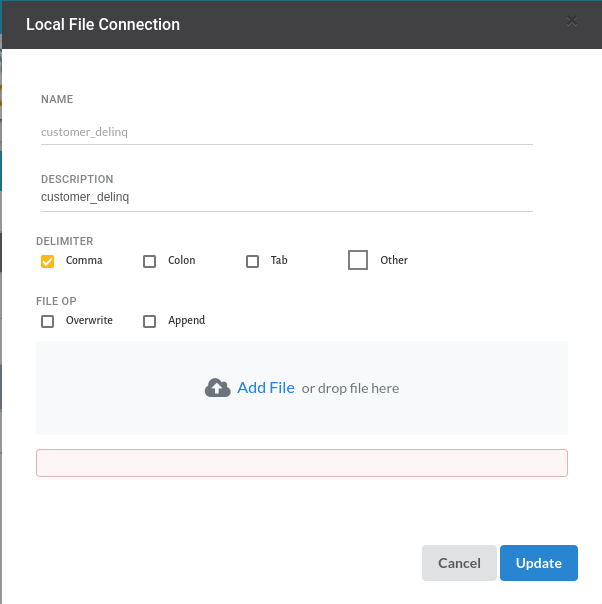
Create Datasets under the data catalogue Section
- Both the uploaded datasets after creating datasets under data catalogue would look like the one below
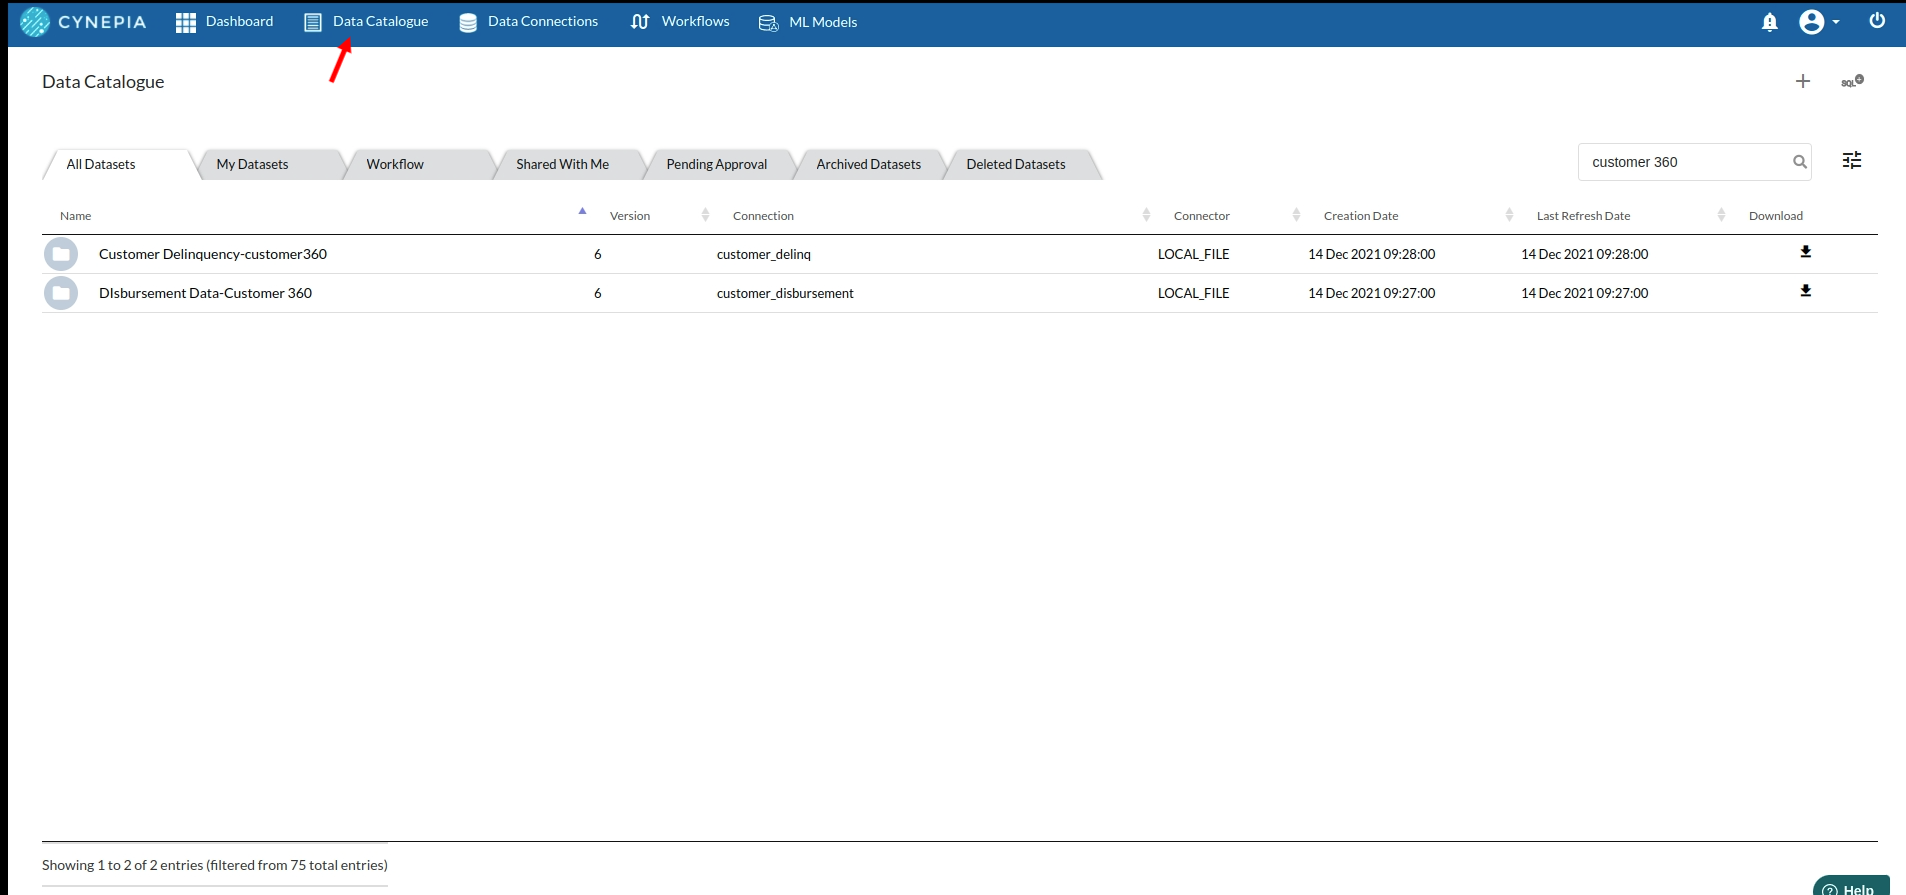
For more information , Refer to Data Catalogue
Create Workflow/Experiment
- Hop on to the Workflow section and create a worklow naming it as Delinquency Analysis
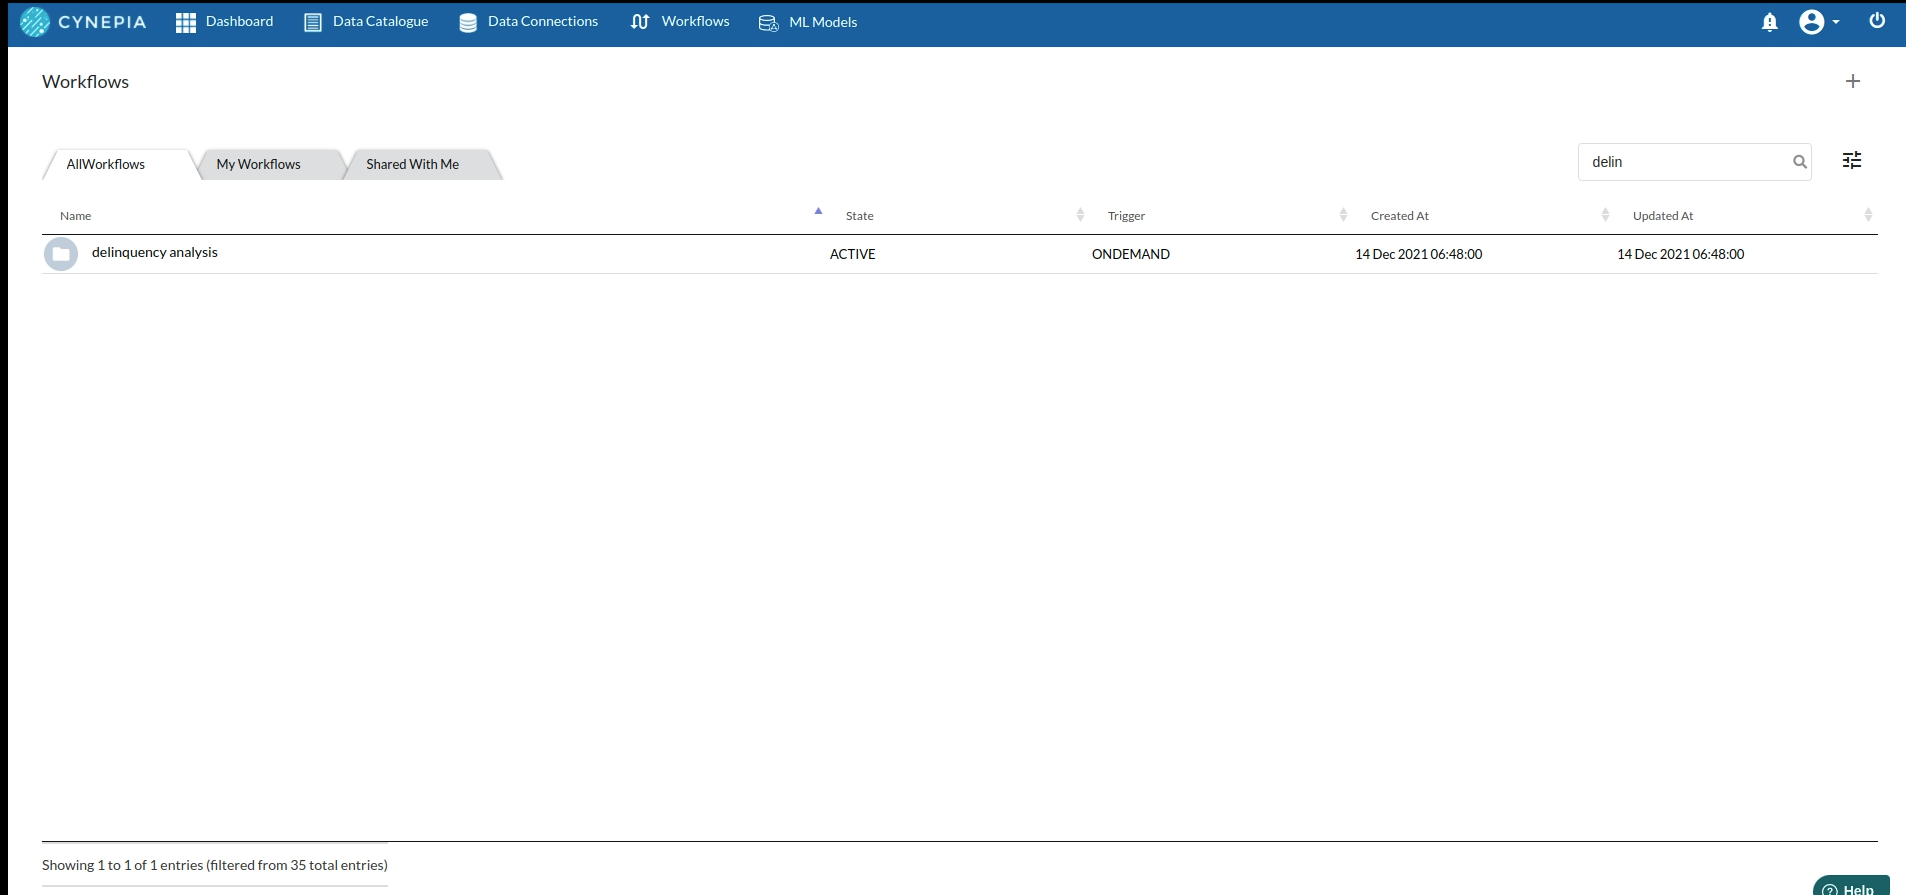
- After creating your workflow your page would details page would look like the one below
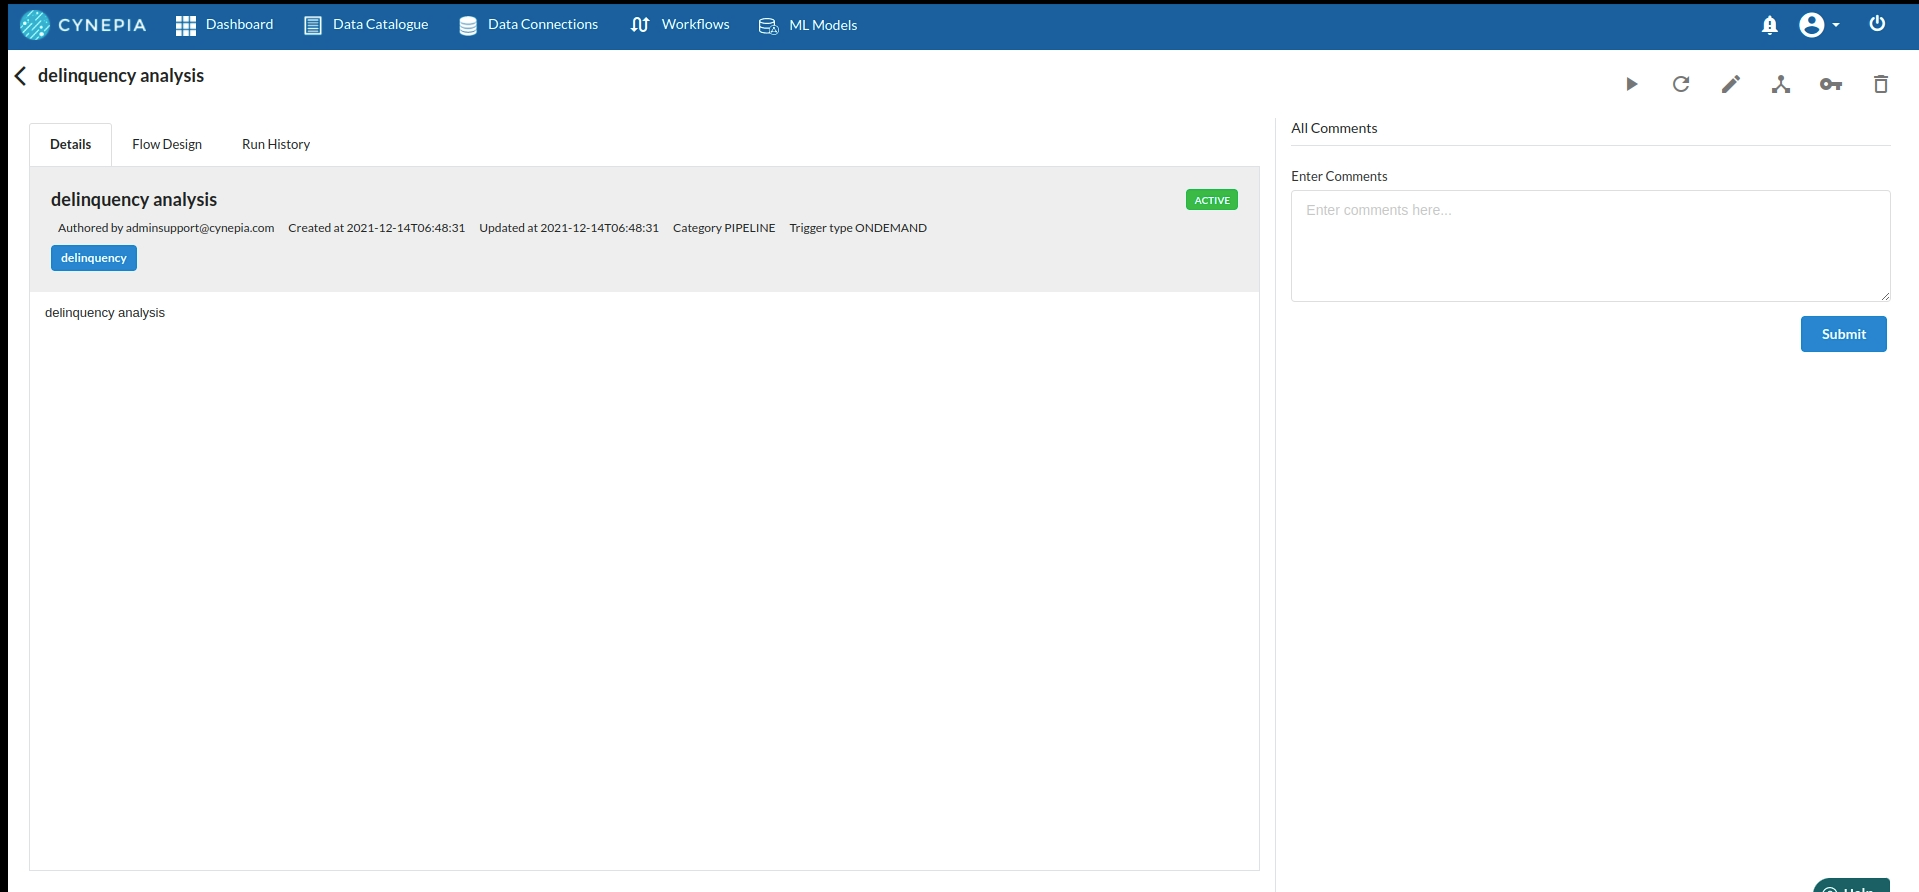
for more information regarding this, refer to Create Workflow and Workflow Designer Main Page
Design your recipe architecture
-
Since we are using two datasets here , we need to clean them seperately so create two recipes for cleaning both the datasets and one recipe to join the cleaned dataset to create all the KPIs necessary for the workflow.
-
The flow of the architecture would look like the below
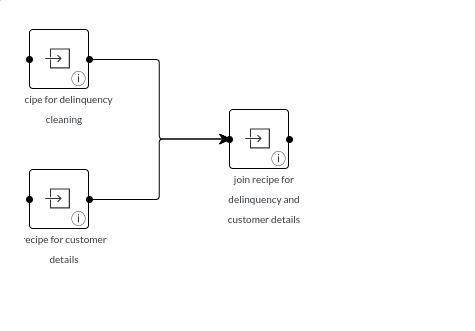
for more information regarding this, refer to flow and recipe creation.
Initial exploration and cleanup of the datasets
- Delinquency Cleanup
The columns under this dataset will have columns such :
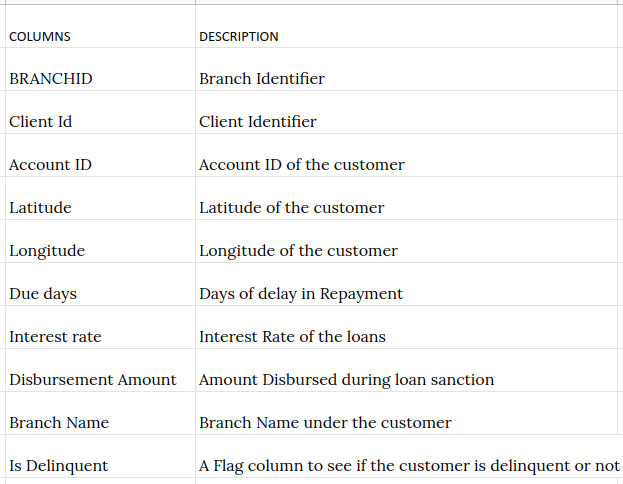
Delinquency Cleanup steps
- Find and Replace : Go to the columns sections and as you look at branch Id, you will notice that it has some characters $$$ which have to be taken.
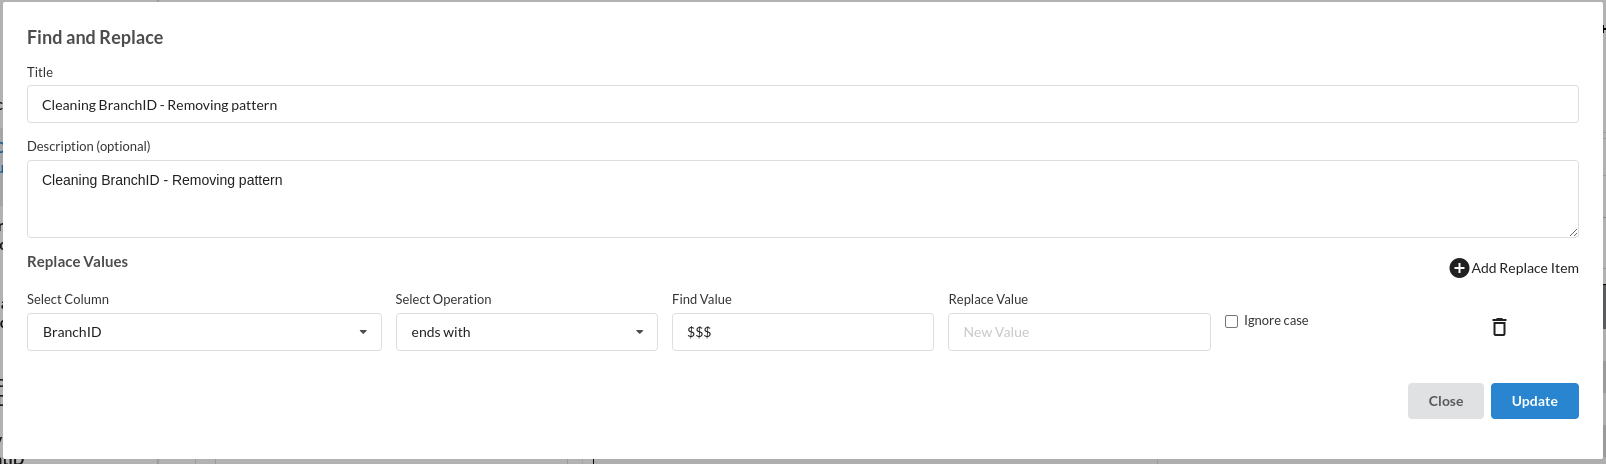
For more information on this processor, Refer to Find and replace
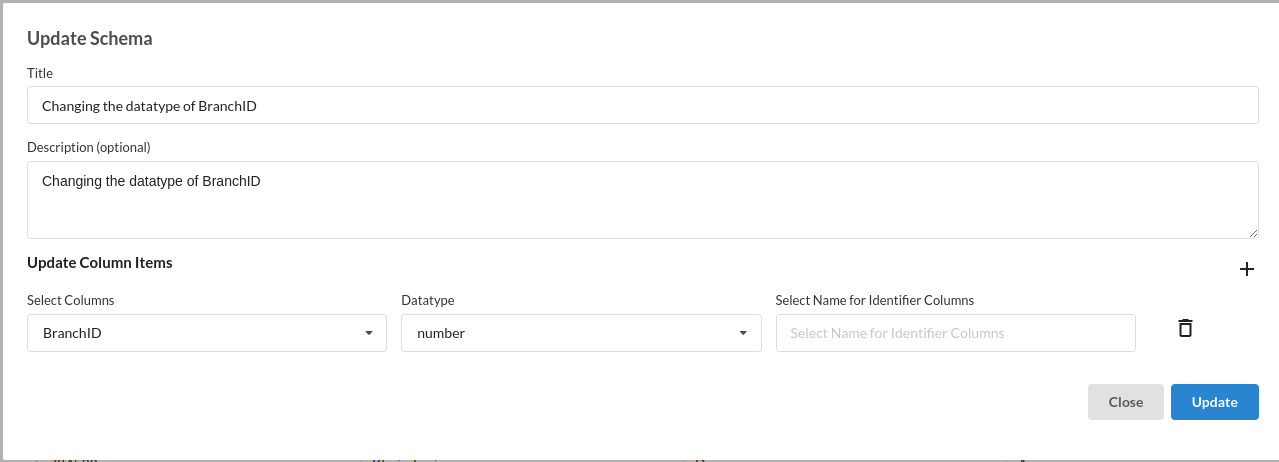
- Update Schema : after replacing the characters in branch Id , you need change the datatype of the column from string to number.
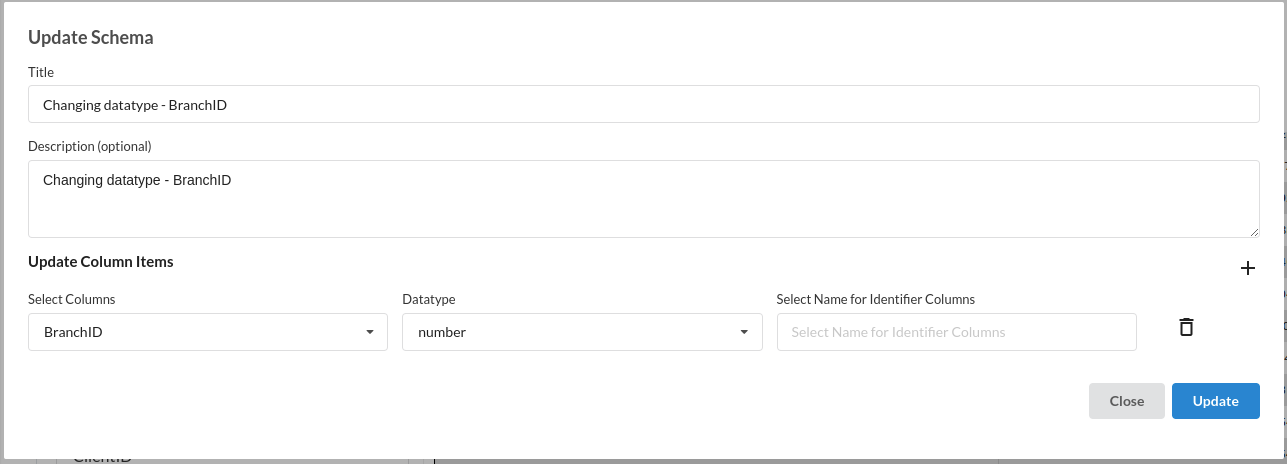
For more information on this processor, Refer to Update Schema
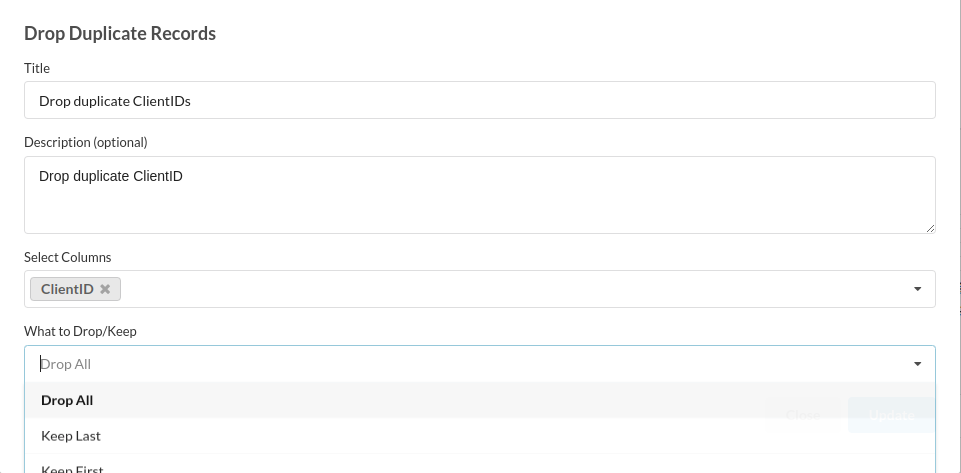
- Drop Duplicates : As you explore more in the columns sections you will see the the values in client ID are more than 1 . Client ID is supposed to a be a unique value column .
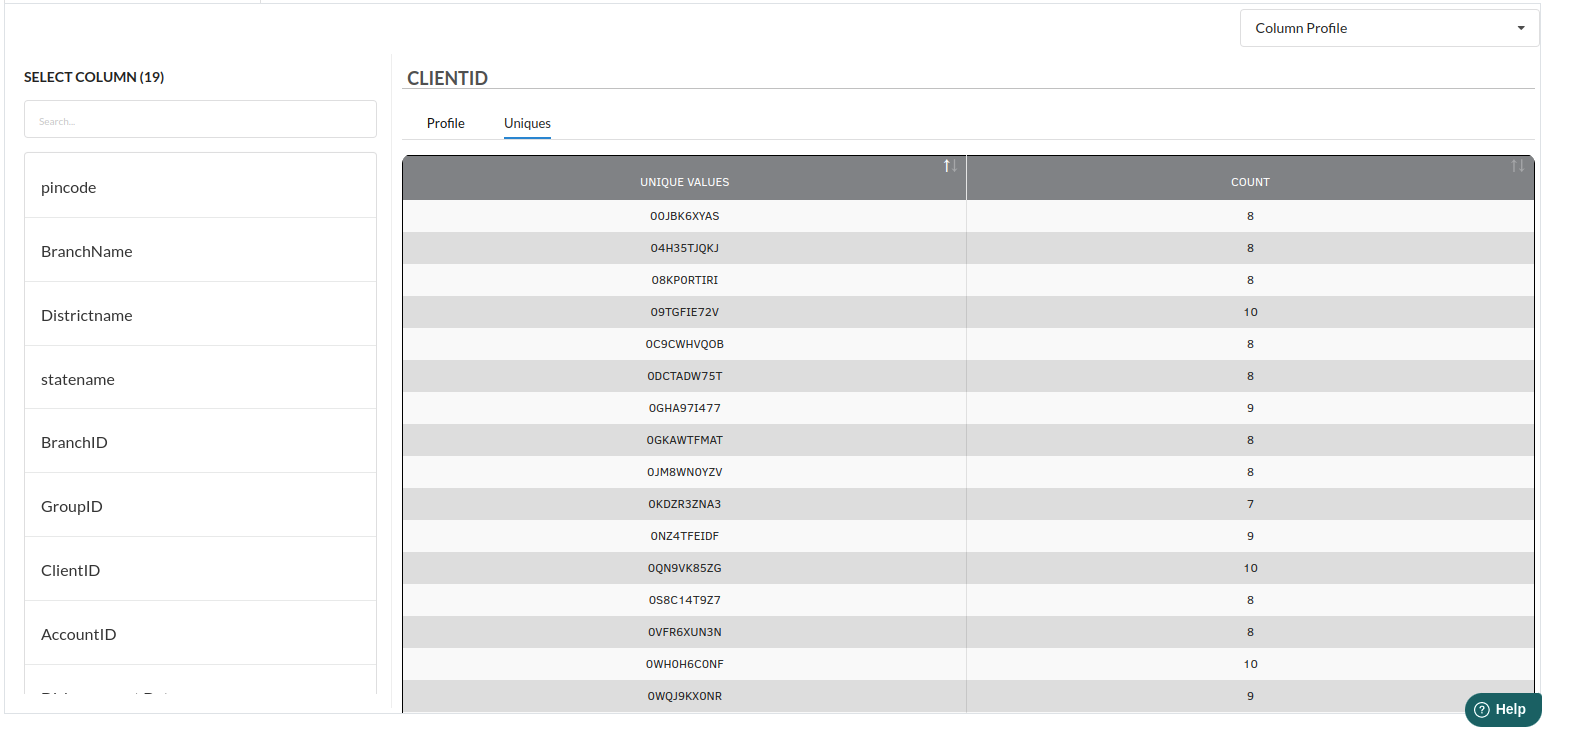
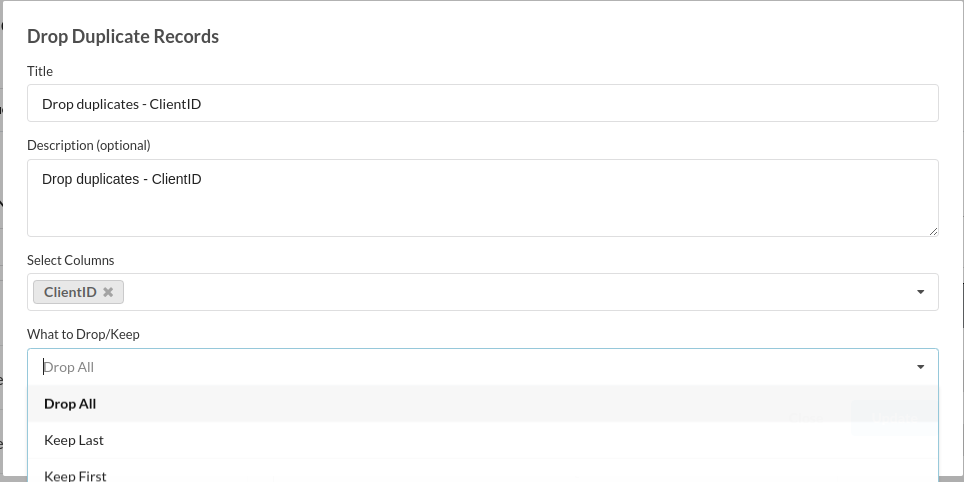
For more information on this processor, Refer to Drop Duplicates
- Drop Empty Cells : Explore more on the columns section and you will see a data completeness block which will tell you if there are nulls in that column.
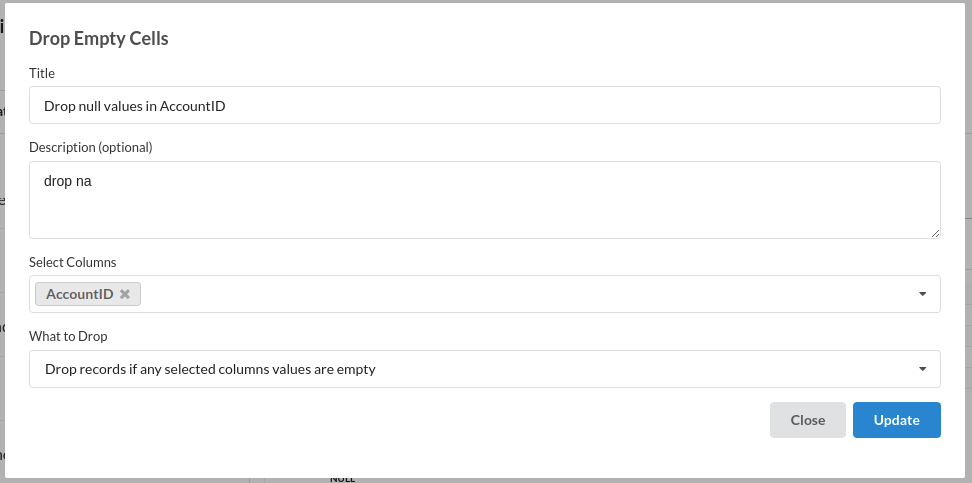
For more information on this processor, Refer to Drop Empty Cells
- Find and Replace : Explore more on the columns section and you will see that No of dependants have a value of -1 . No of dependants cannot be -1.
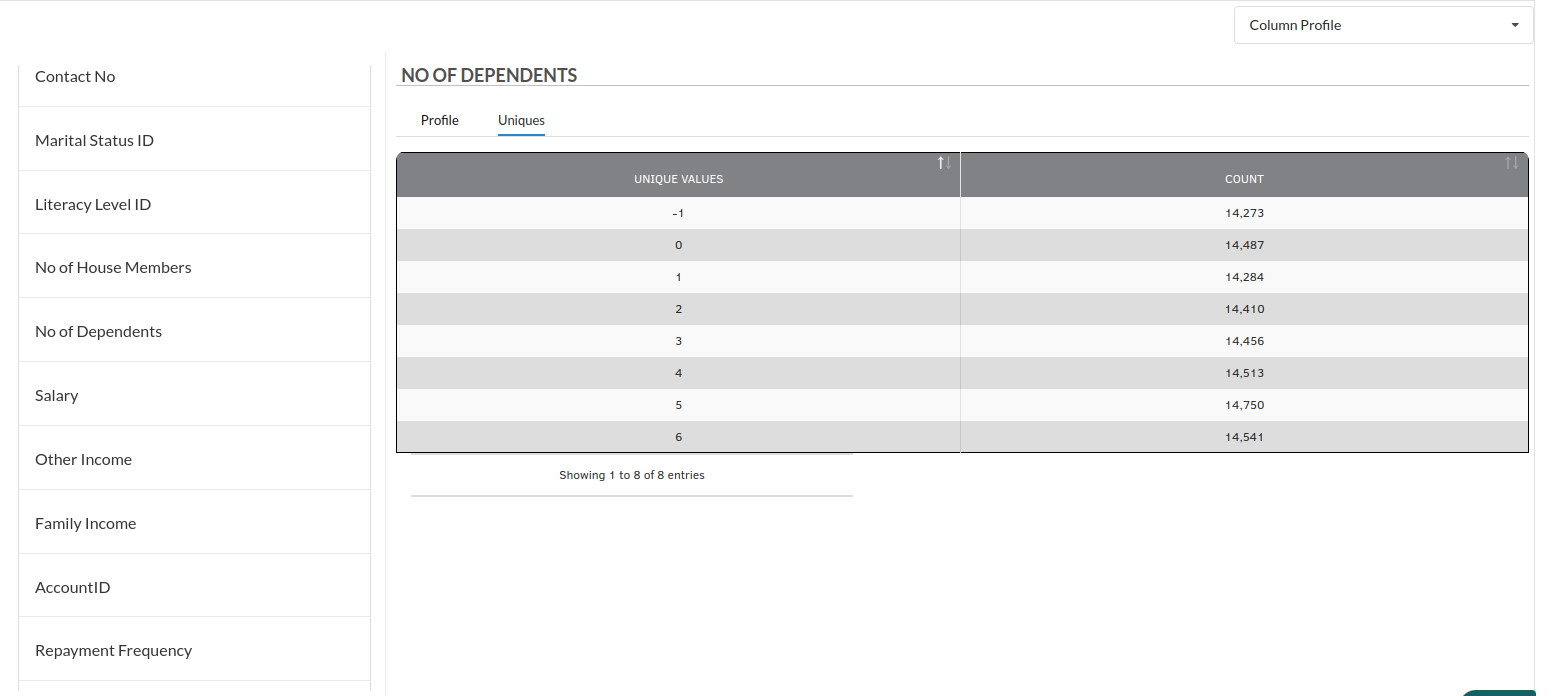
For more information on this processor, Refer to Find and Replace
The steps view and the flow view after you complete the cleanup of delinquency would look like the one below
for more information , Refer to Steps View and Flow
- Customer Details
The columns under this dataset will have columns as such:
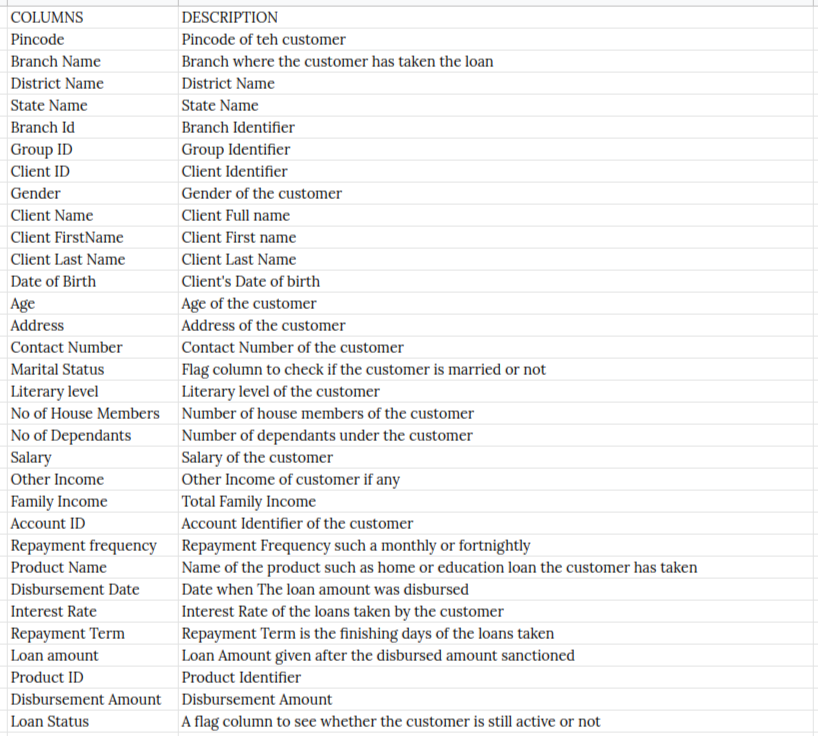

Customer details Cleanup
- Drop Duplicates : Client ID is a pretty unique column which should not be havning duplicate. Go to Columns section and see if the column is unique or not. The filled step for drop duplicates would look like the one below
- Update Scheme : Change the datatype of branch ID from String to Number.
- Drop Empty Cells : Explore more on the columns section and you will see a data completeness block which will tell you if there are nulls in that column.
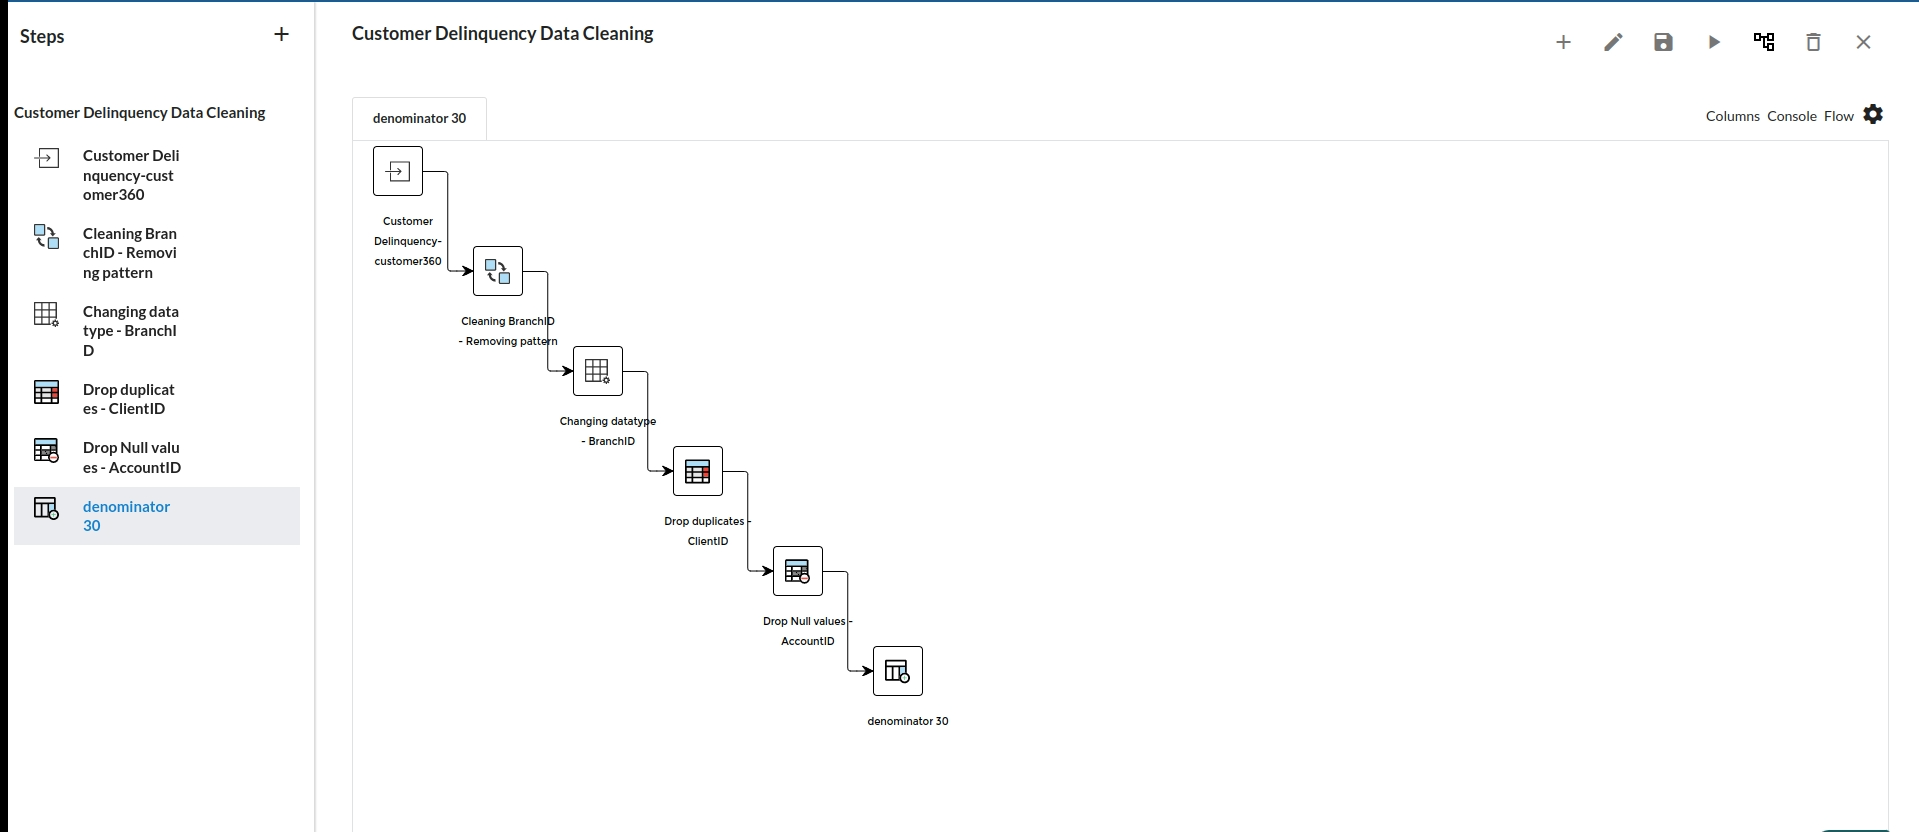
The steps view and the flow view after you complete the cleanup of customer details would look like the one below
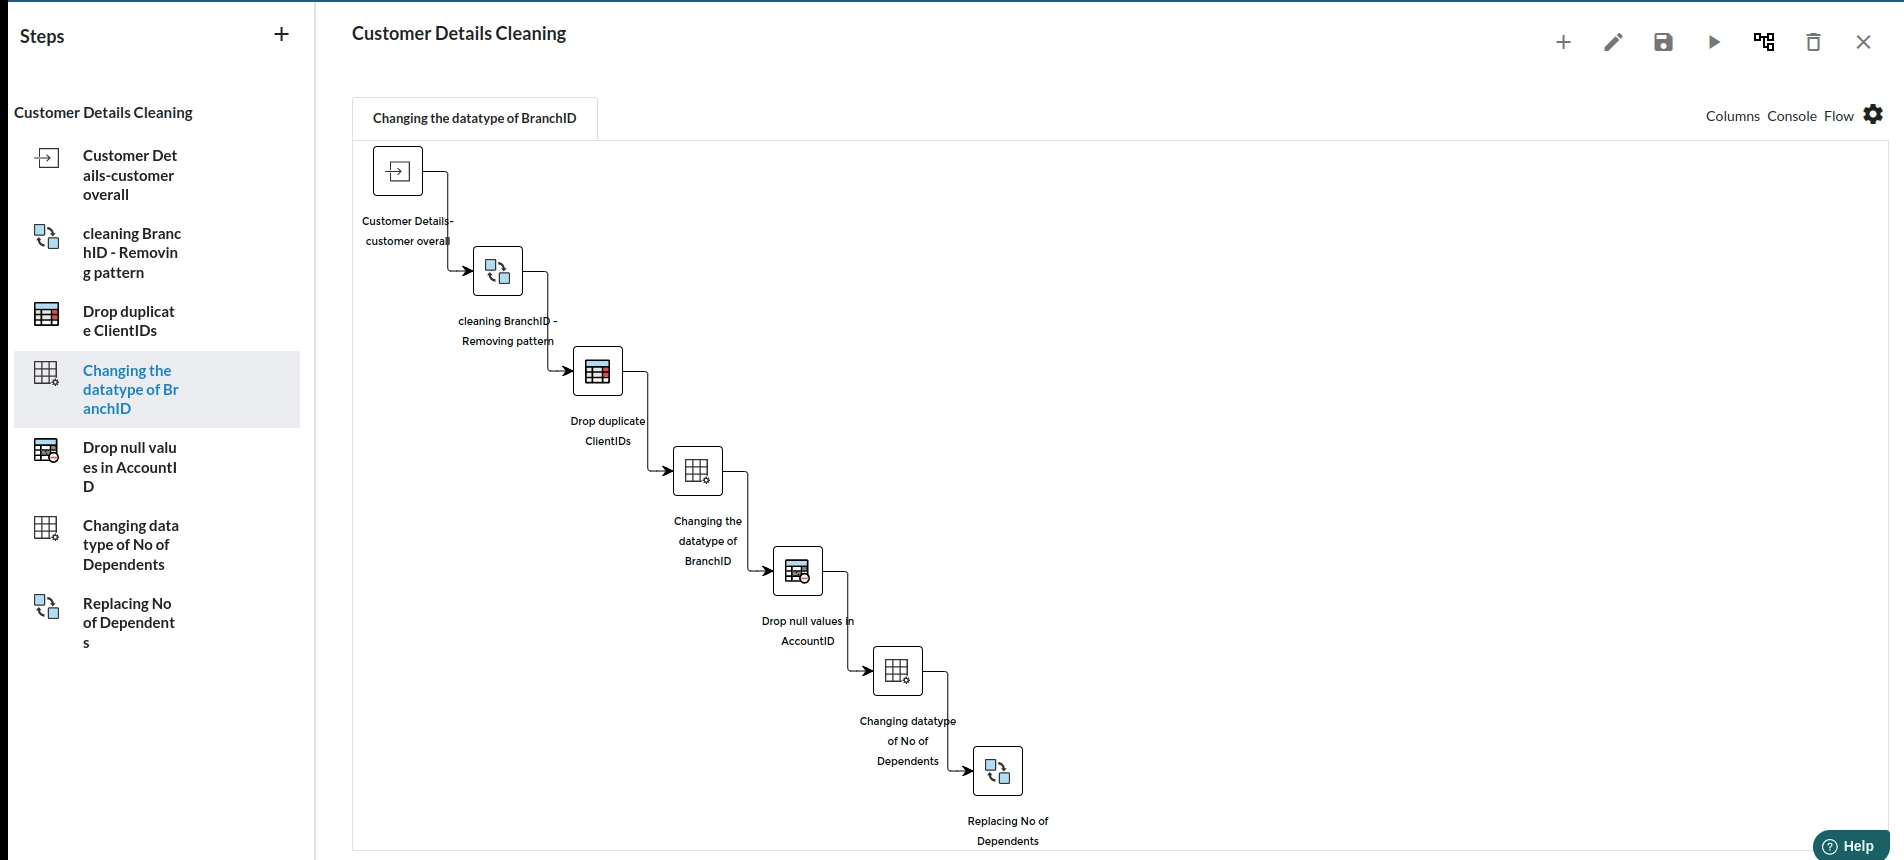
for more information , Refer to Steps View and Flow
Final Recipe
Click on the + icon in the command tool bar to join both the recipes.

for more information on joining recipes or creating one , refer to Command Tool Bar
now that you have a final recipe, the architectural flow would look like the one below
- Create Bins : This processor is used to create distributions of a column into multiple groups. We will be taking Due days column into consideration and create bins based on it .
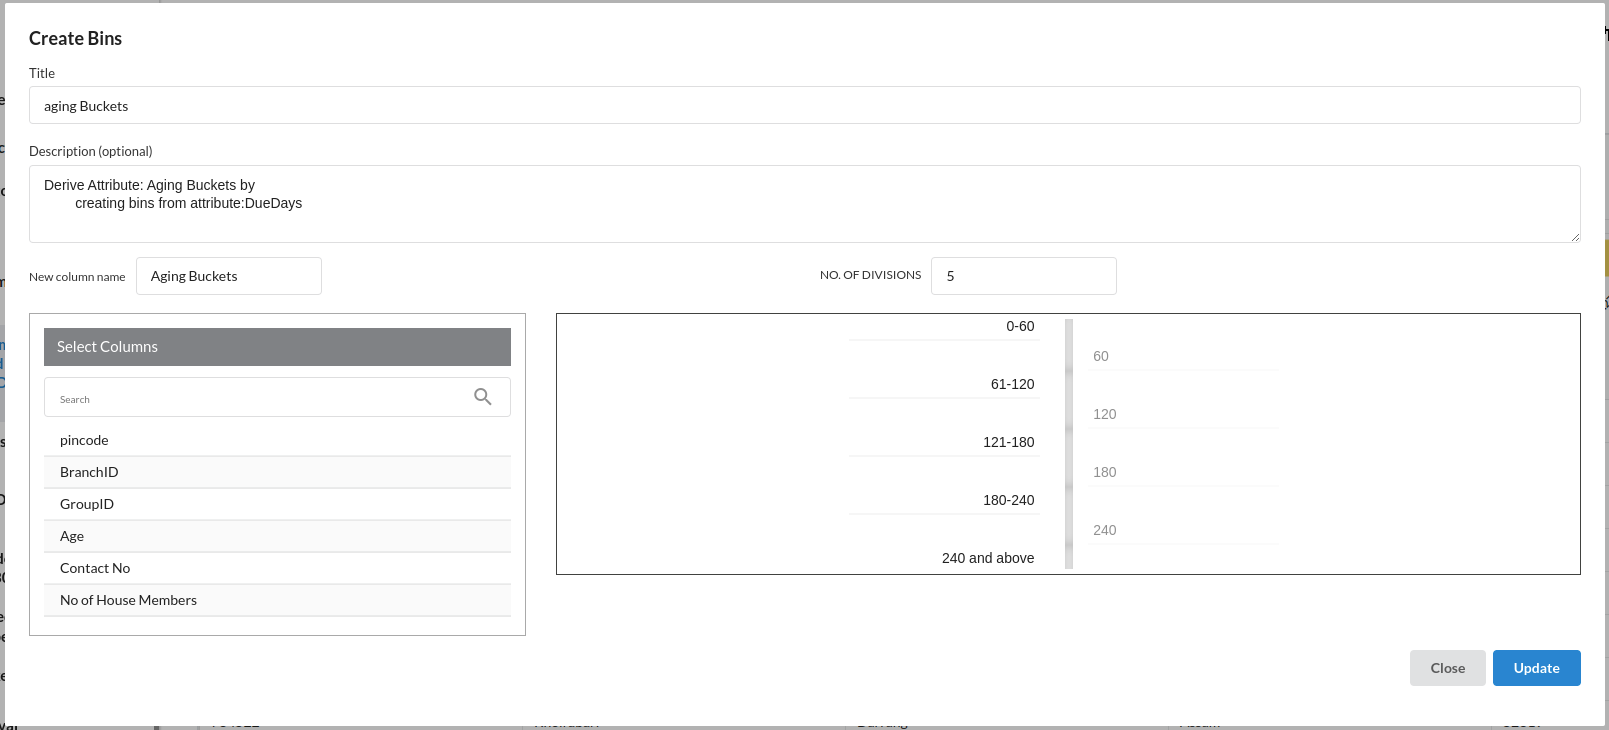
This will help us analyse the customers under their categories. for more information on this processor, Refer to Create Bins
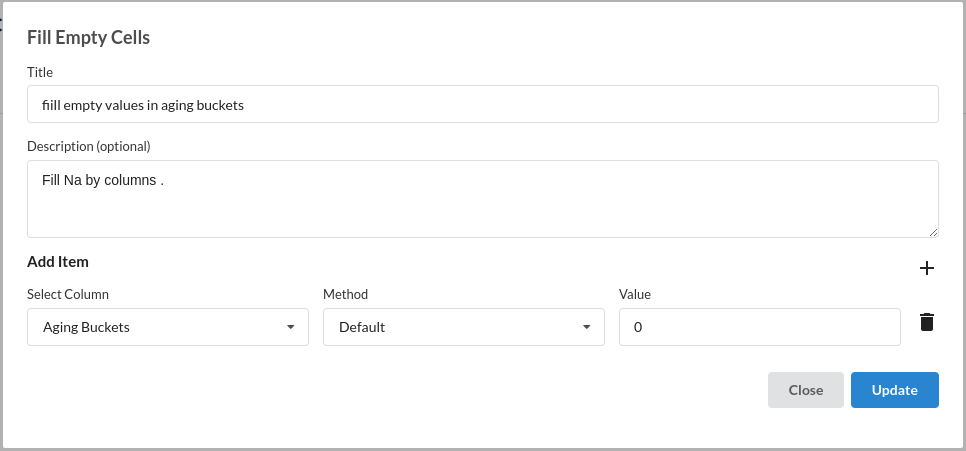
- Fill Empty Values : there are people who are delinquent , for those the values are going to null. Fill them with 0.
Output Processor.
After all that is cleaned up and created till now , you can create an ouput processor which will allow you to view the result in data catalogue and also will download the resultant dataset.
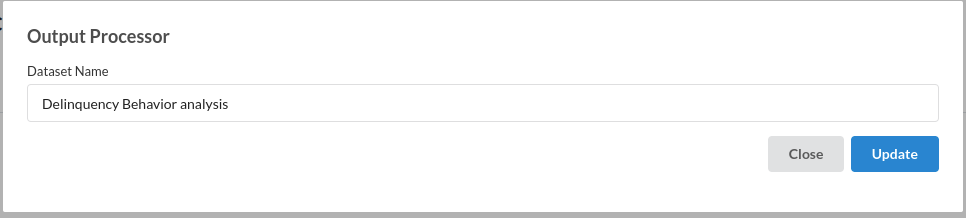
for more information on output processor, refer Output Processor
Initial exploration of Dashboard Service
After creating your first output processor, you will be able to see your resultant dataset in the data catalogue.
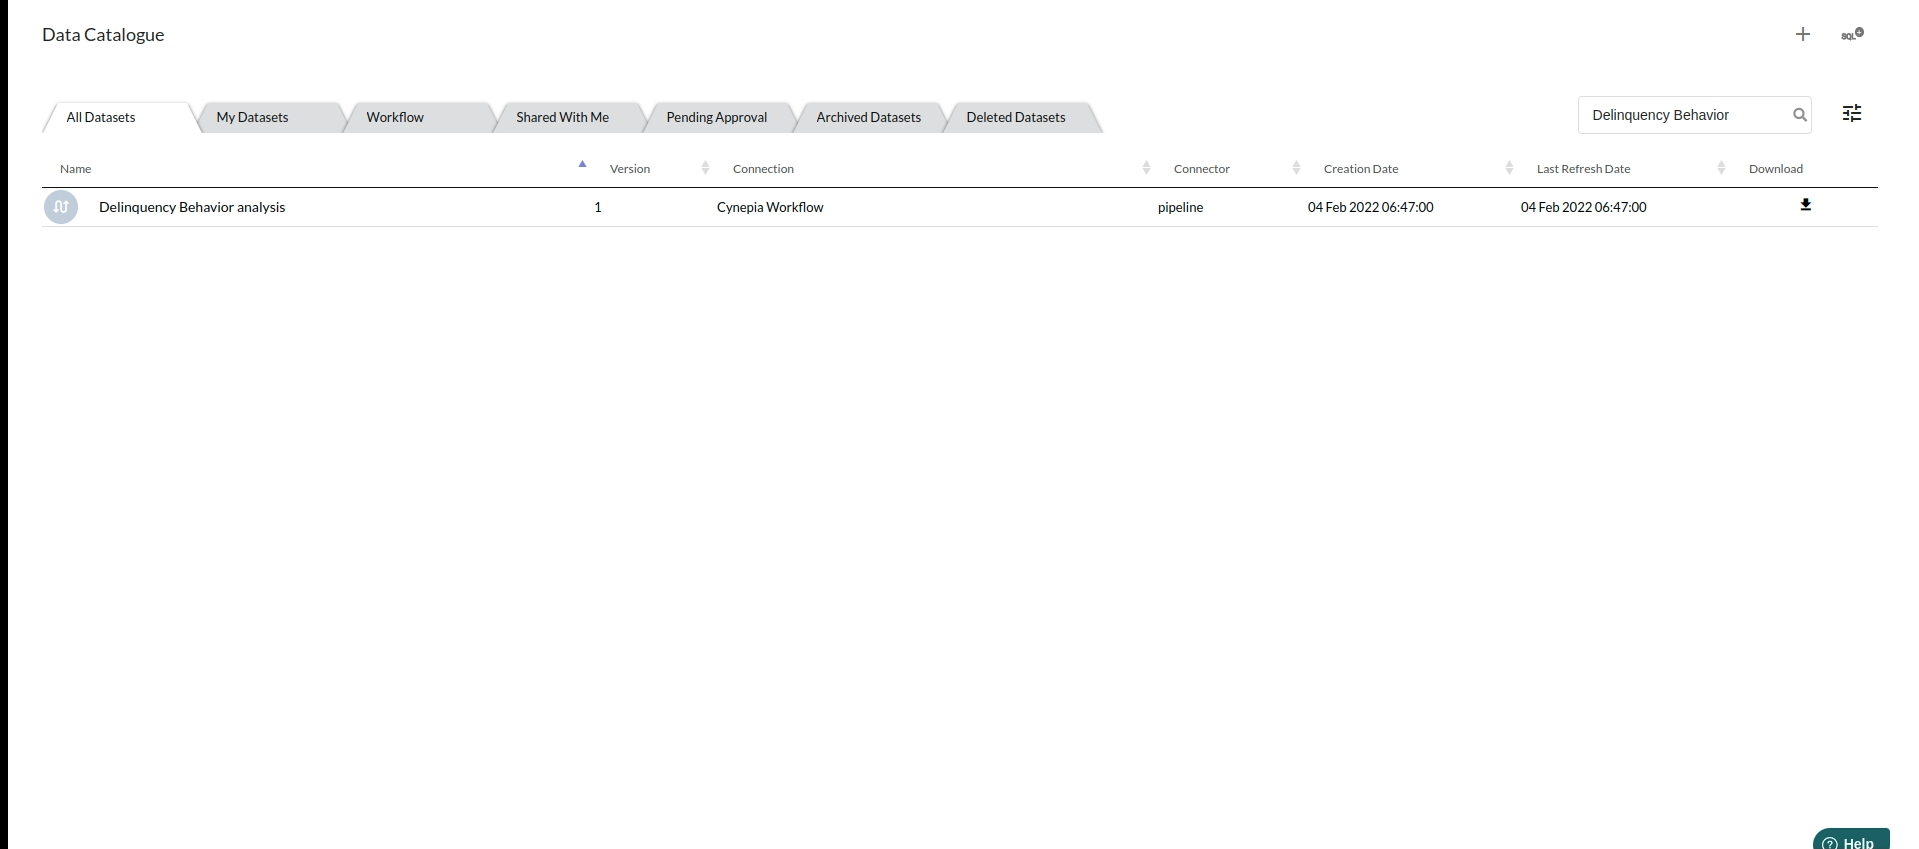
Click on the dashboard service in the view to create your first dashboard space.
The view when you click on the dashboard service would look like the one below
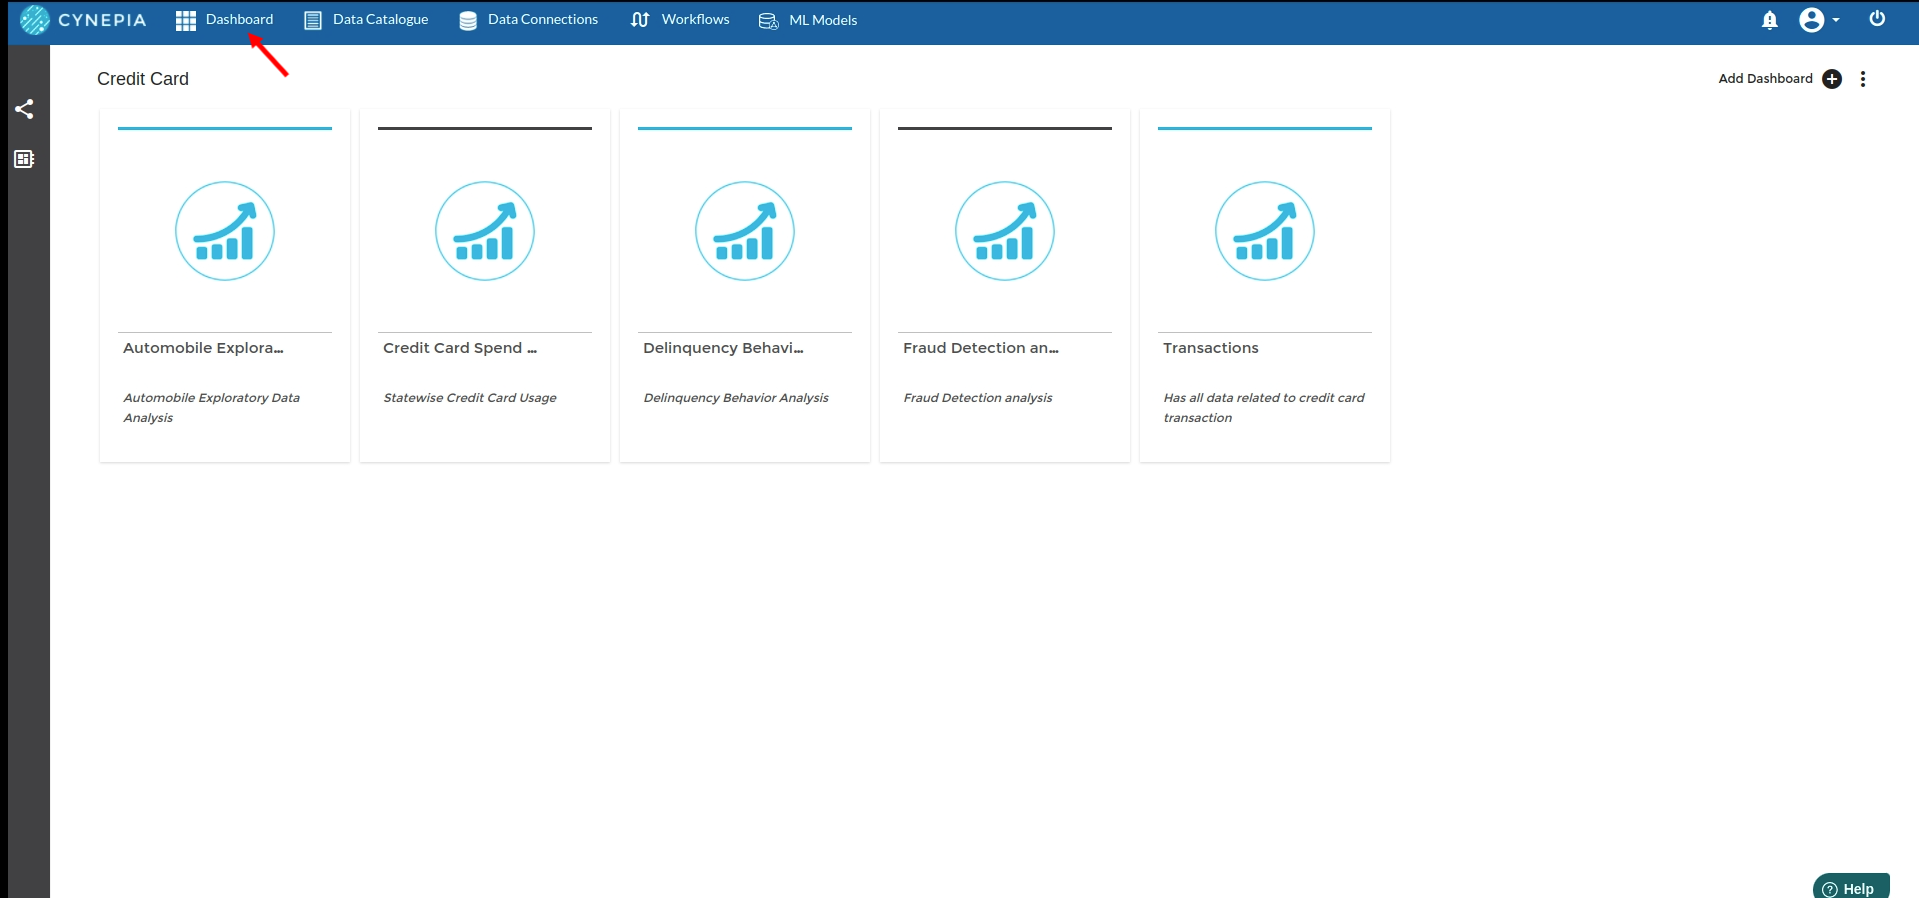
For more information , Refer to creating dashboards and spaces
Create Necessary visualisations.
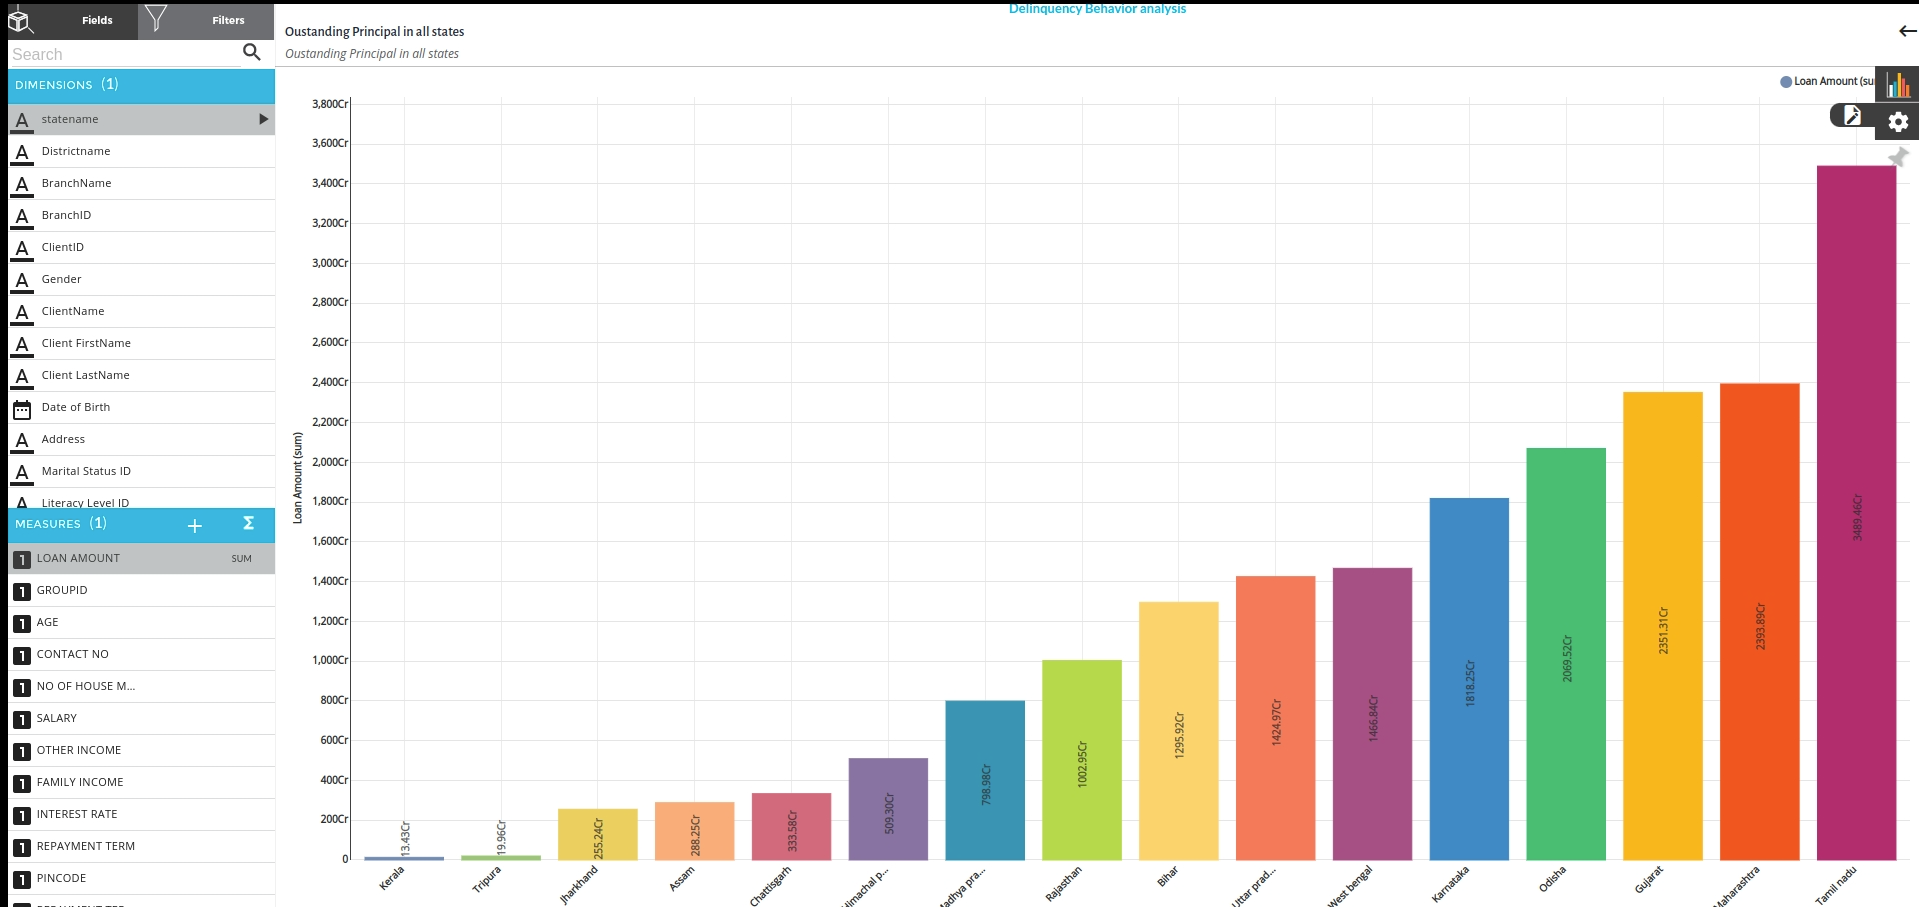
- Principal Outstanding in all states combined
Take sum of loan amount from Measures and choose Statename as your dimension to create Vertical Bar Chart
For more information on this chart , Refer to Visualization Types
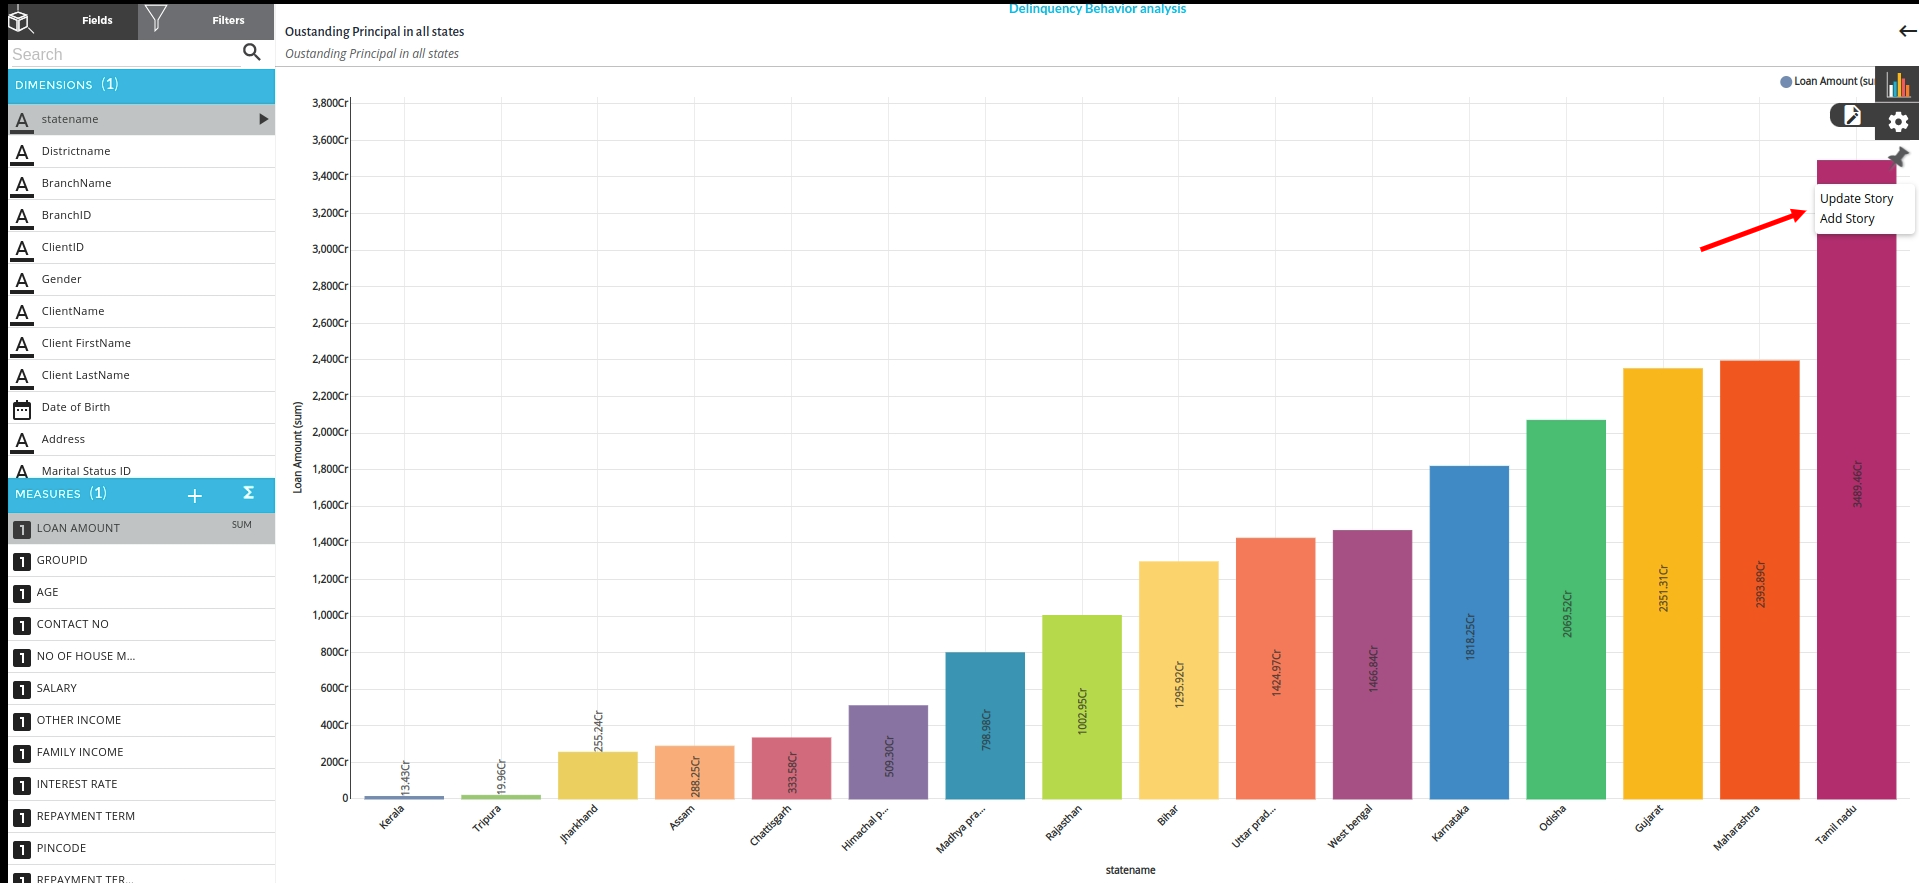
After creating your first visualisation you need to pin your chart to the dashboard so that all your charts will be seen in one space.
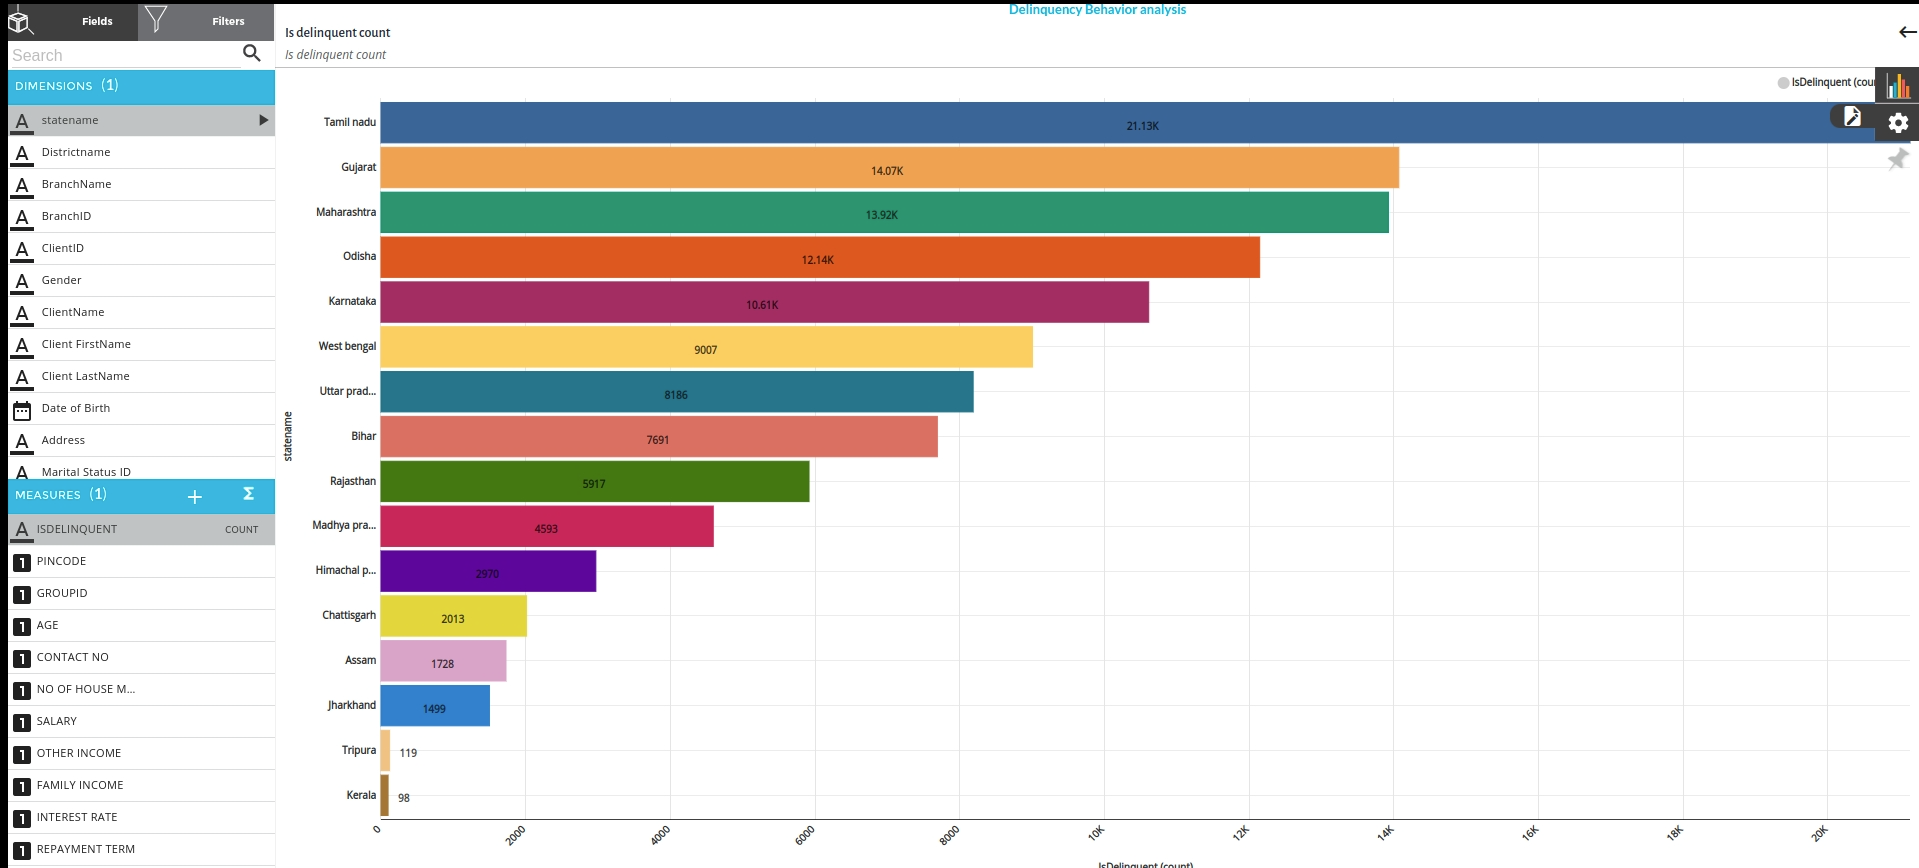
- Delinquency count in all states
Take count of IsDelinquent from measures and choose Statename as your dimension to create a Horizontal Bar Chart
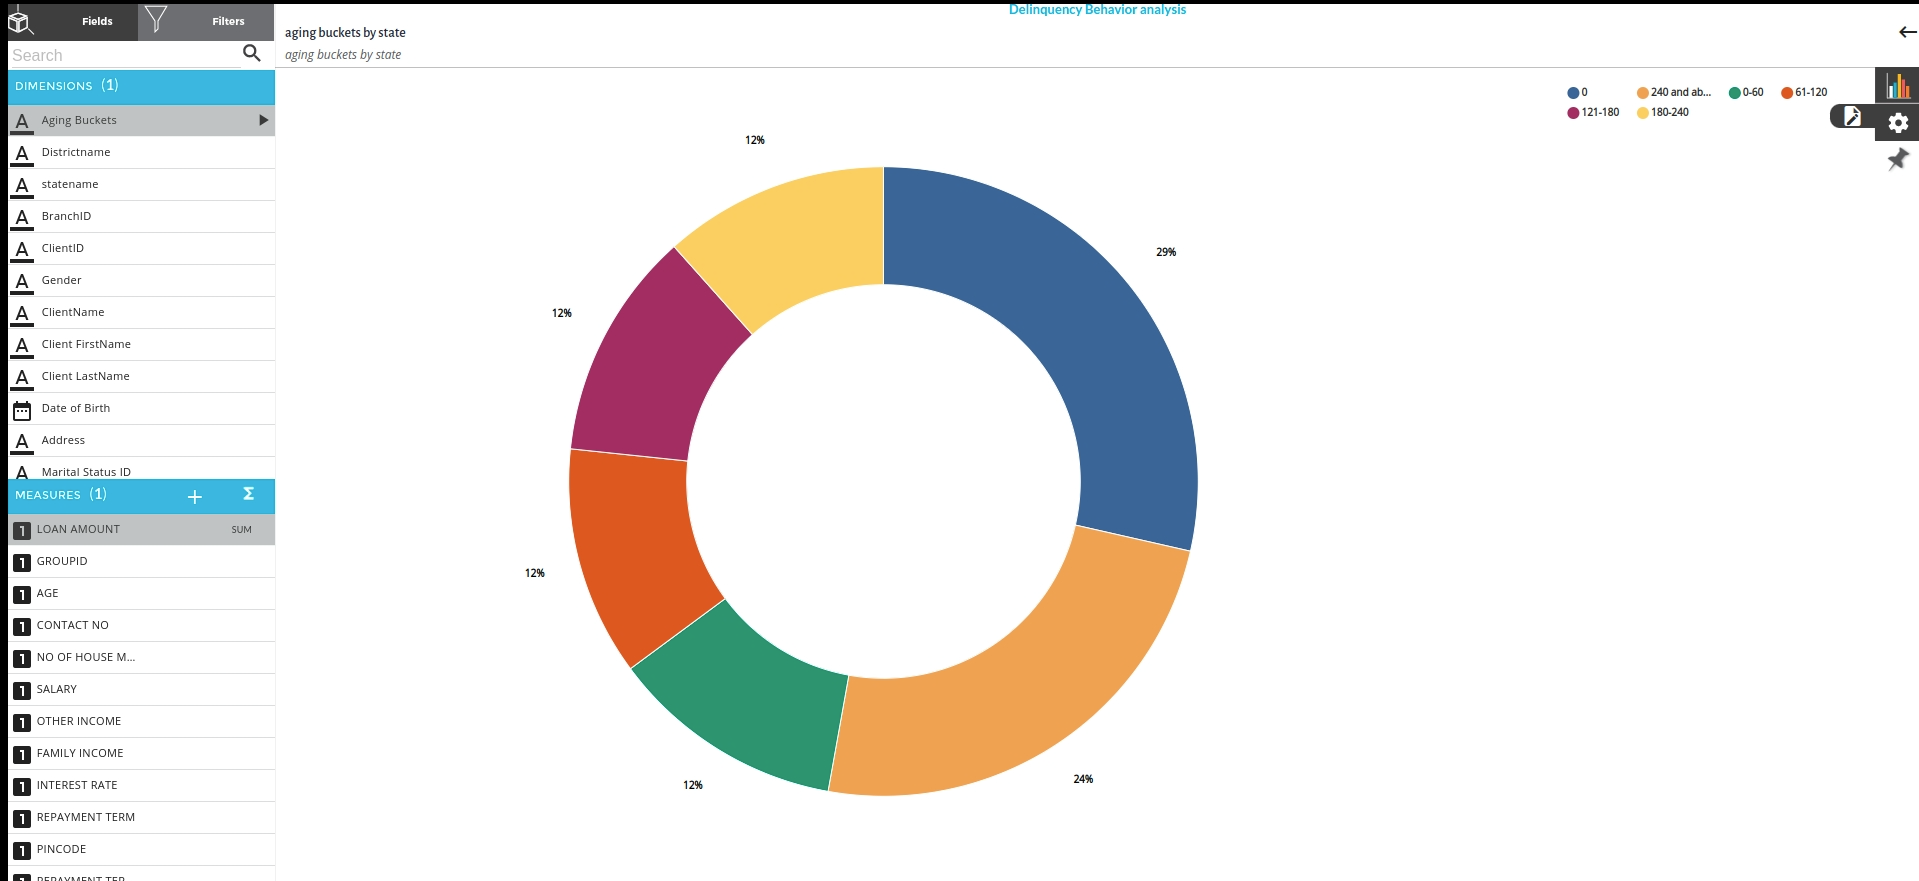
- Aging bucket by state
Take Aging buckets as your dimension and sum of Loan amount as your measure to create a Donut chart to understand the overdue amount that is under these categories
After creating your first visualisation you need to pin your chart to the dashboard so that all your charts will be seen in one space.
As you pin your chart and go back to your dashboard view you will be able to see all the charts that were created in one view.

Conclusion
with these charts you will be able to understand and analyse how is this organisation performing what measures should be taken to reduce the overdue amount and delinquent customers. You can as many charts as possible with the dataset you have in your hand and it is always a good practice to understand the value after creating any charts . Xceed will help you in end to end execution data science projects in your organisation.