Customer Propensity Prediction

Background
In marketing, consumer behavior refers to the actions and decisions consumers make when acquiring or utilizing products.Everything from the initial decision to acquire a product to how they use it and whether or not they continue to buy it in the future is covered by consumer behavior. Consumer behavior can be influenced by a variety of factors, including:
- Age, gender, and income are all personal factors.
- Family and friends are social.
- Religion and customs are two aspects of culture.
- Motivation, perception, and learning are all psychological concepts.
Consumer psychology, in particular, is an important branch of marketing research because it helps companies understand why consumers make the decisions they do.Understanding consumer behavior is critical for organizations because it can help them make better product and service decisions. Businesses can tailor their offers to better suit the requirements and wishes of their target market by knowing why consumers buy certain items and how they use them.Understanding consumer behavior can assist organizations in developing more effective marketing and advertising strategies that reach and influence potential customers. And the added bonus is that a few easy methods of acquiring consumer insight can help companies learn a lot about its customers.Propensity modeling is a set of techniques for creating predictive models that analyze a target audience's previous behavior to anticipate future behavior. Propensity models, in other words, assist in determining the possibility of someone executing a specific behavior.
Objective
This usecase is an attempt to analyse the results of a bank's direct marketing campaign to promote term deposits to existing customers in order to figure out what makes a consumer more likely to respond. The marketing campaigns were centered on phone calls, and it was often necessary to reach the same person multiple times. The main objective is to recognize and analyse the information available,test it using different classification models,evaluate and improve the best model and present the findings and discuss what needs to be done next.
Relevance of Xceed Analytics
Xceed Analytics provides a single integrated data and AI platform that reduces friction in bring data and building machine models rapidly. It further empowers everyone including Citizen Data Engineers/Scientist to bring data together and build and delivery data and ml usecases rapidly. It's Low code/No code visual designer and model builder can be leveraged to bridge the gap and expand the availability of key data science and engineering skills.
This usecase showcases how to create, train/test, and deploy a customer propensity detection/prediction classification model. The dataset is obtained from UCI Machine Learning Repository. Bank Marketing dataset is used for this purpose .Xceed will provide a NO-CODE environment for the end-to-end implementation of this project, starting with the uploading of datasets from numerous sources to the deployment of the model at the end point. All of these steps are built using Visual Workflow Designer, from analyzing the data to constructing a model and deploying it.
Data Requirements
The dataset that is used here includes :
- Bank Marketing dataset : contains the bank marketing campaign and customer propensity information .
Columns of interest in the dataset
Model Objective
Understanding trends in chronic kidney disease from the health report data and predicting if a person is likely to have chronic kidney disease by analysing the underlying data, constructing a classification machine learning model, and implementing it after defining the model's major features.
Steps followed to develop and deploy the model
- Upload the data to Xceed Analytics and create a dataset
- Create the Workflow for the experiment
- Perform initial exploration of data columns.
- Perform Cleanup and Tranform operations
- Build/Train a classification model
- Review the model output and Evaluate the model
- Improve on the metrics which will be useful for the productionizing
- Deploy/Publish the model
Upload the data to Xceed Analytcs and Create the dataset
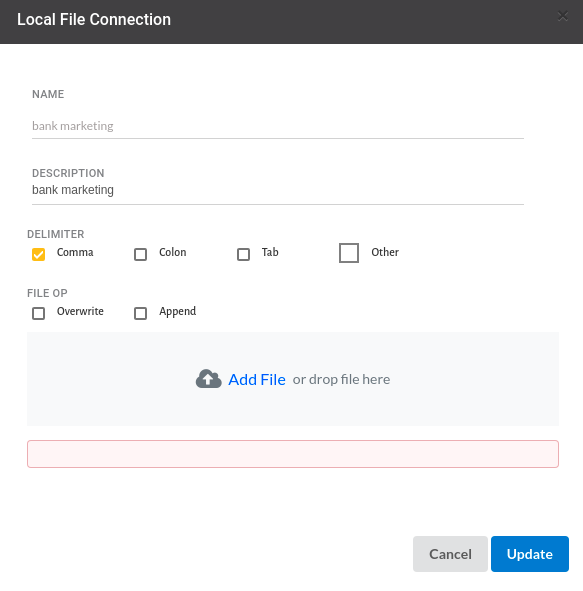
- From the Data Connections Page, upload the the dataset to Xceed Analytics. For more information on Data Connections refer to Data Connections
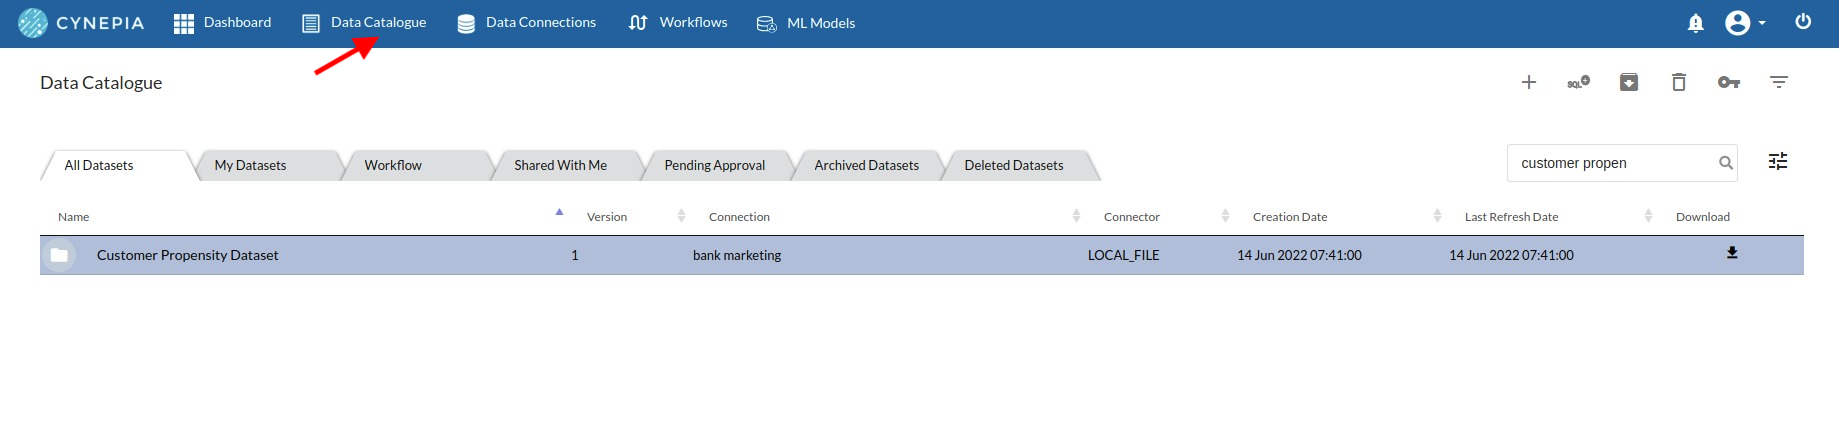
- Create a dataset for each dataset from the uploaded datasource in the data catalogue. Refer to Data Catalogue for more information on how to generate a dataset.
Create the Workflow for the experiment
- Create a Workflow by going to the Workflows Tab in the Navigation.Refer Create Workflow for more information.
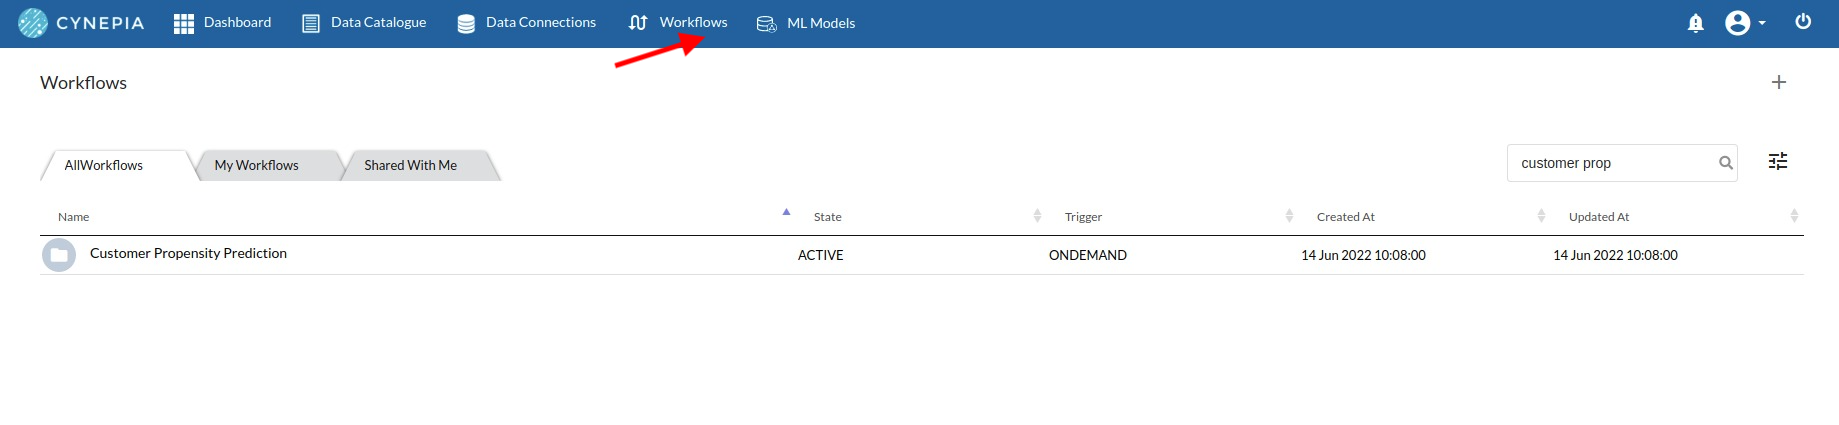
You will see entry on the workflow's page listing our workflow once it's been created.
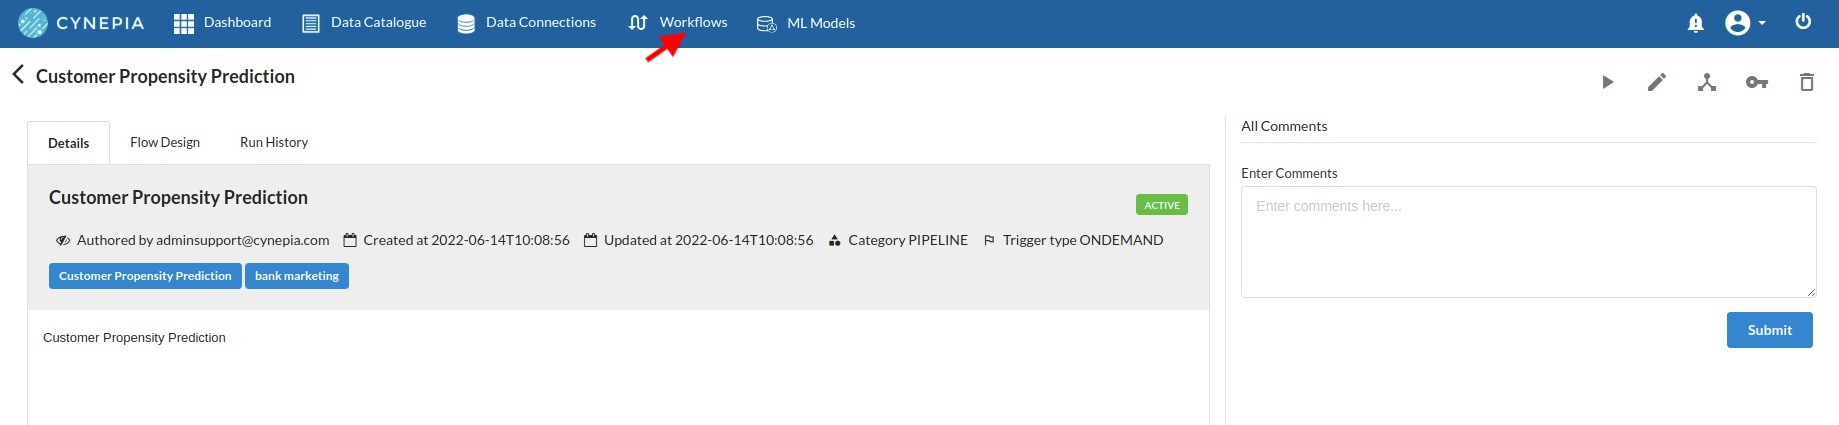
To navigate to the workflow Details Page, double-click on the Workflow List Item and then click Design Workflow. Visit the Workflow Designer Main Page for additional information.
- By clicking on + icon you can add the Input Dataset to the step view. The input step will be added to the Step View.
Perform initial exploration of data columns.
- Examine the output view with Header Profile, paying special attention to the column datatypes. for more information refer to output window
- Column Statistics Tab (Refer to Column Statistics for more details on individual KPI)
Perform Cleanup and Transform Operations
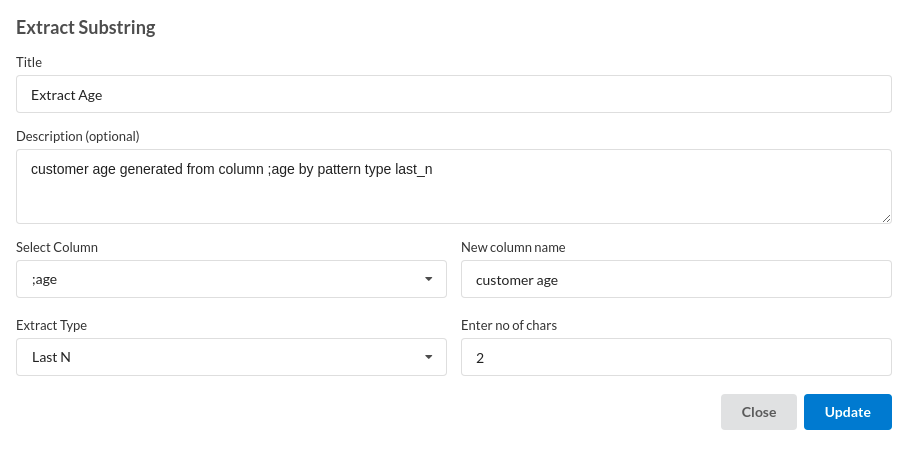
- Clean Age Column.
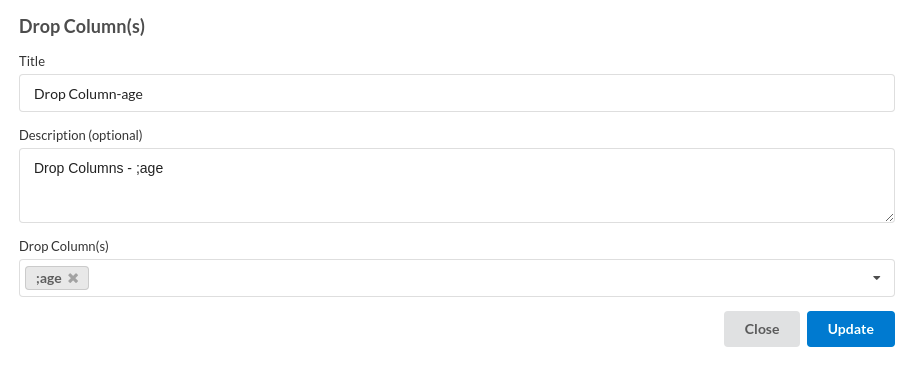
- Drop Unecessary Columns.
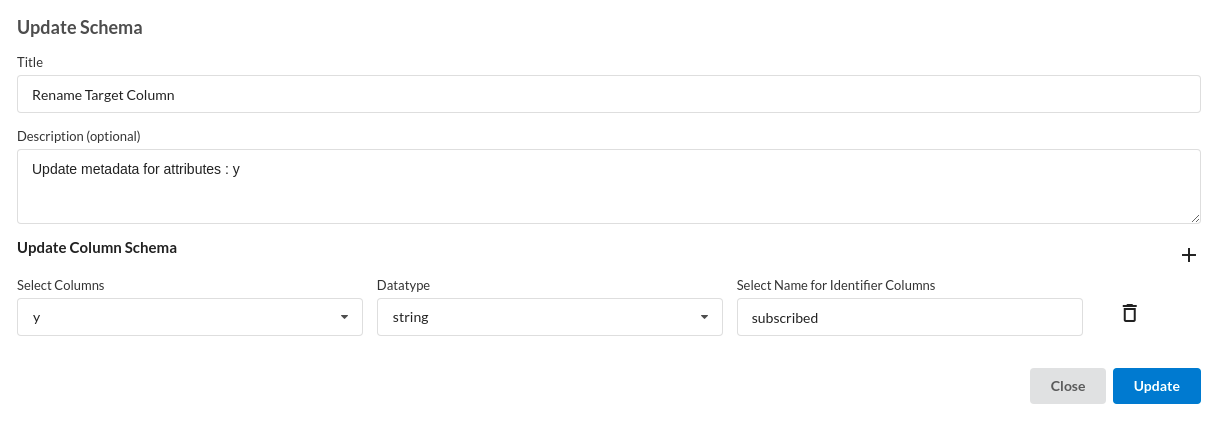
- Rename Target Column.
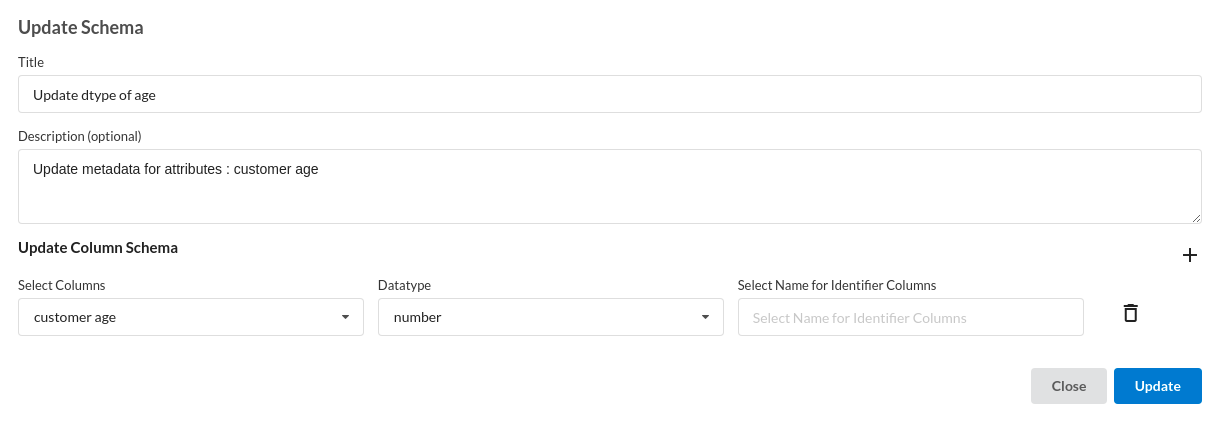
- Update datatype of Column.
Build/Train a classification Model
- You have a dataset to work with in order to create a classification model. Some of the actions to take before developing a model are listed below.
- Feature Selection
- Feature Encoding
- Choose the algorithm and train the model.
Feature Selection
- Go to the Column Profile View and select Multi-variate profile to construct a correlation matrix to manually identify the features of interest. The peason correlation is shown by Xceed Analytics. Select all of the columns that are strongly correlating to the target feature.
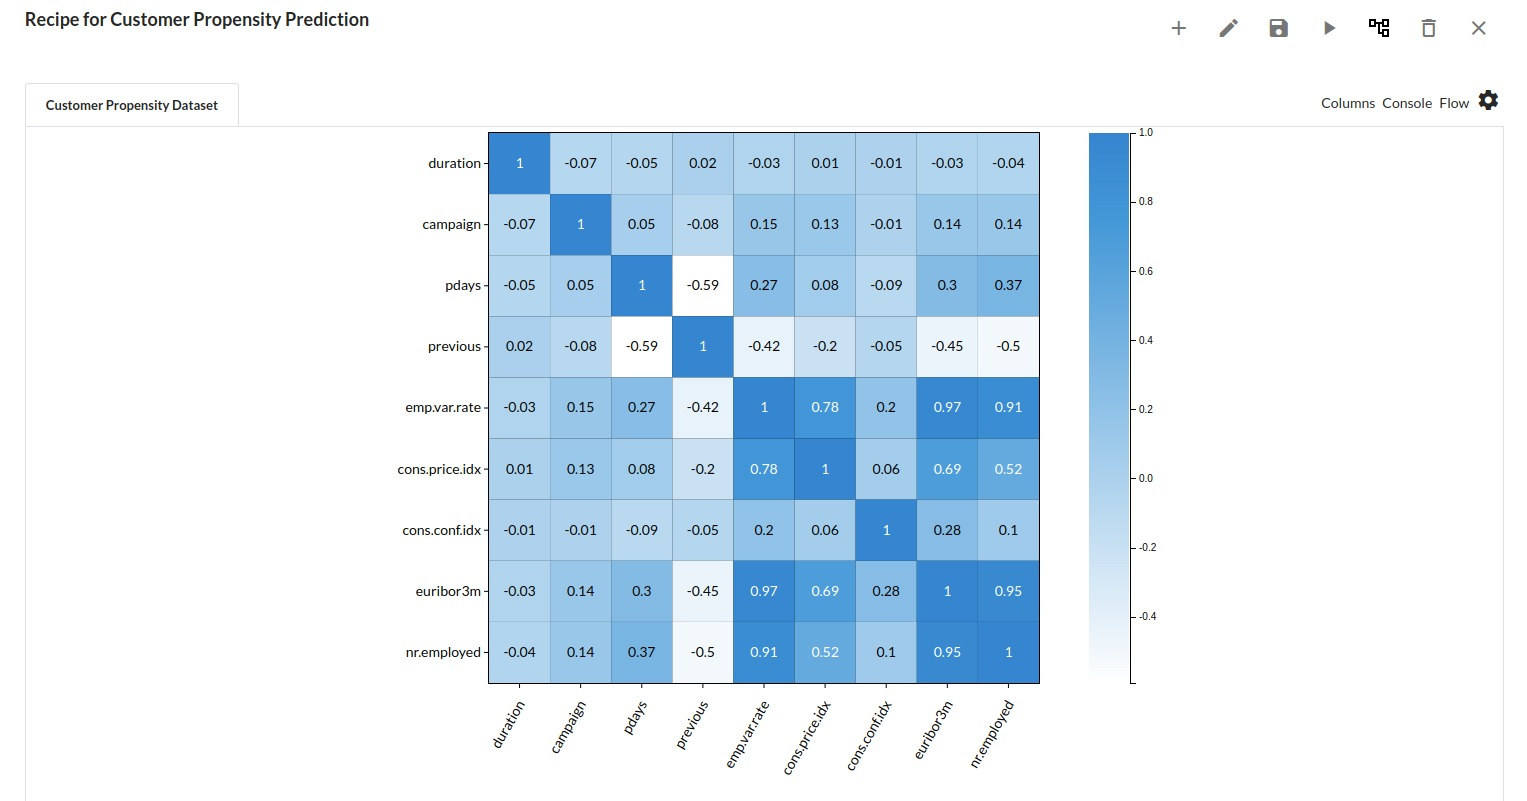
- Some of the features to chose that can explain the target variable based on the observed correlation are:
- duration
- campaign
- pdays etc.
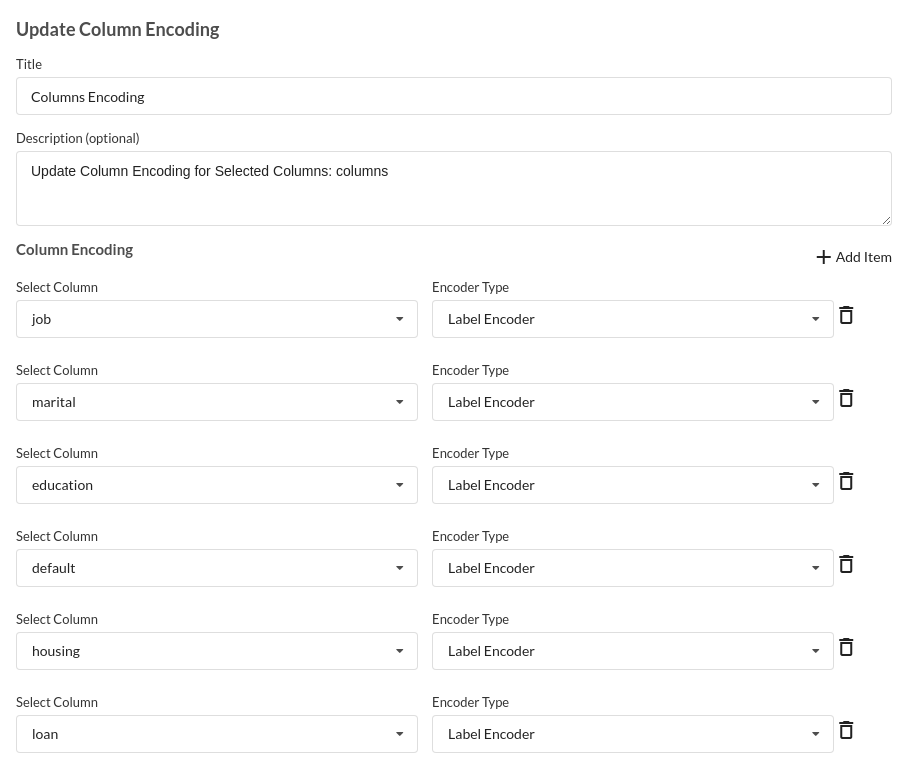
Feature Encoding
- Take all of the categorical columns and encode them based on the frequency with which they occur. for more infomation on this processor, refer to Feature Encoding
Choose the algorithm and train the model.
- You are estimating a categorical variable- genetic disorder for the prediction model. From the Transformer View, select Classification(auto pilot) andfill in the relevant information.
Review the model output and Evaluate the model
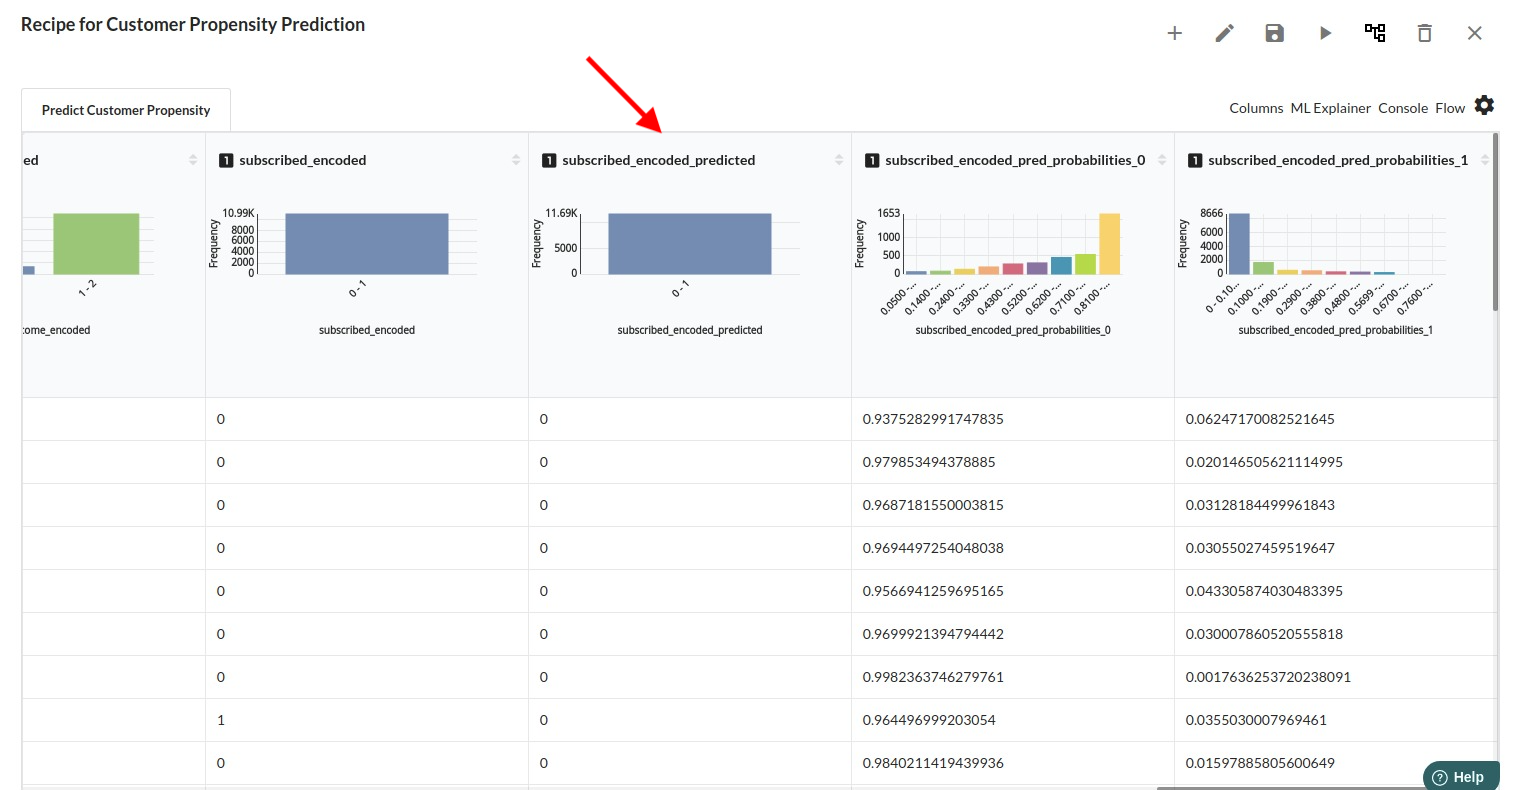
After you finish building the model, it is time to review the model output. Look at the output window to first review your predicted results .You will get a new column in the view like the one below.
When you finish building your model you will see another tab in the view called Ml explainer . Click on that to evaluate your model.
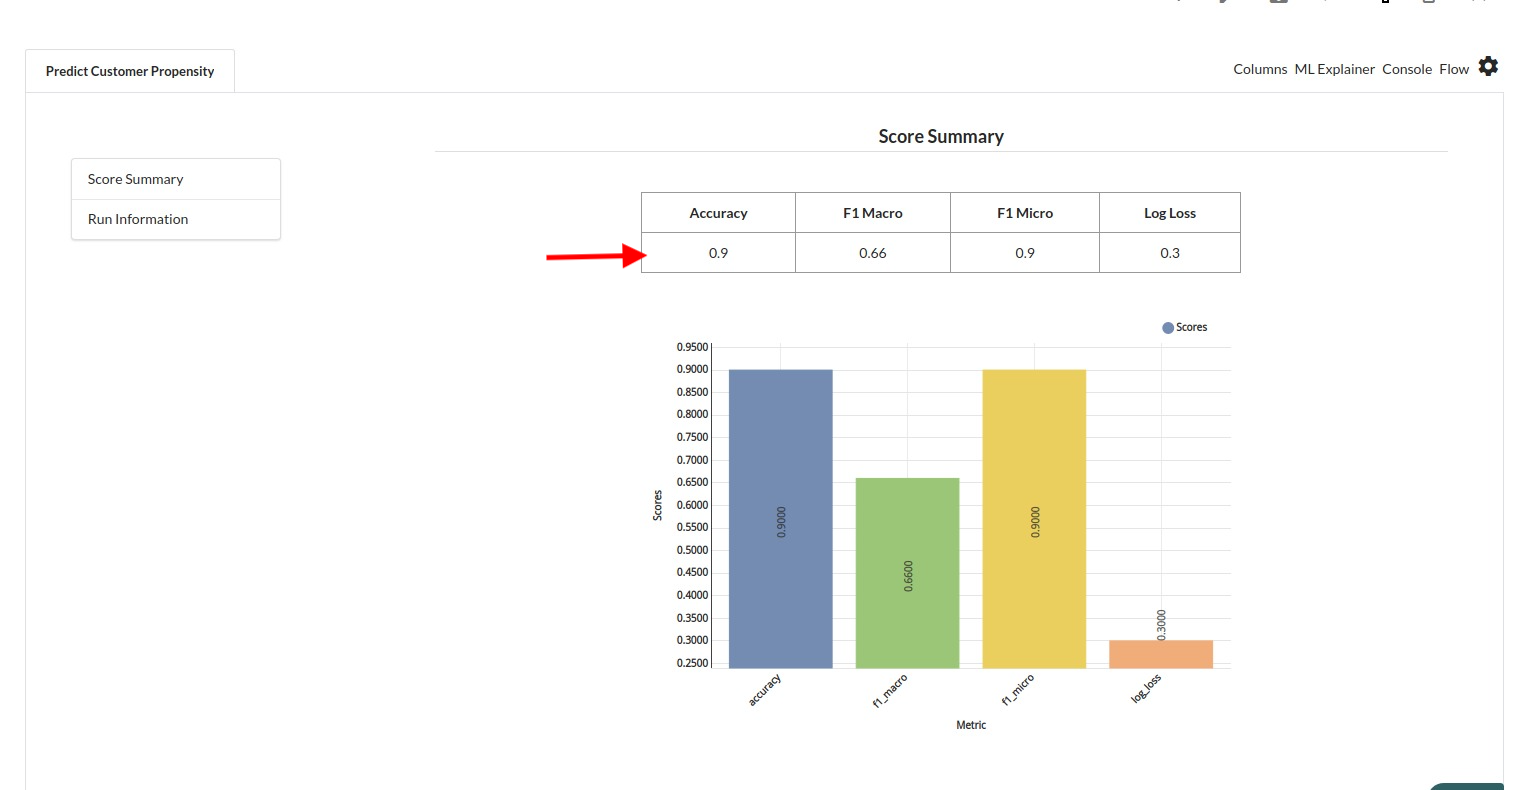
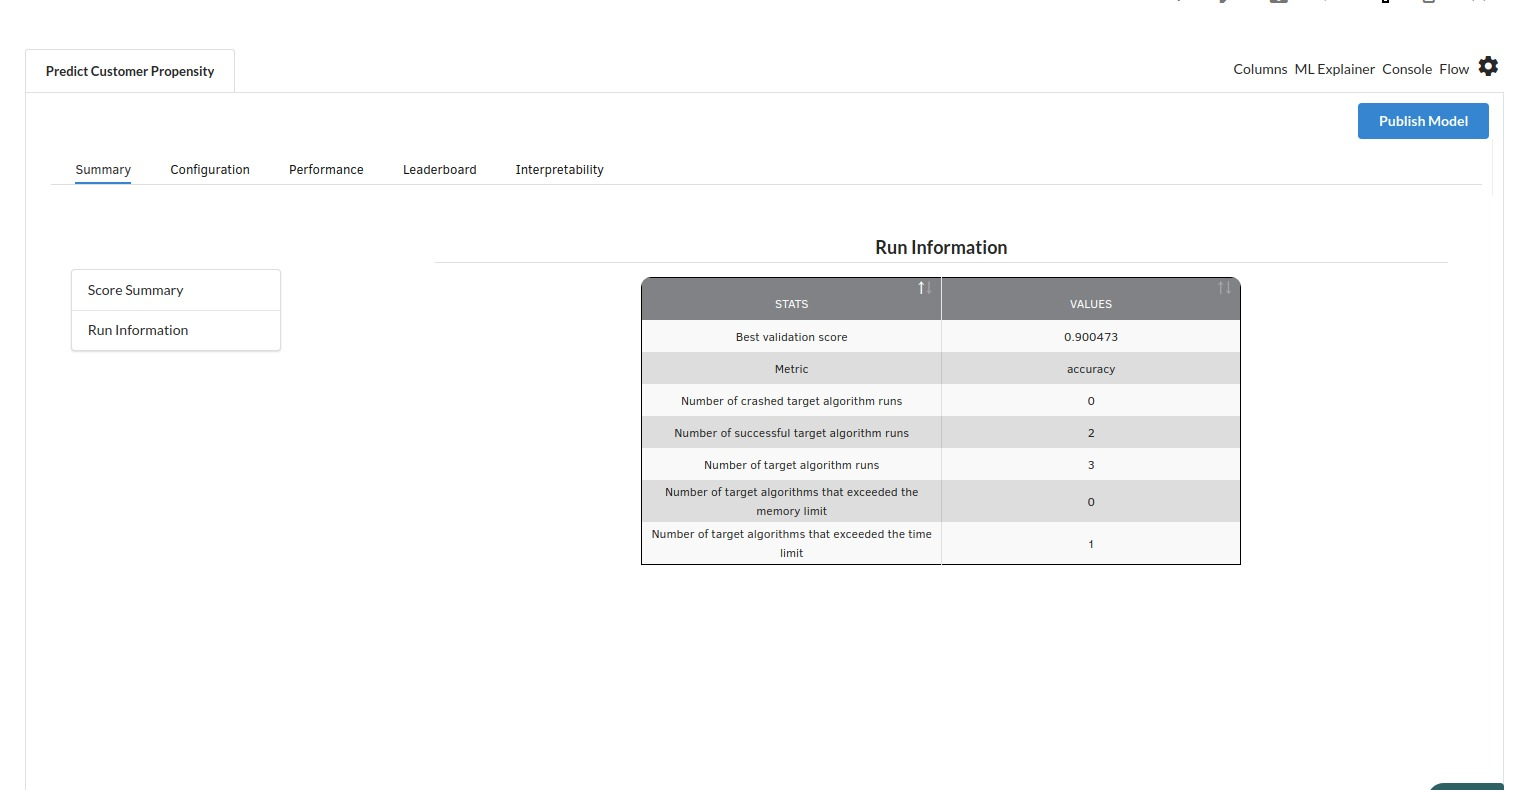
- The first view you see when you click on ML explainer is the Summary view
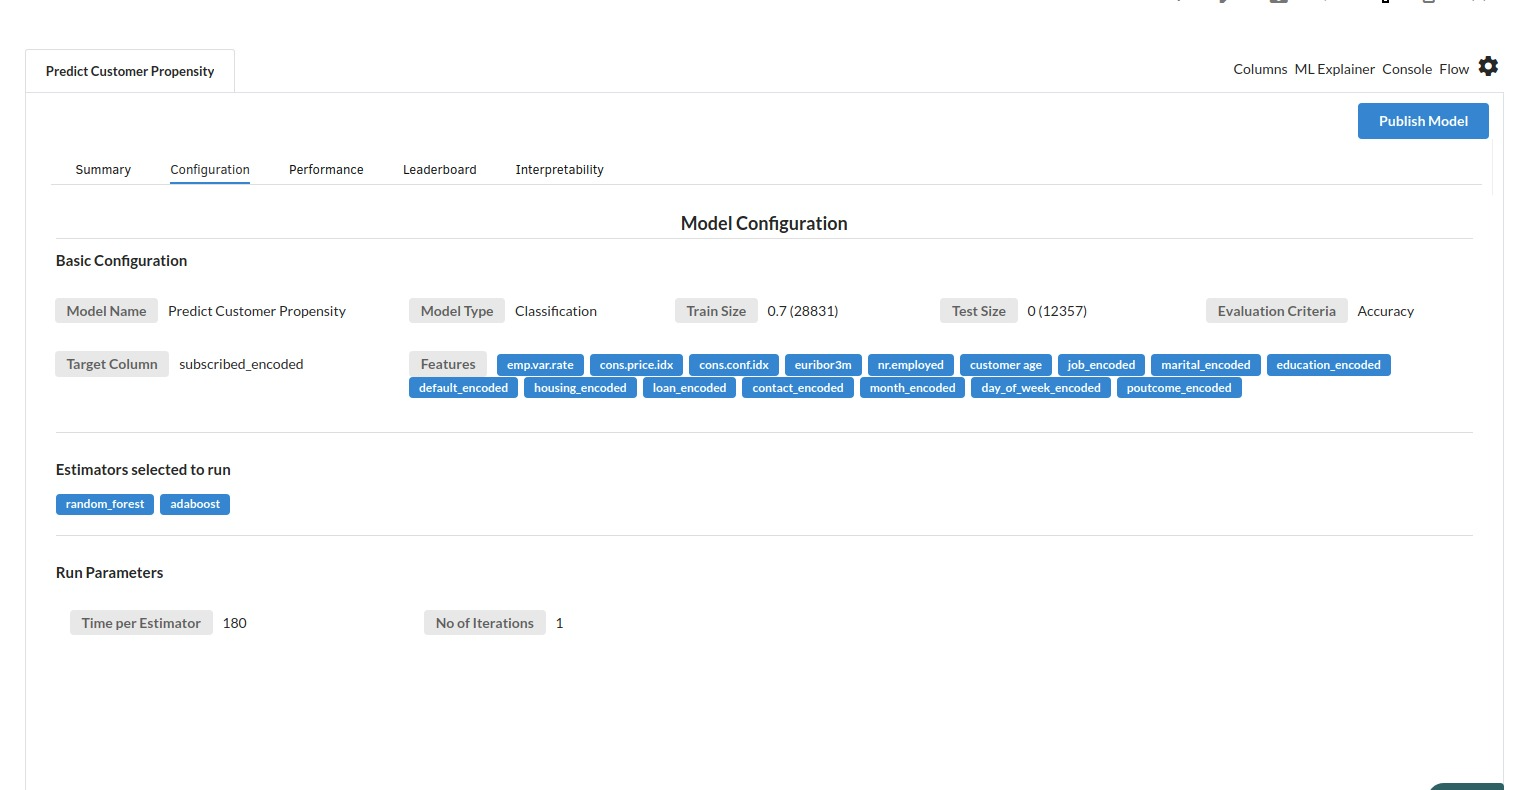
- The second view under Ml explainer is configuration view
The configuration view will give you the information about the step you filled in the Classification step . The view would look like the one below. 163,0-1 85%
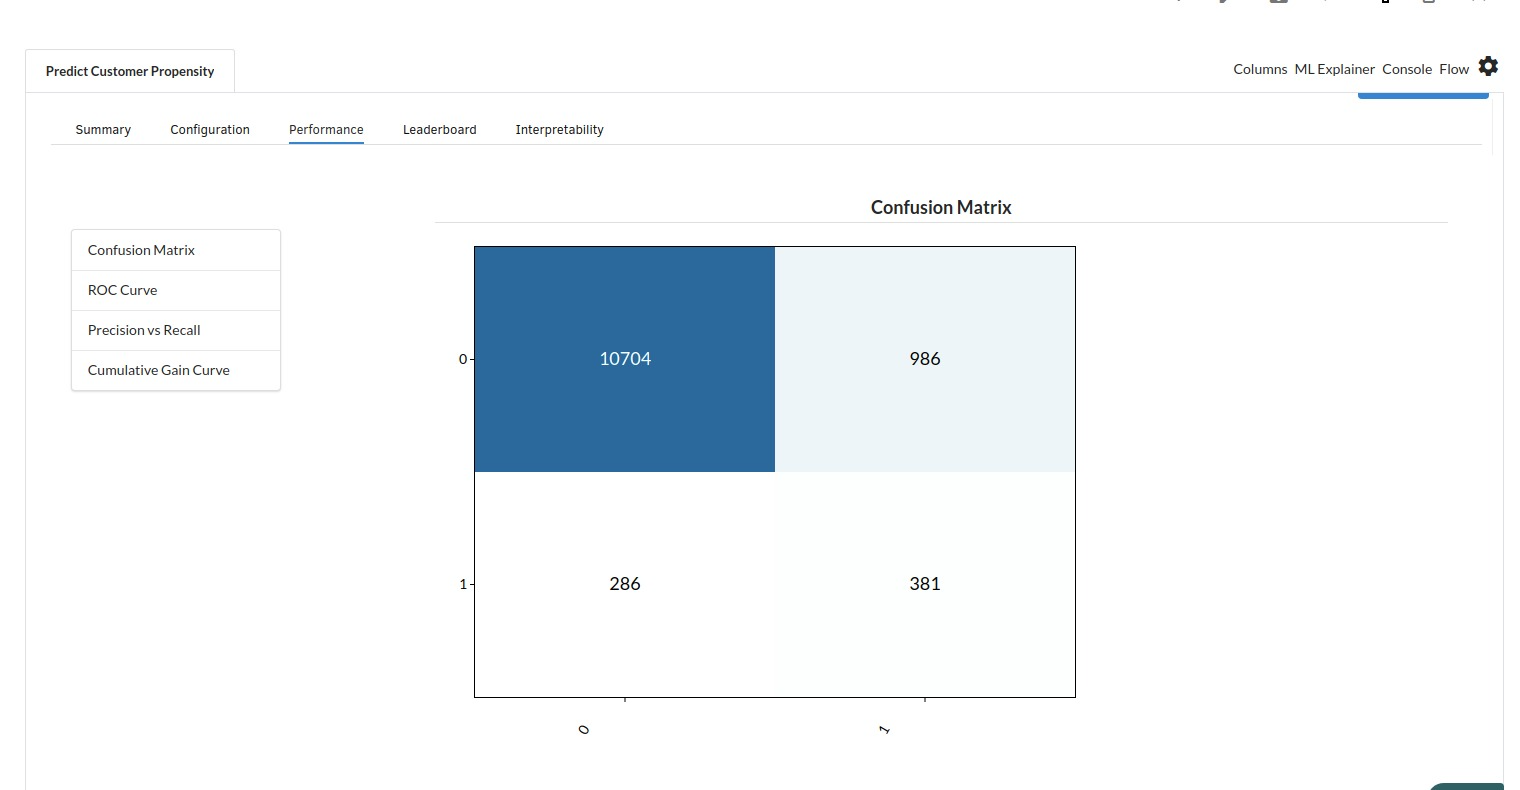
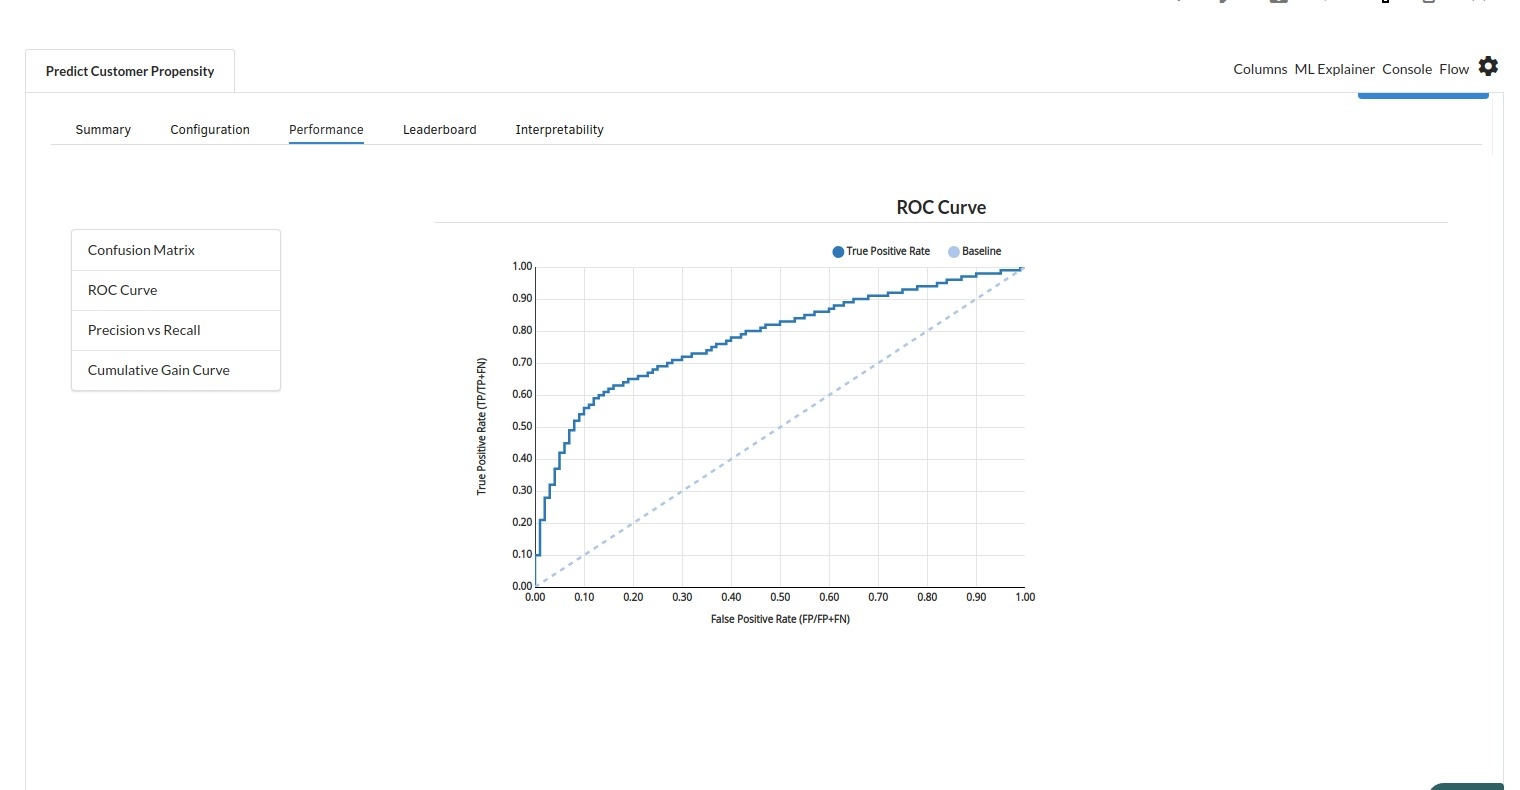
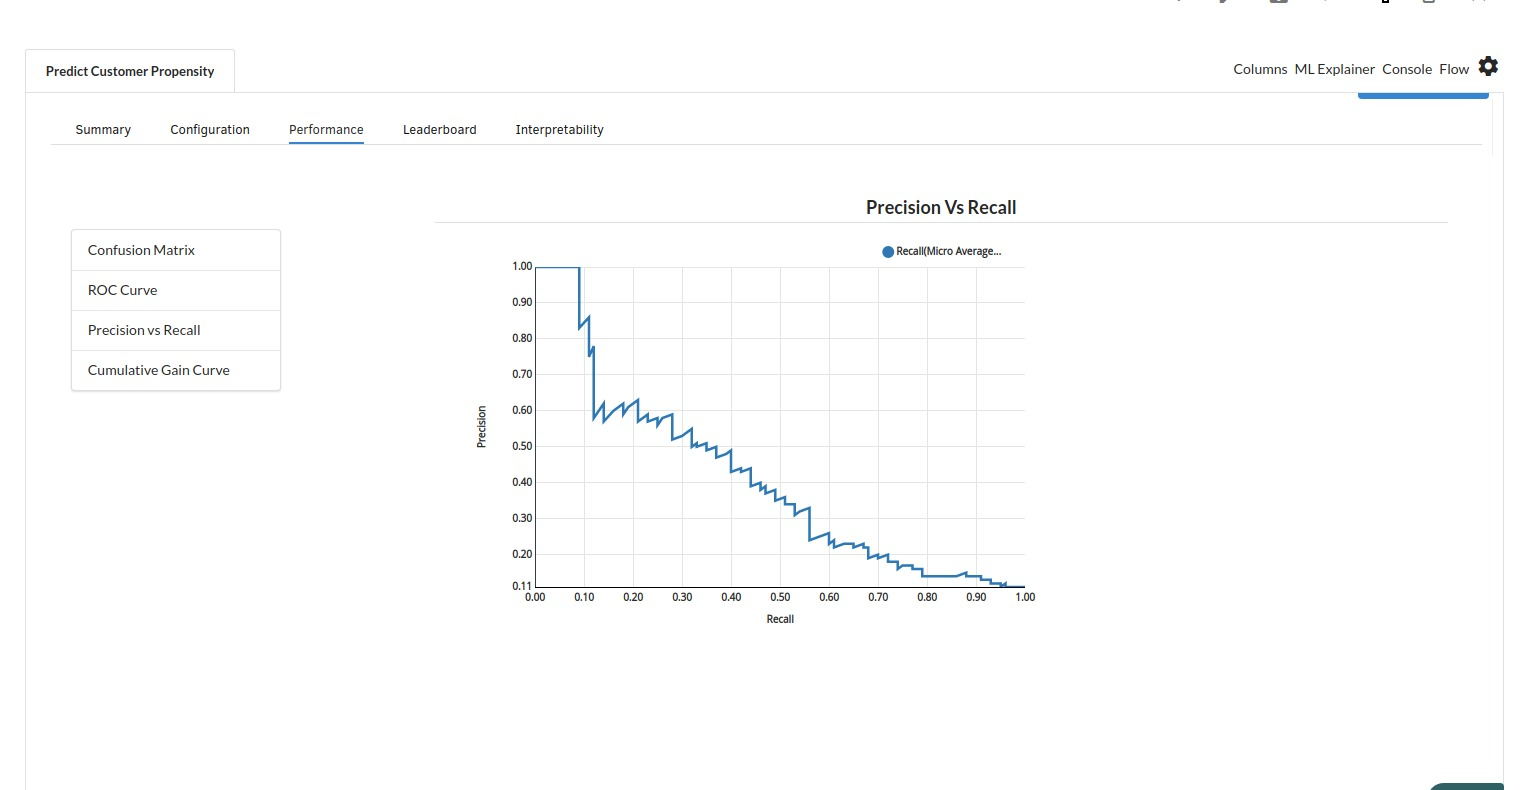
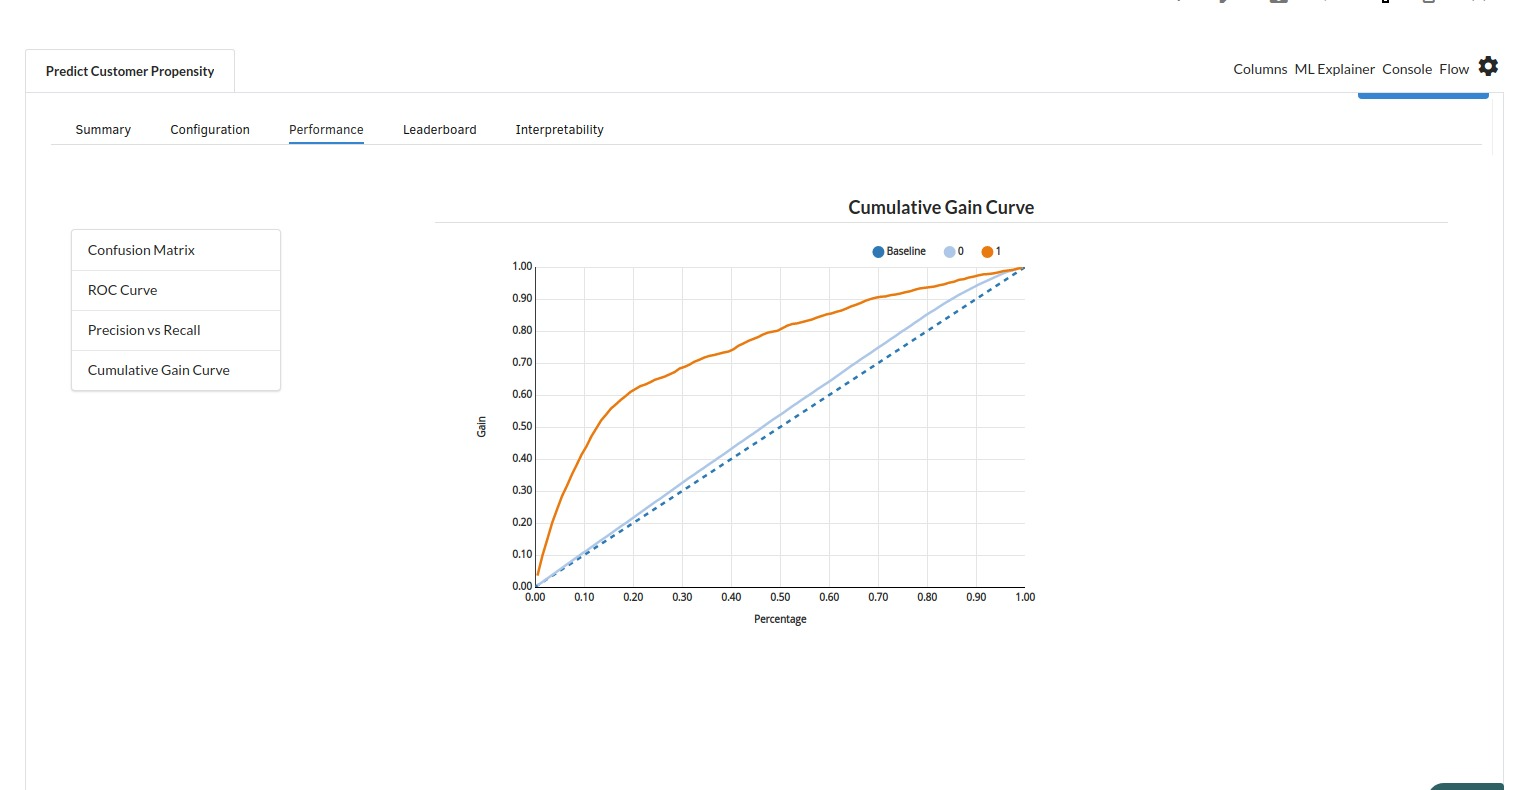
The third view under Ml explainer is Performance View . You can see confusion matrix ,ROC Curve, Precision vs Recall and Cumulative Gain Curve. Look at the built charts and decide if the charts are good enough for your model. The confusion matrix is a good indicator to understand how well your model was trained.
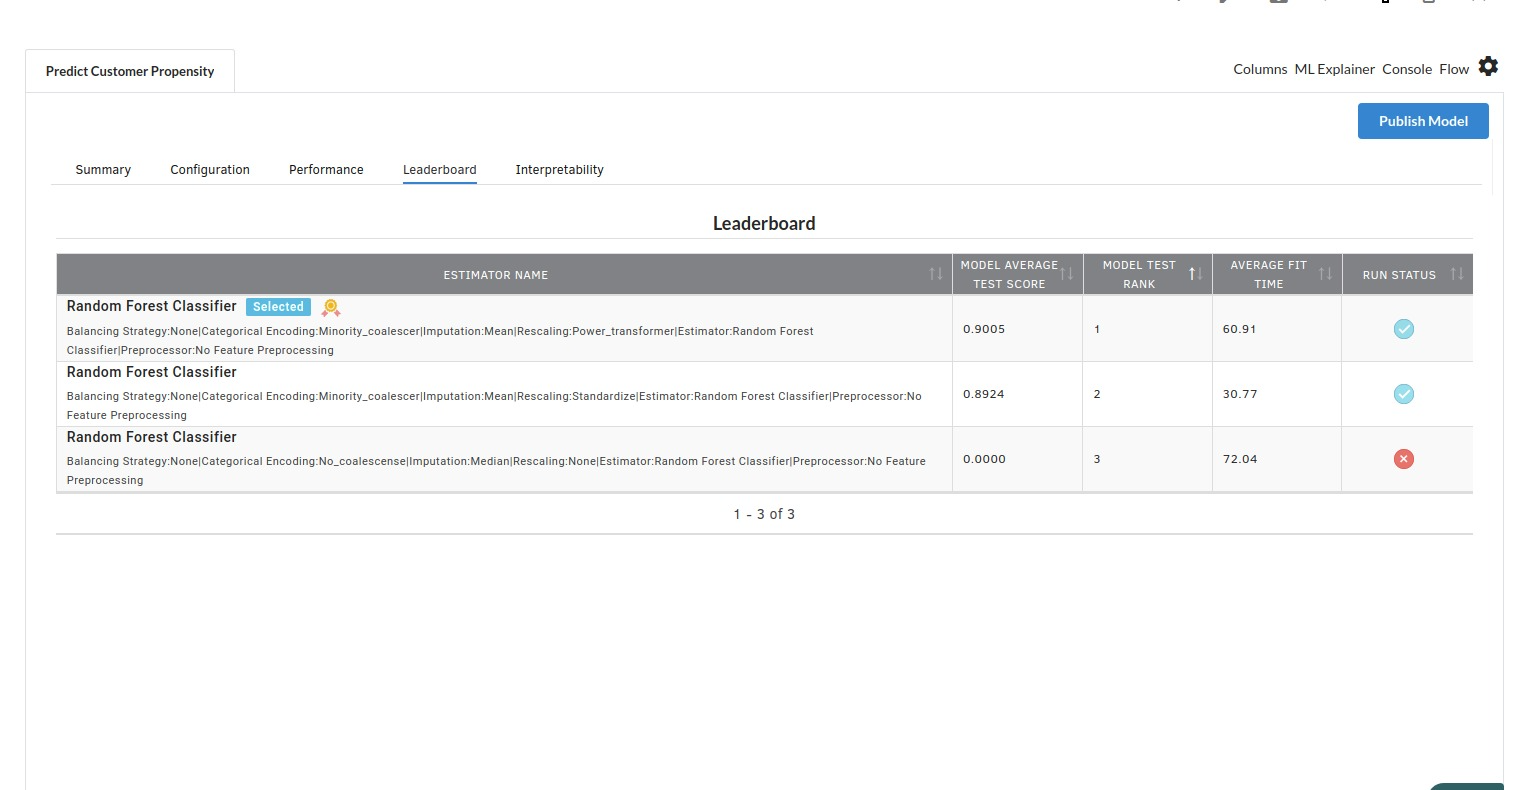
- The fourth view under Ml explainer is Leaderboard . In this view you can see the number of algorithms trained and all the feature engineering done on the algorithms used with ranking system to rank the best algorithm trained.
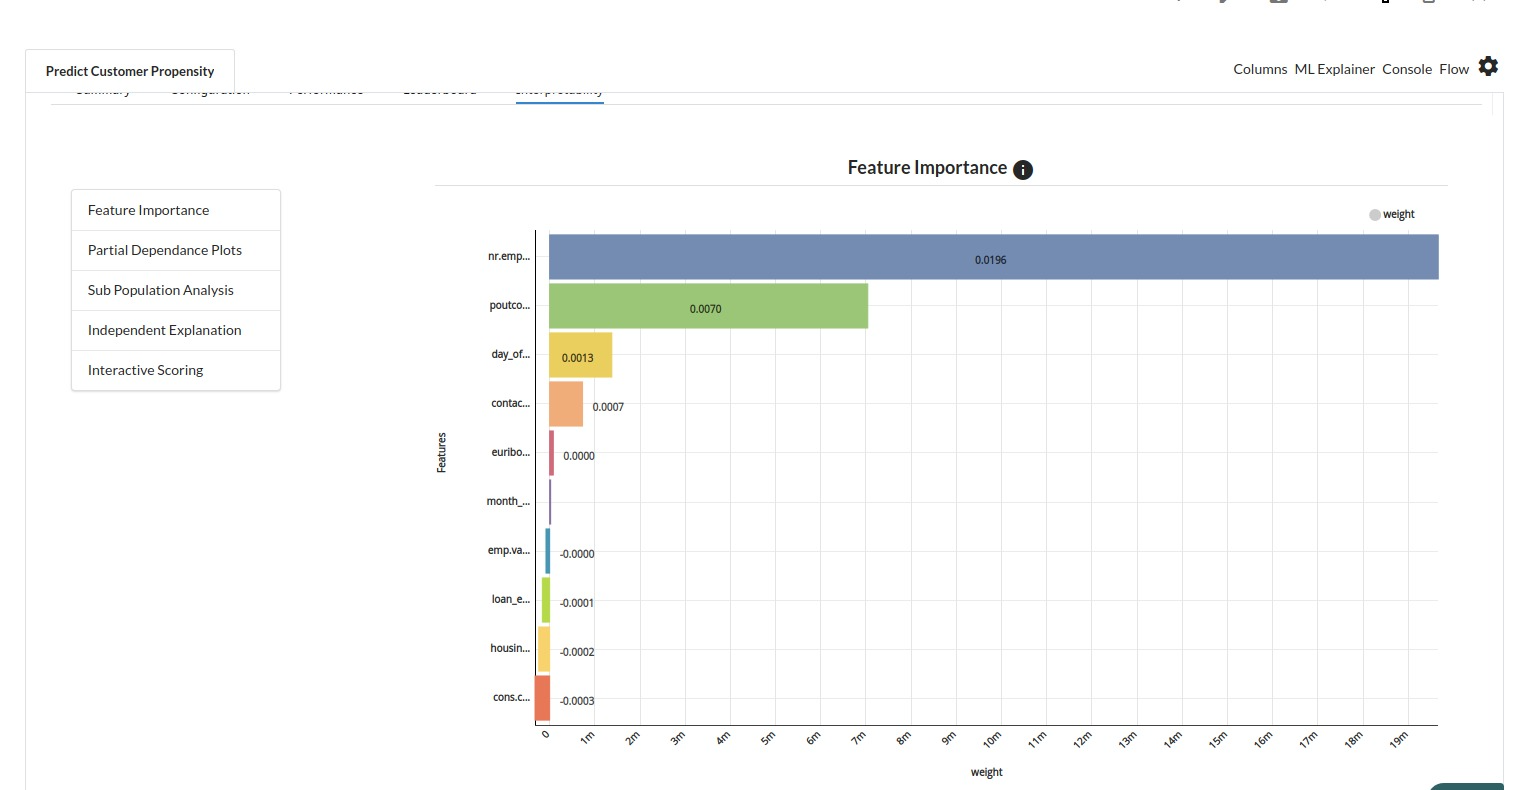
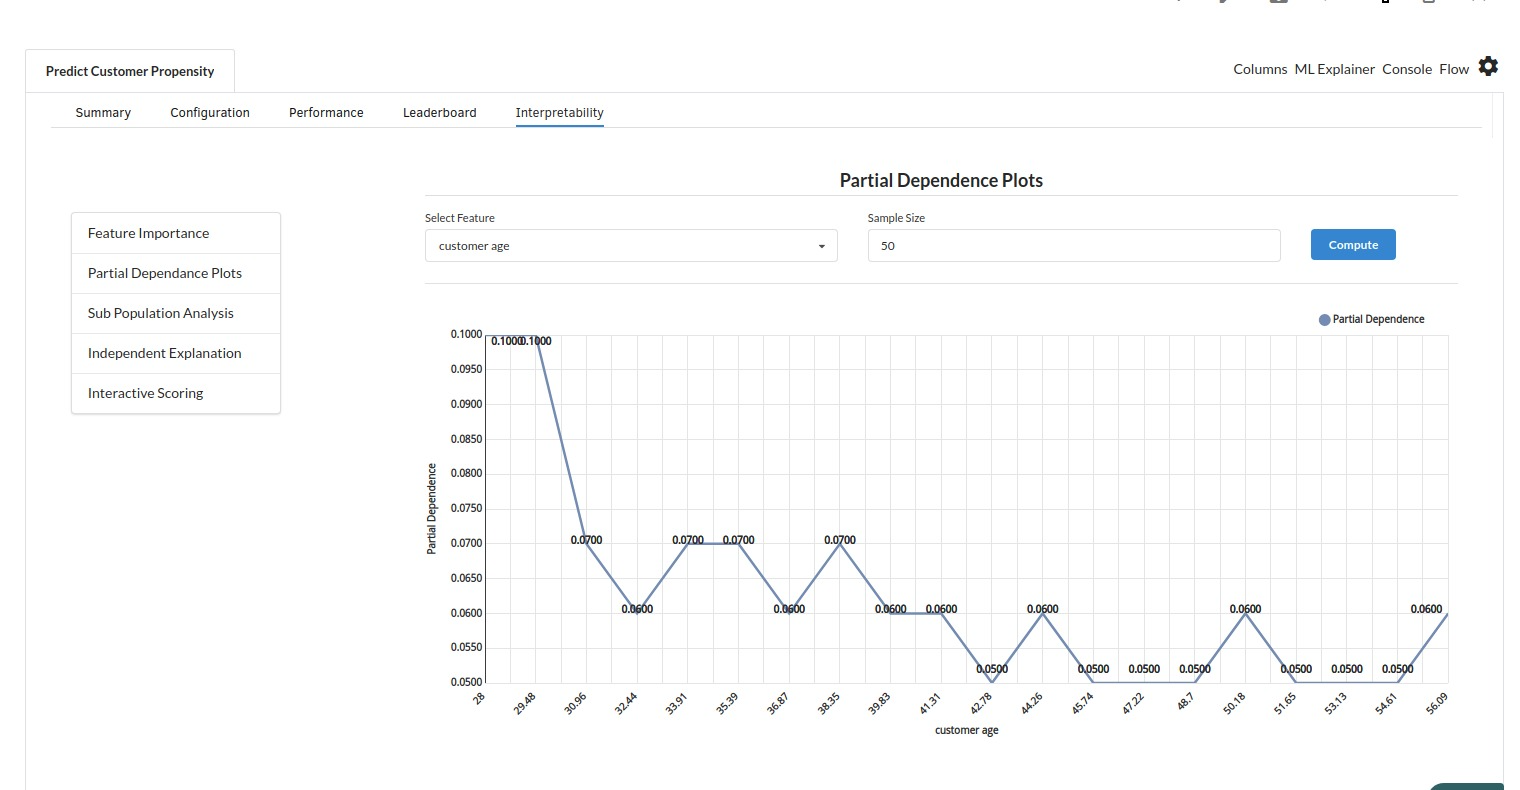
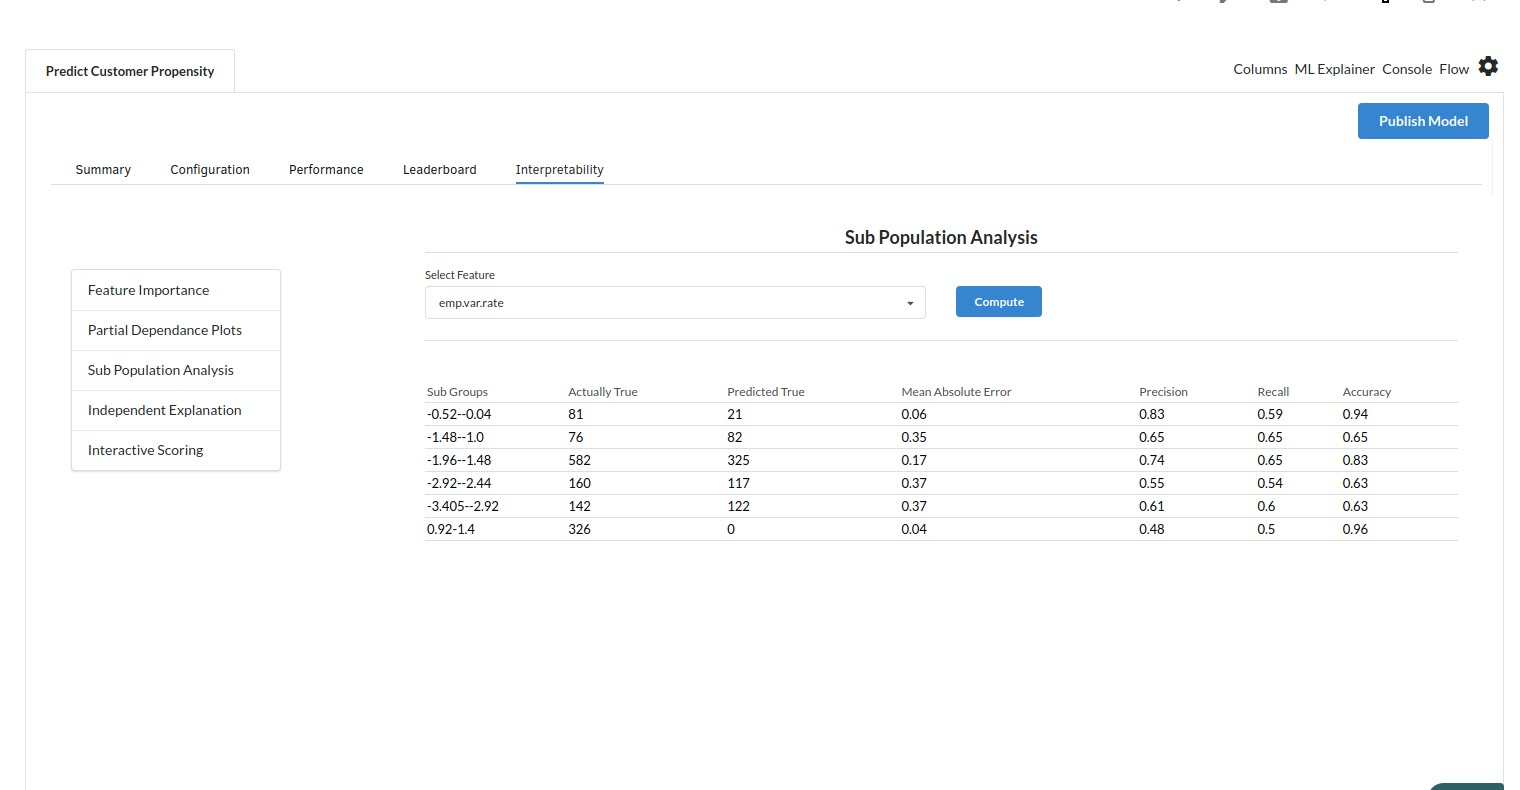
- The last view you see under ML explainer is Interpretability . In this view you will be able to interpret your model in simple terms where you will be getting results pertaining to feature importance , PDP Plots , Sub Population Analysis , Independant Explanation , Interactive Scoring . for more infomation on these results , refer to Interpretability . The Interpretability tab and the results under this tab would look like the one below.