Fradulent Claim on Car Damage

Background
Physical damage fraud is most commonly associated with auto insurance fraud, in which a person claims compensation from an insurance company for vehicle damage or theft that the insurance company should not cover. This can happen to a first-party or third-party.Insurance fraud is committed by the following individuals:
- Ordinary people who want to cover their deductible or see filing a claim as an opportunity to make a little money,
- Organized criminals who steal large sums through fraudulent business activities,
- Professionals and technicians who inflate service costs or charge for services not rendered
Auto insurance fraud includes everything from falsifying information on insurance applications to inflating insurance claims, as well as staging incidents and filing claim forms for injuries or damage that never happened and fake reports of stolen automobiles.It's critical to understand which assertions are true and which are false. Insurance firms are unable to personally examine all claims since doing so would be prohibitively expensive in terms of both time and money. They take advantage of the insurers' most valuable asset in the fight against fraud: data.By utilizing numerous features concerning claims, covered persons, and other circumstances that the insurer has included in the data, different types of claims and the rates of fraud within those groups can be differentiated. This yields fresh insights.Given the variety of fraud types and the low ratio of known frauds in typical samples, detecting insurance fraud is a challenging task.
Objective
This usecase helps detect auto insurance fraud based on the insurance claim dataset. The challenge here is that frauds are significantly less common than legitimate insurance claims.Output can be used to be cautious about such claims.
Relevance of Xceed Analytics
Xceed Analytics provides a single integrated data and AI platform that reduces friction in bring data and building machine models rapidly. It further empowers everyone including Citizen Data Engineers/Scientist to bring data together and build and delivery data and ml usecases rapidly. It's Low code/No code visual designer and model builder can be leveraged to bridge the gap and expand the availability of key data science and engineering skills.
This usecase showcases how to create, train/test, and deploy a fraudulent claim detection/prediction classification model. The datasets are obtained from Kaggle. Insurance claims dataset is used for this purpose .Xceed will provide a NO-CODE environment for the end-to-end implementation of this project, starting with the uploading of datasets from numerous sources to the deployment of the model at the end point. All of these steps are built using Visual Workflow Designer, from analyzing the data to constructing a model and deploying it.
Data Requirements
The dataset that is used here includes :
- Insurance Claim dataset : contains insurance claims information.
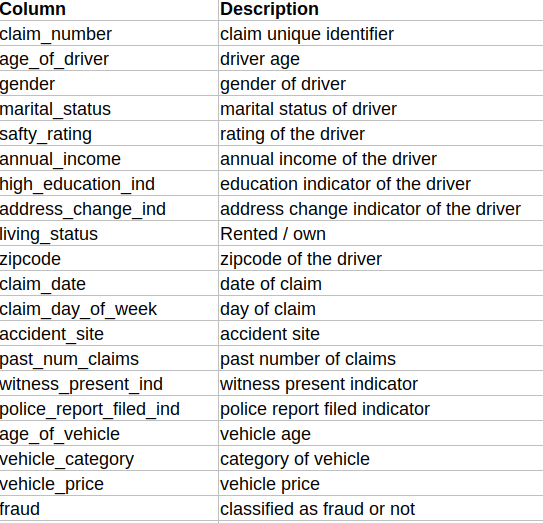
Columns of interest in the dataset
Model Objective
Understanding trends in insurance claims over time and predicting which claims are likely to be fraudulent by analysing the underlying data, constructing a classification machine learning model, and implementing it after defining the model's major features.
Steps followed to develop and deploy the model
- Upload the data to Xceed Analytics and create a dataset
- Create the Workflow for the experiment
- Perform initial exploration of data columns.
- Perform Cleanup and Tranform operations
- Build/Train a classification model
- Review the model output and Evaluate the model
- Improve on the metrics which will be useful for the productionizing
- Deploy/Publish the model
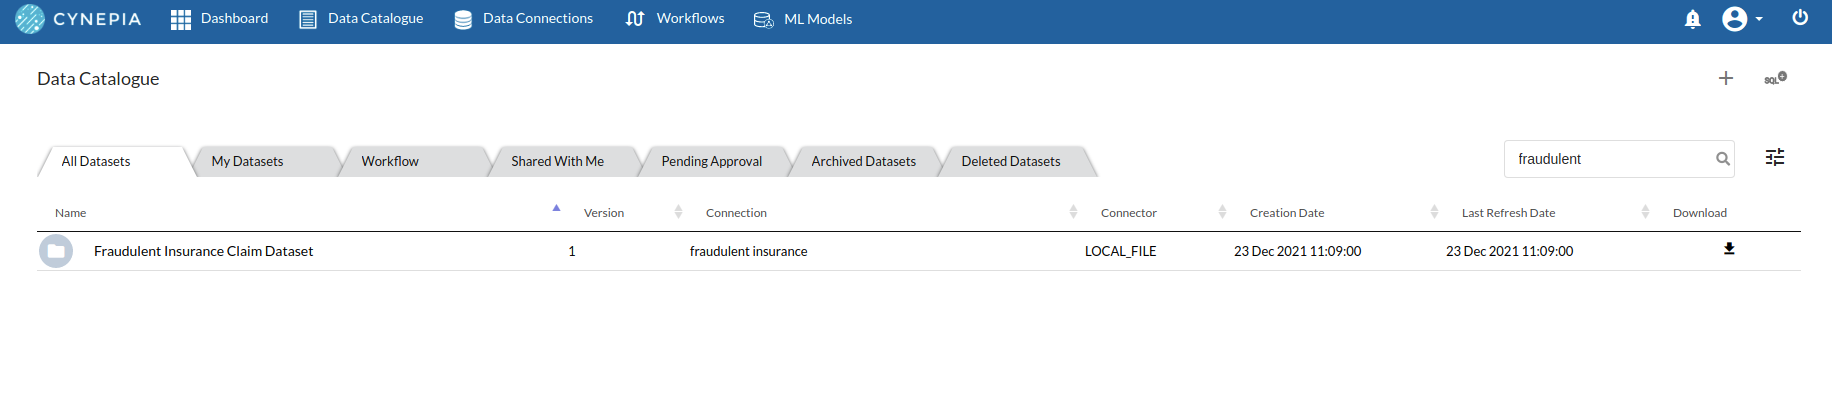
Upload the data to Xceed Analytcs and Create the dataset
- From the Data Connections Page, upload the the dataset to Xceed Analytics. For more information on Data Connections refer to Data Connections
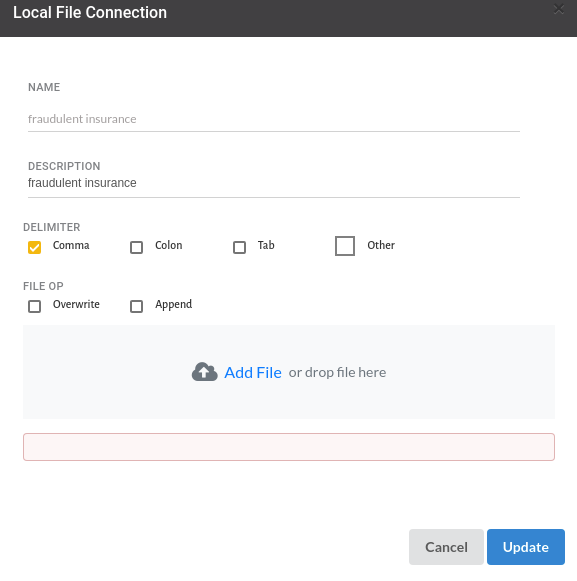
- Create a dataset for each dataset from the uploaded datasource in the data catalogue. Refer to Data Catalogue for more information on how to generate a dataset.
Create the Workflow for the experiment
- Create a Workflow by going to the Workflows Tab in the Navigation.Refer Create Workflow for more information.
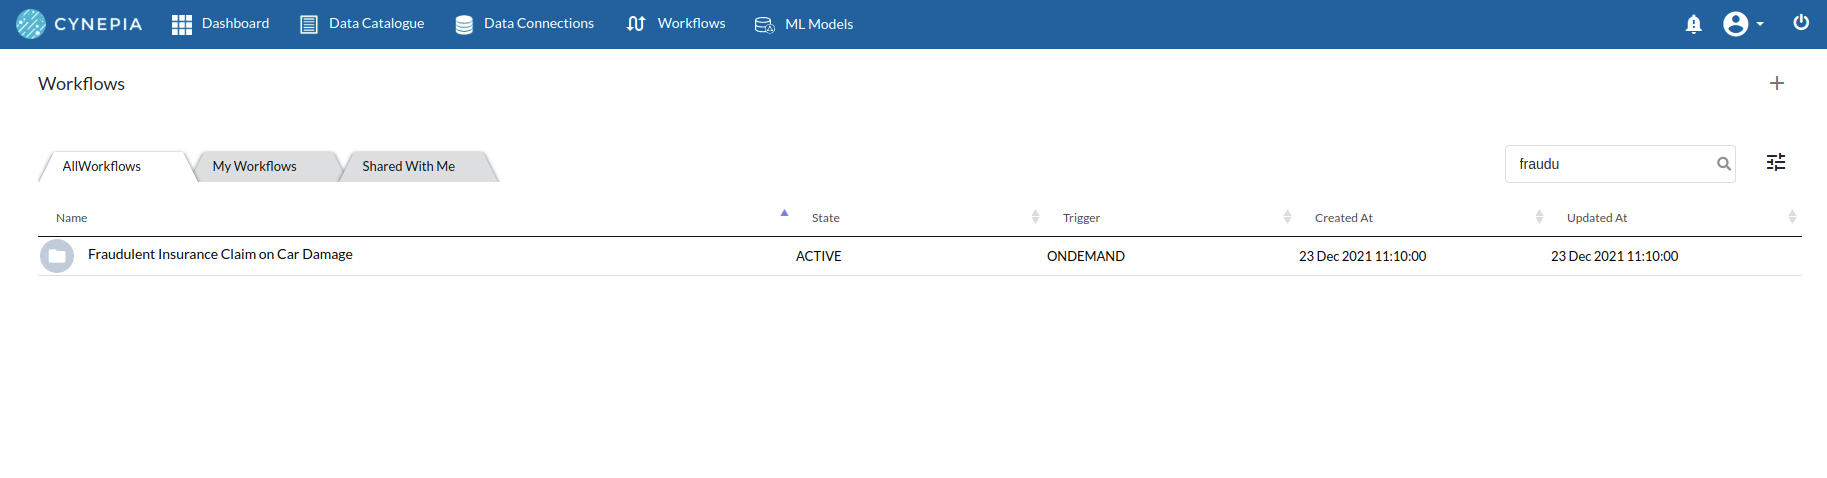
- You will see entry on the workflow's page listing our workflow once it's been created.
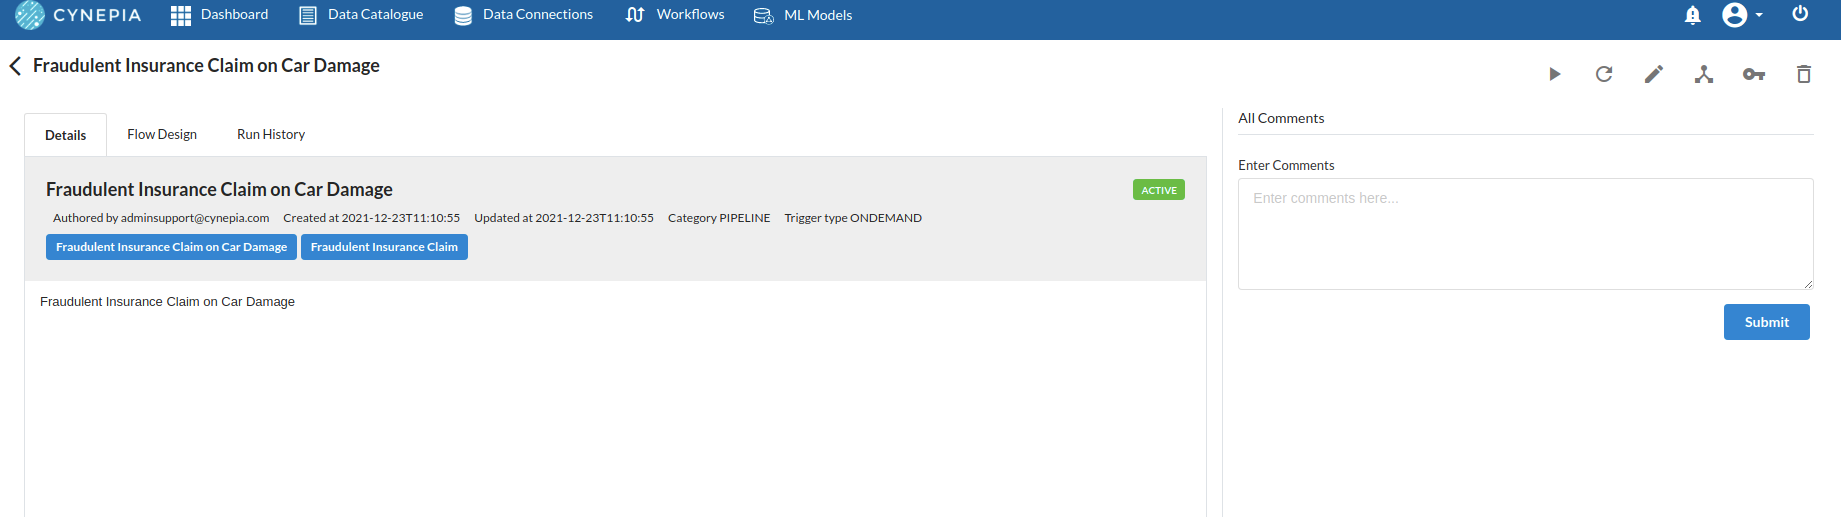
- To navigate to the workflow Details Page, double-click on the Workflow List Item and then click Design Workflow. Visit the Workflow Designer Main Page for additional information.
- By clicking on + icon you can add the Input Dataset to the step view. The input step will be added to the Step View.
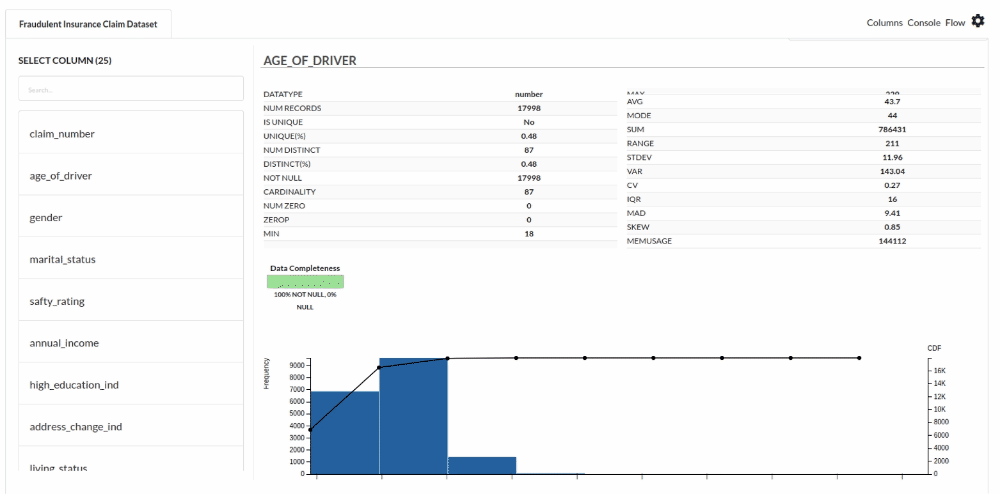
Perform initial exploration of data columns.
- Examine the output view with Header Profile, paying special attention to the column datatypes. for more information refer to
output window
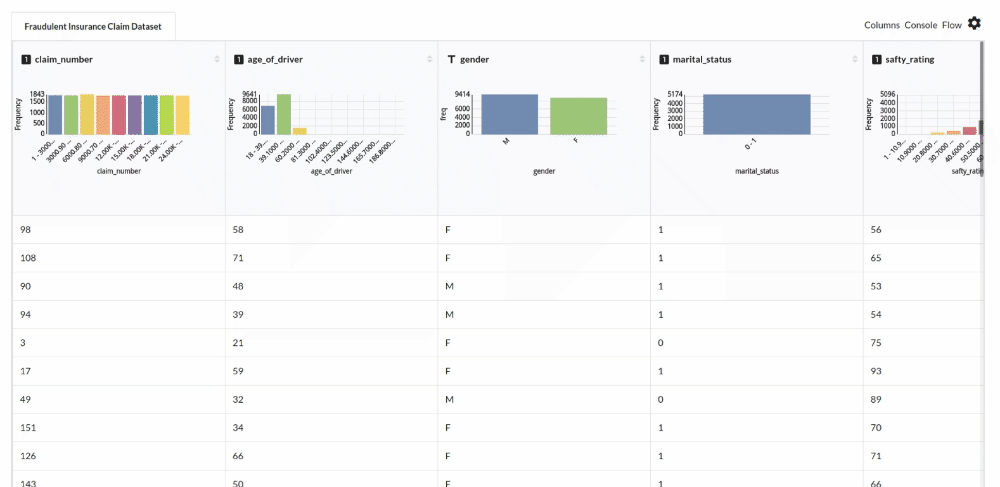
- Column Statistics Tab (Refer to Column Statistics for more details on individual KPI)
Perform Cleanup and Transform Operations
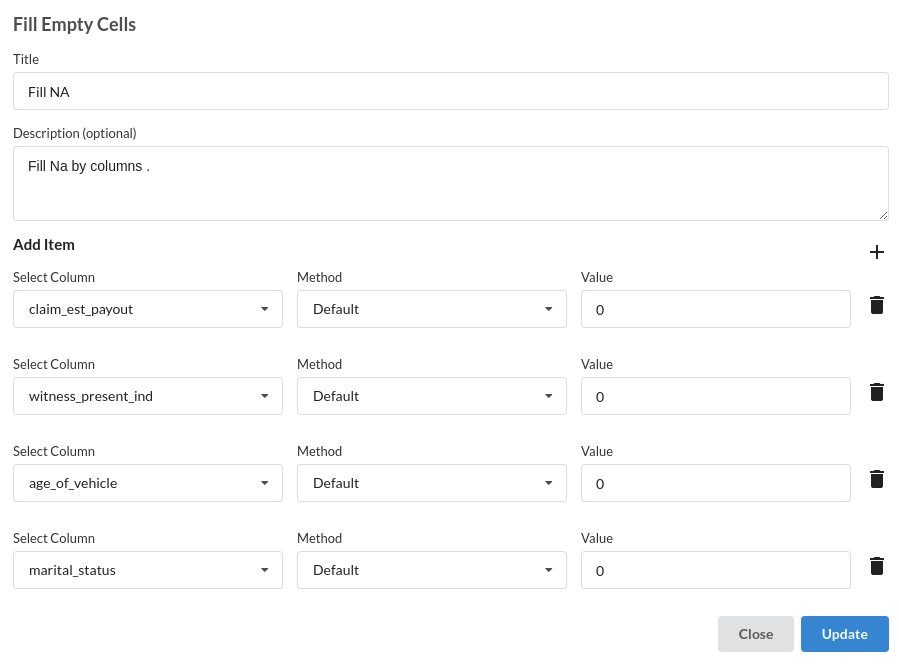
- Fill Null values. Refer Fill Null Values
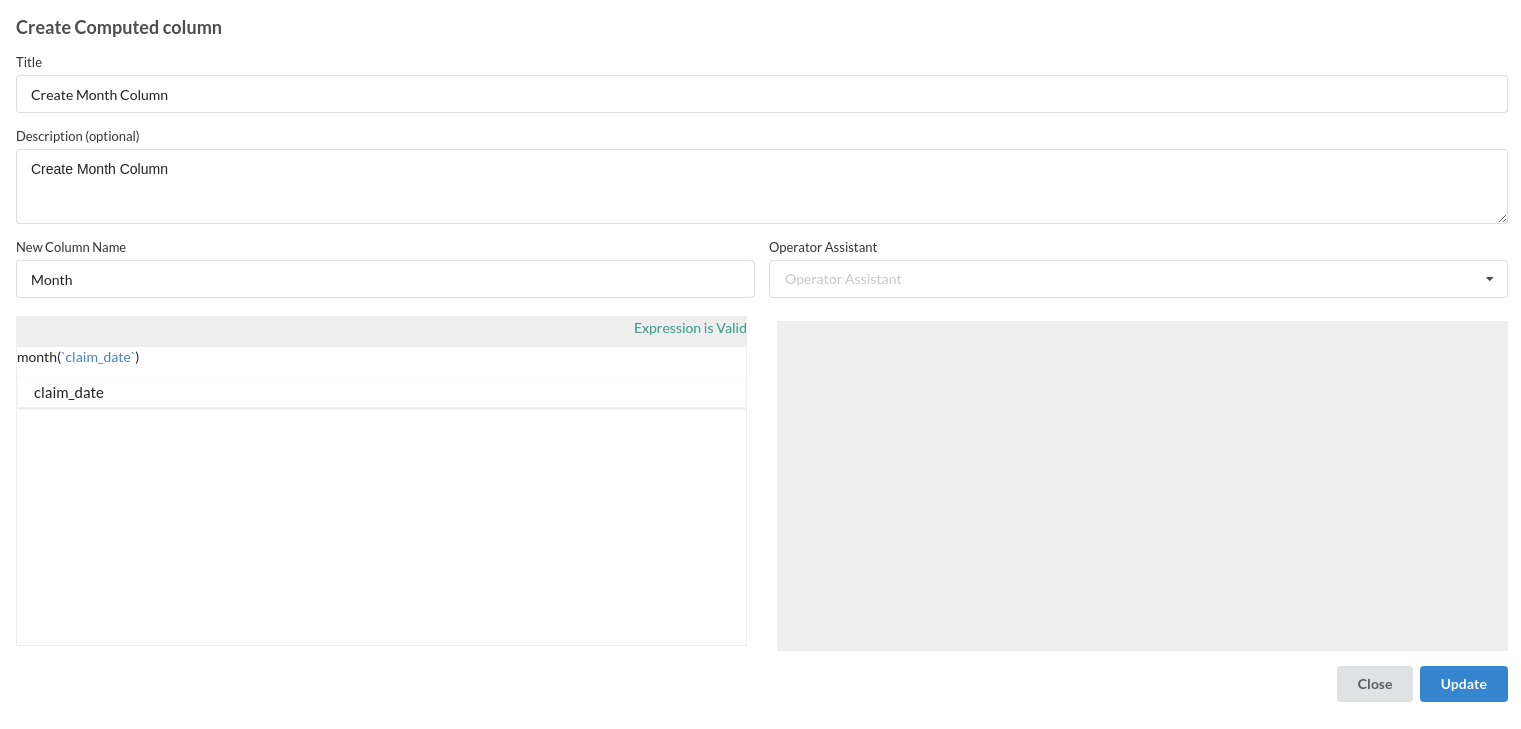
- Create Month Column. This column is created using Calculate Processor
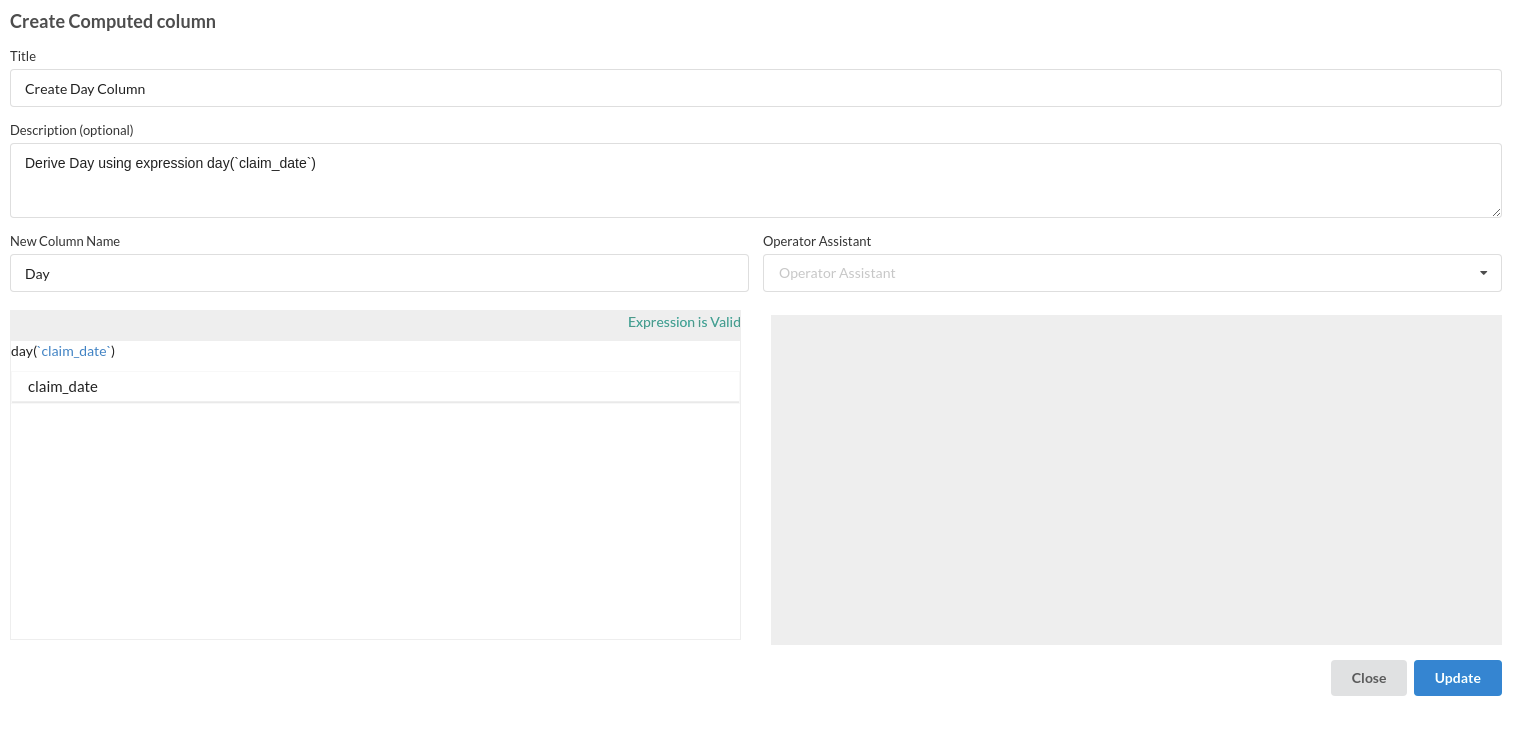
- Create Day Column . This column is created using Calculate Processor
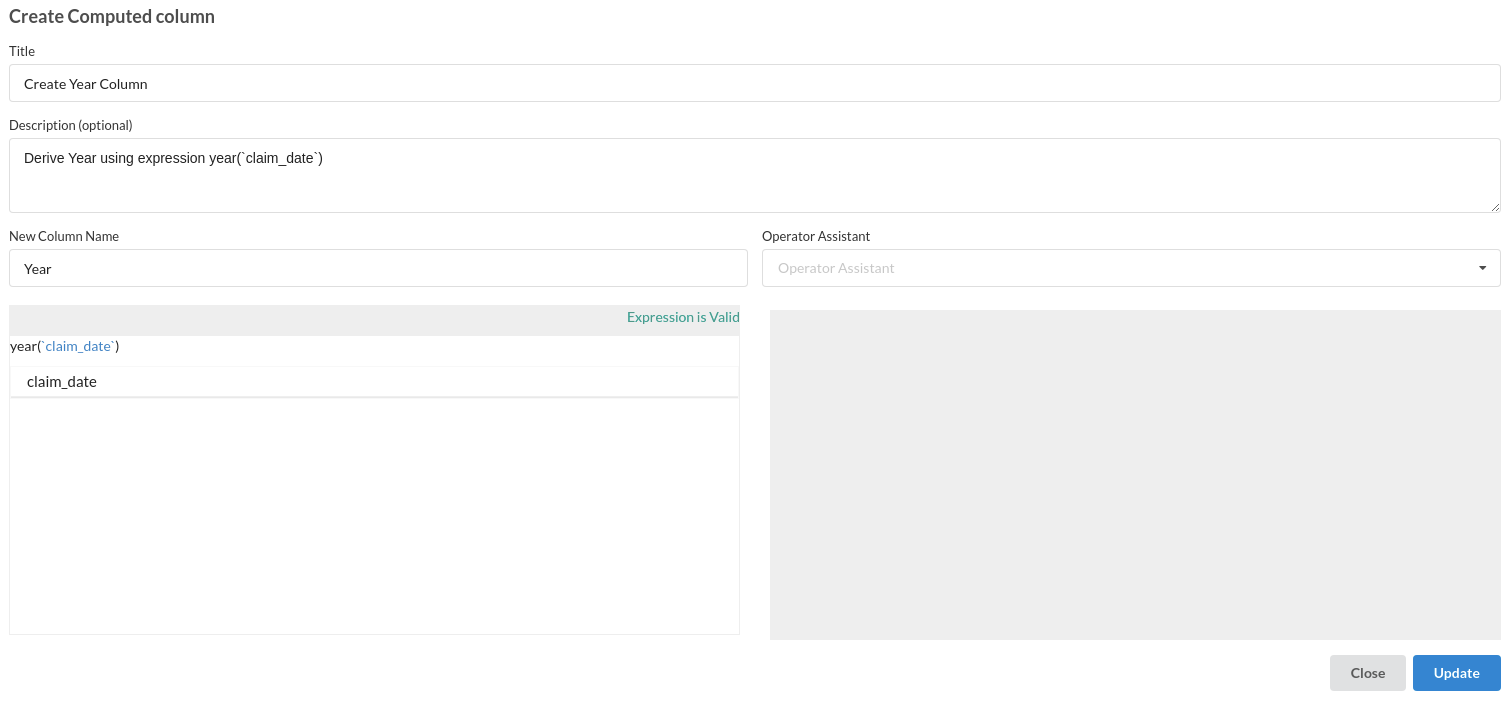
- Create Year Column . This column is created using Calculate Processor
Build/Train a classification Model
- You have a dataset to work with in order to create a classification model. Some of the actions to take before developing a model are listed below.
- Feature Selection
- Feature Encoding
- Choose the algorithm and train the model.
Feature Selection
- Go to the Column Profile View and select Multi-variate profile to construct a correlation matrix to manually identify the features of interest. The peason correlation is shown by Xceed Analytics. Select all of the columns that are strongly correlating to the target feature.
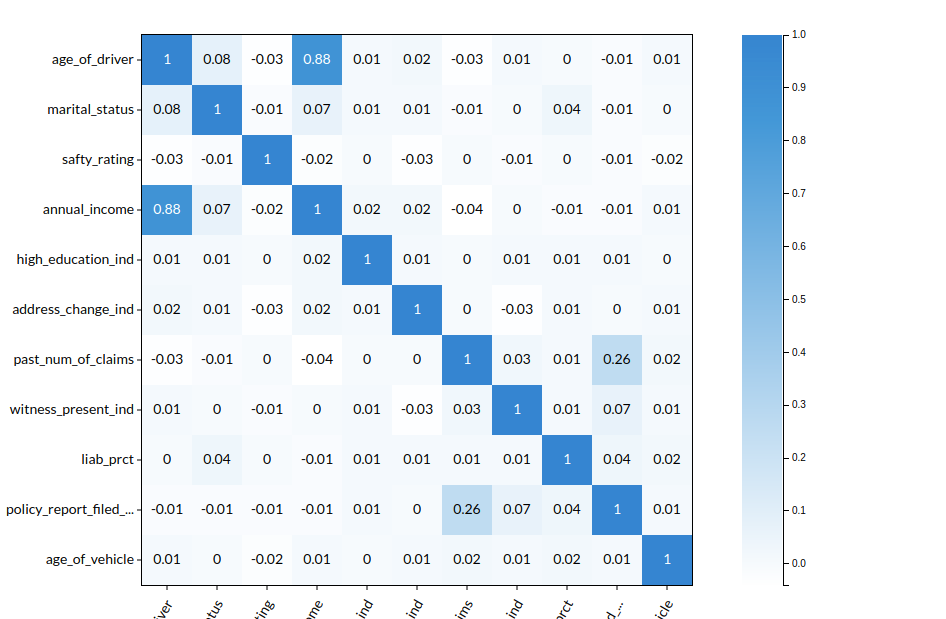
- Some of the features to chose that can explain the target variable based on the observed correlation are:
- age of driver
- marital status
- safty rating
- annual income
- past num of claims etc
Feature Encoding
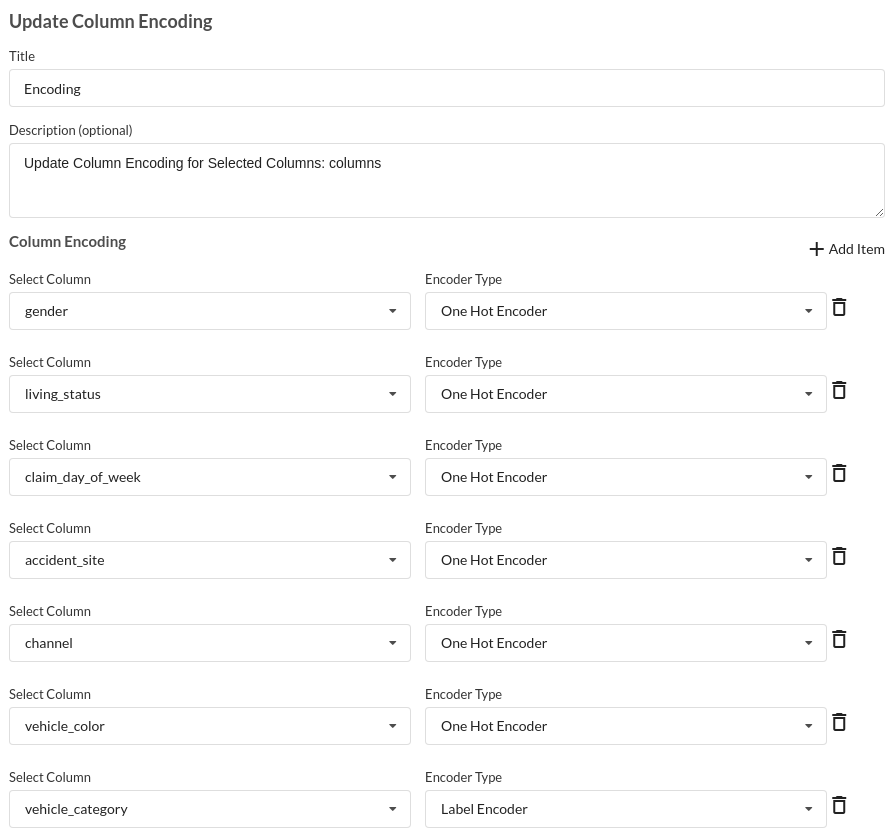
- Take all of the categorical columns and encode them based on the frequency with which they occur. for more infomation on this processor, refer to Feature Encoding
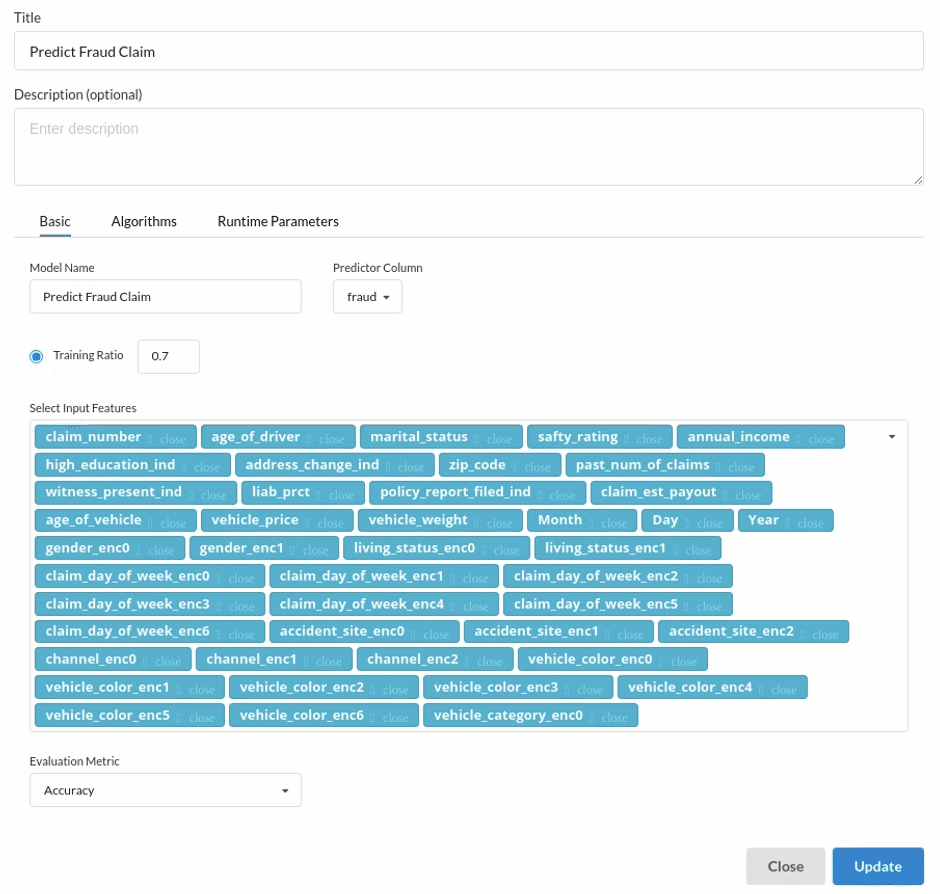
Choose the algorithm and train the model.
- You are estimating a categorical variable- fraud for the prediction model. From the Transformer View, select Classification(auto pilot) andfill in the relevant information.
Review the model output and Evaluate the model
After you finish building the model, it is time to review the model output. Look at the output window to first review your predicted results .You will get a new column in the view like the one below.
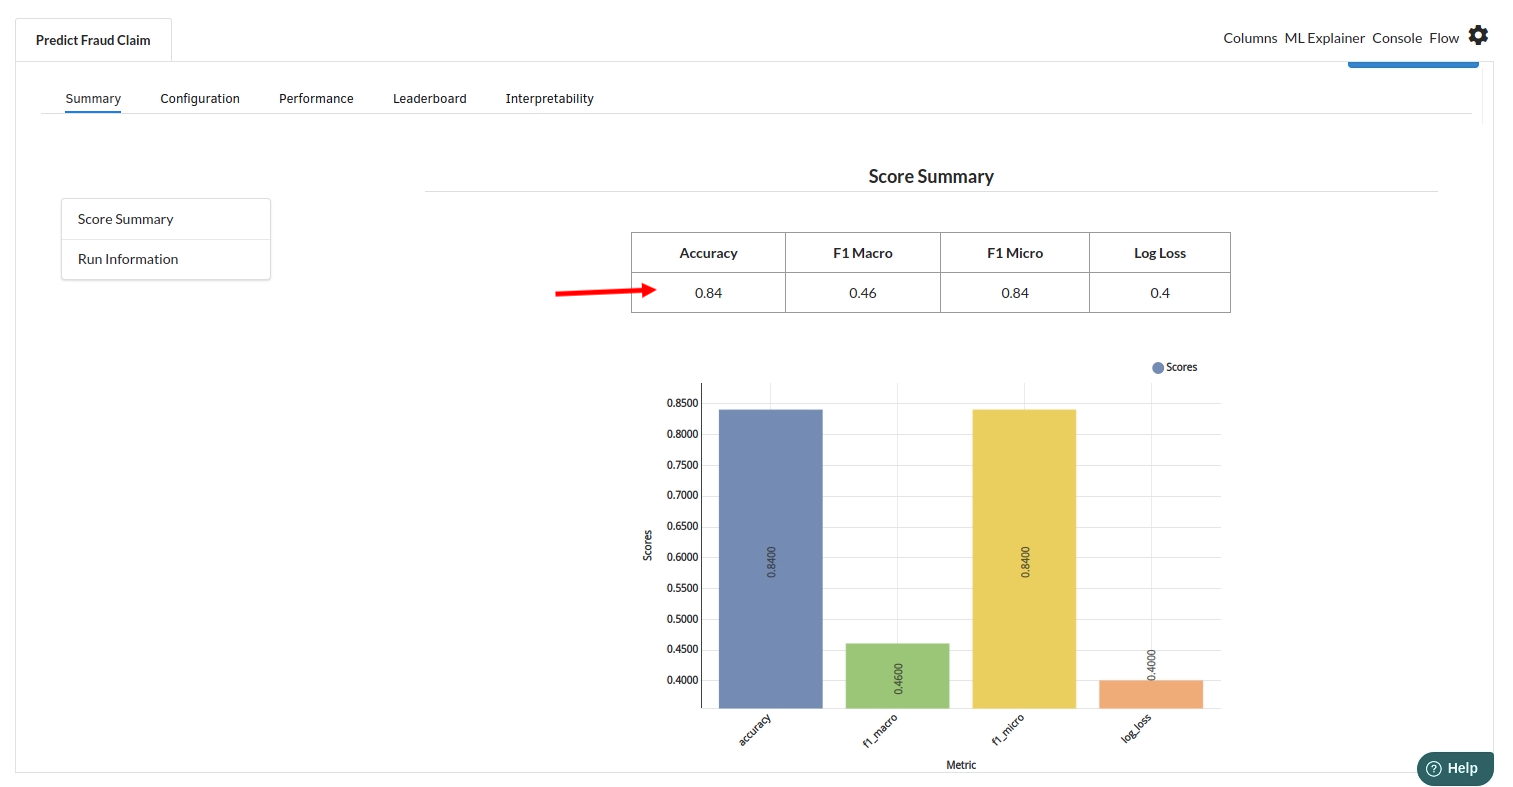
When you finish building your model you will see another tab in the view called Ml explainer . Click on that to evaluate your model.
- The first view you see when you click on ML explainer is the Summary view
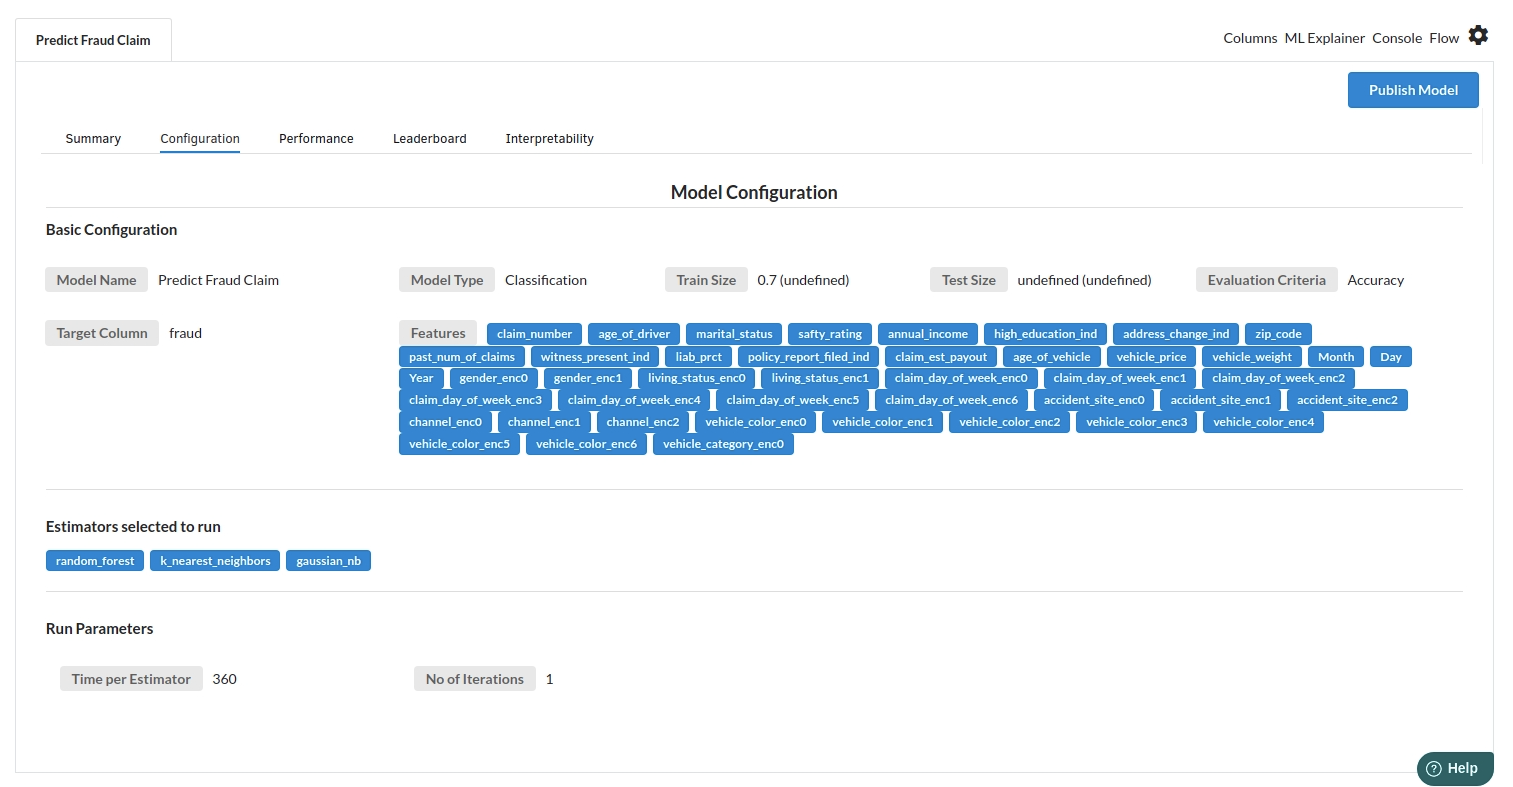
- The second view under Ml explainer is configuration view
The configuration view will give you the information about the step you filled in the Classification step . The view would look like the one below.
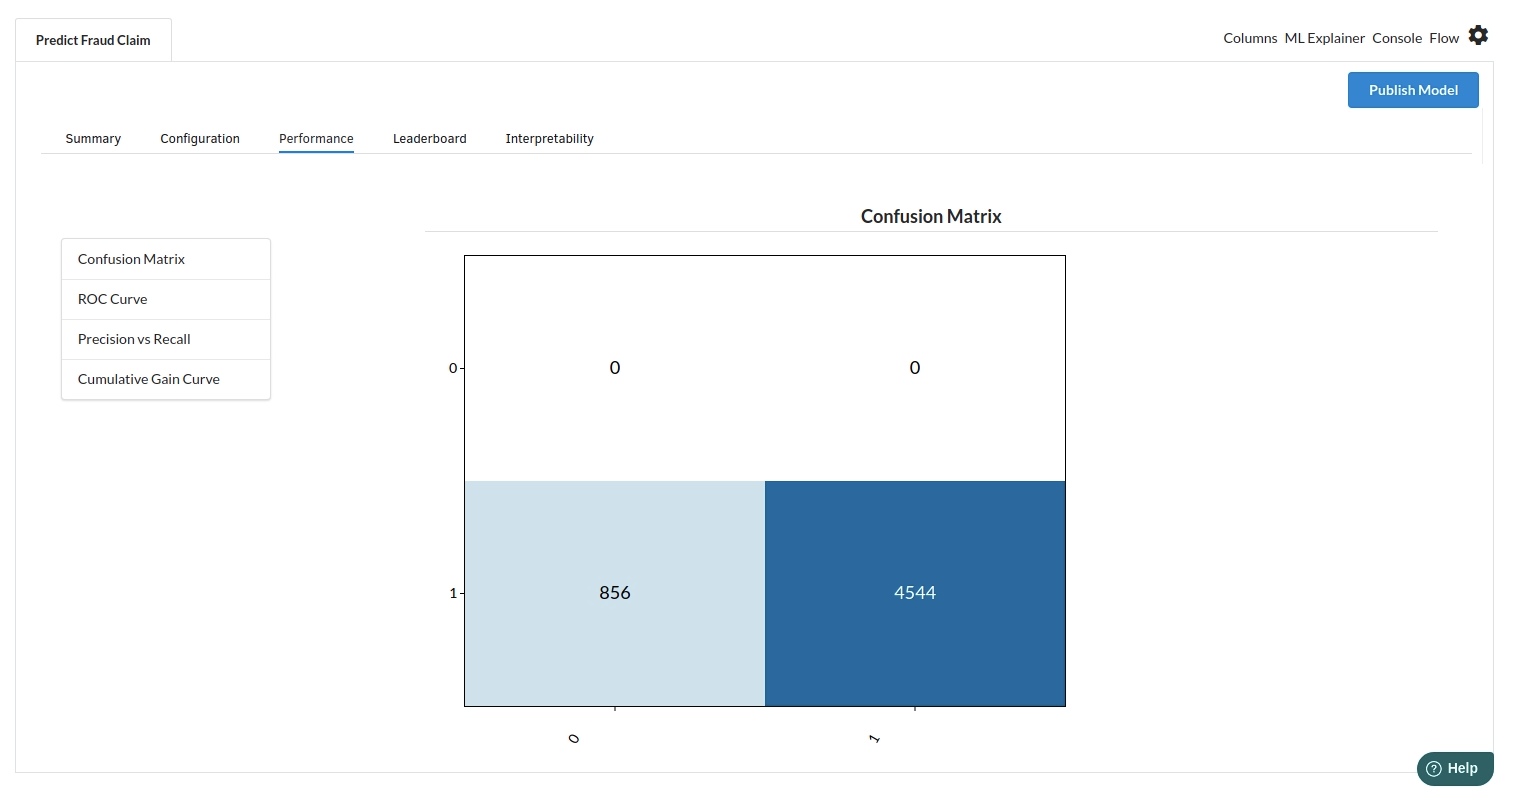
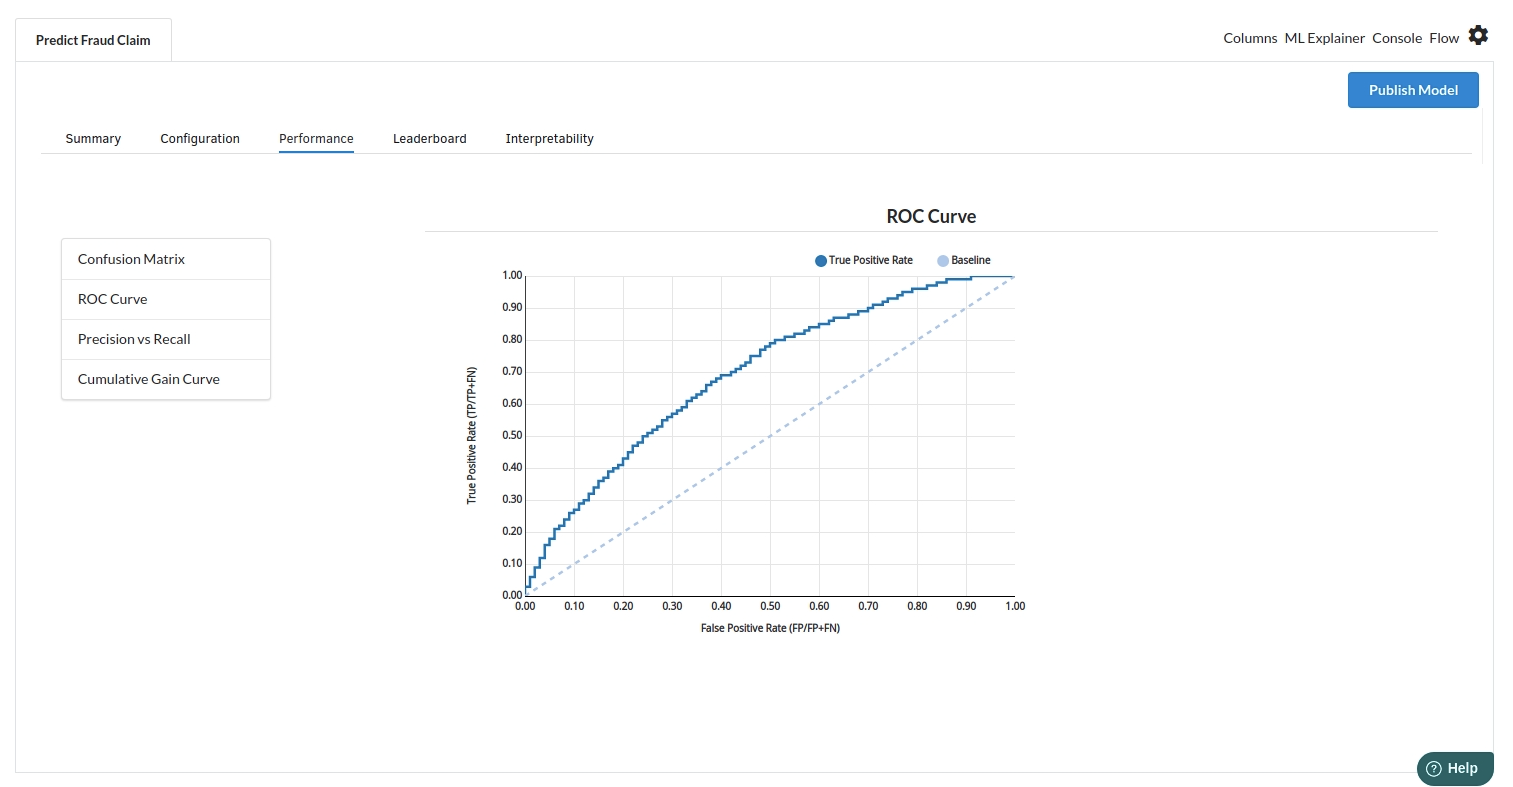
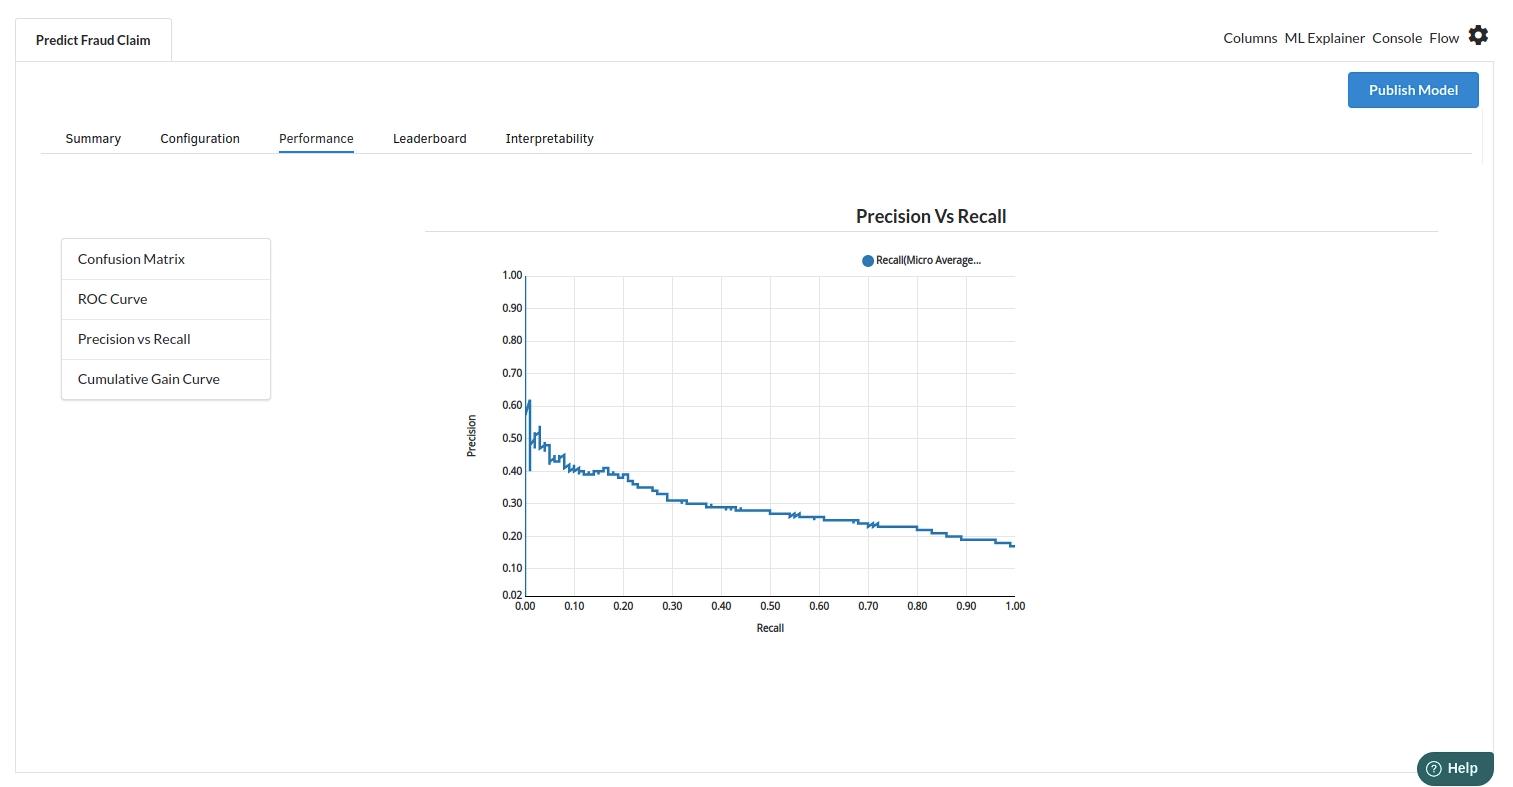
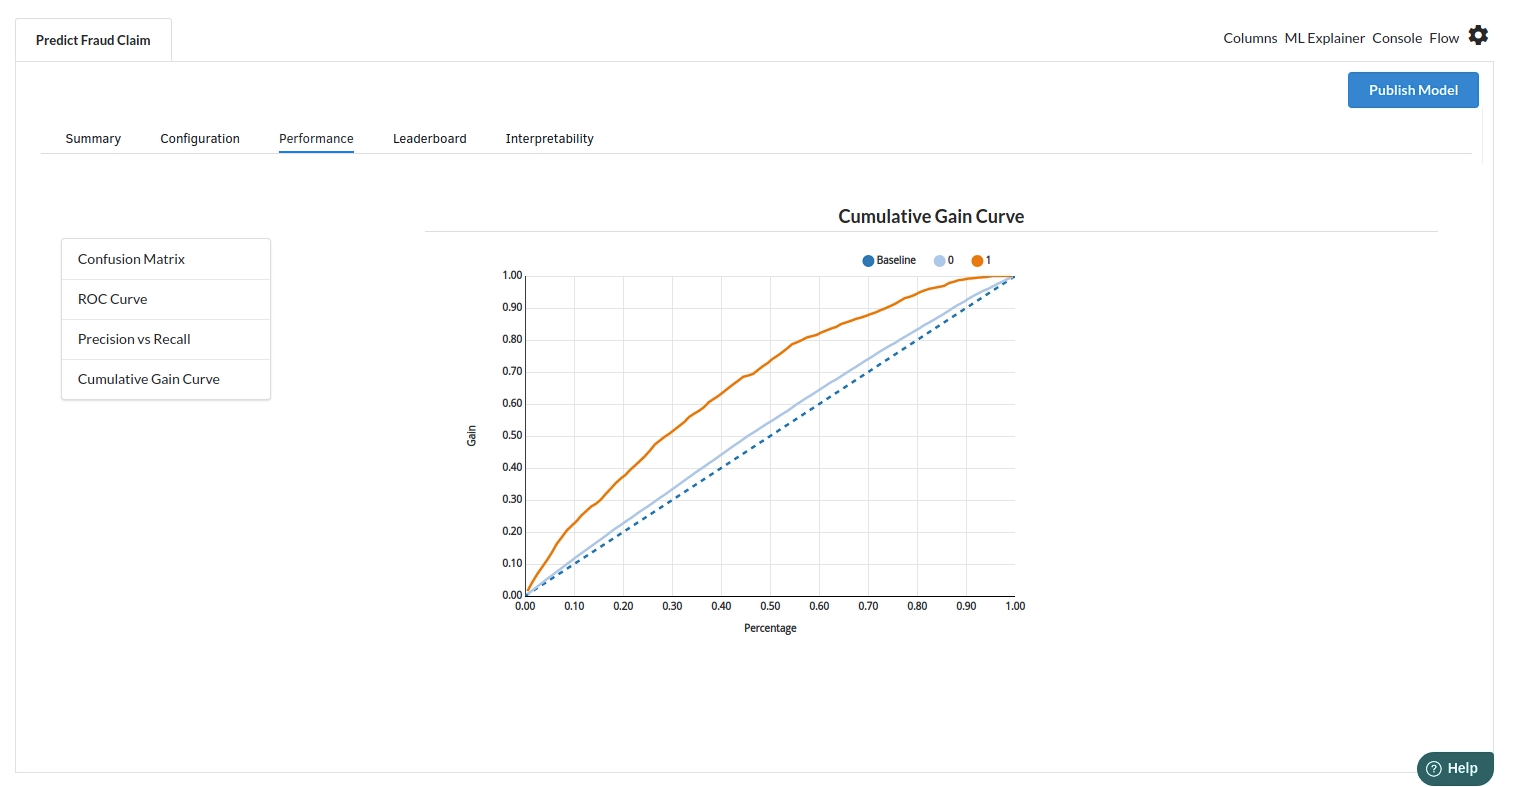
The third view under Ml explainer is Performance View . You can see confusion matrix ,ROC Curve, Precision vs Recall and Cumulative Gain Curve. Look at the built charts and decide if the charts are good enough for your model. The confusion matrix is a good indicator to understand how well your model was trained.
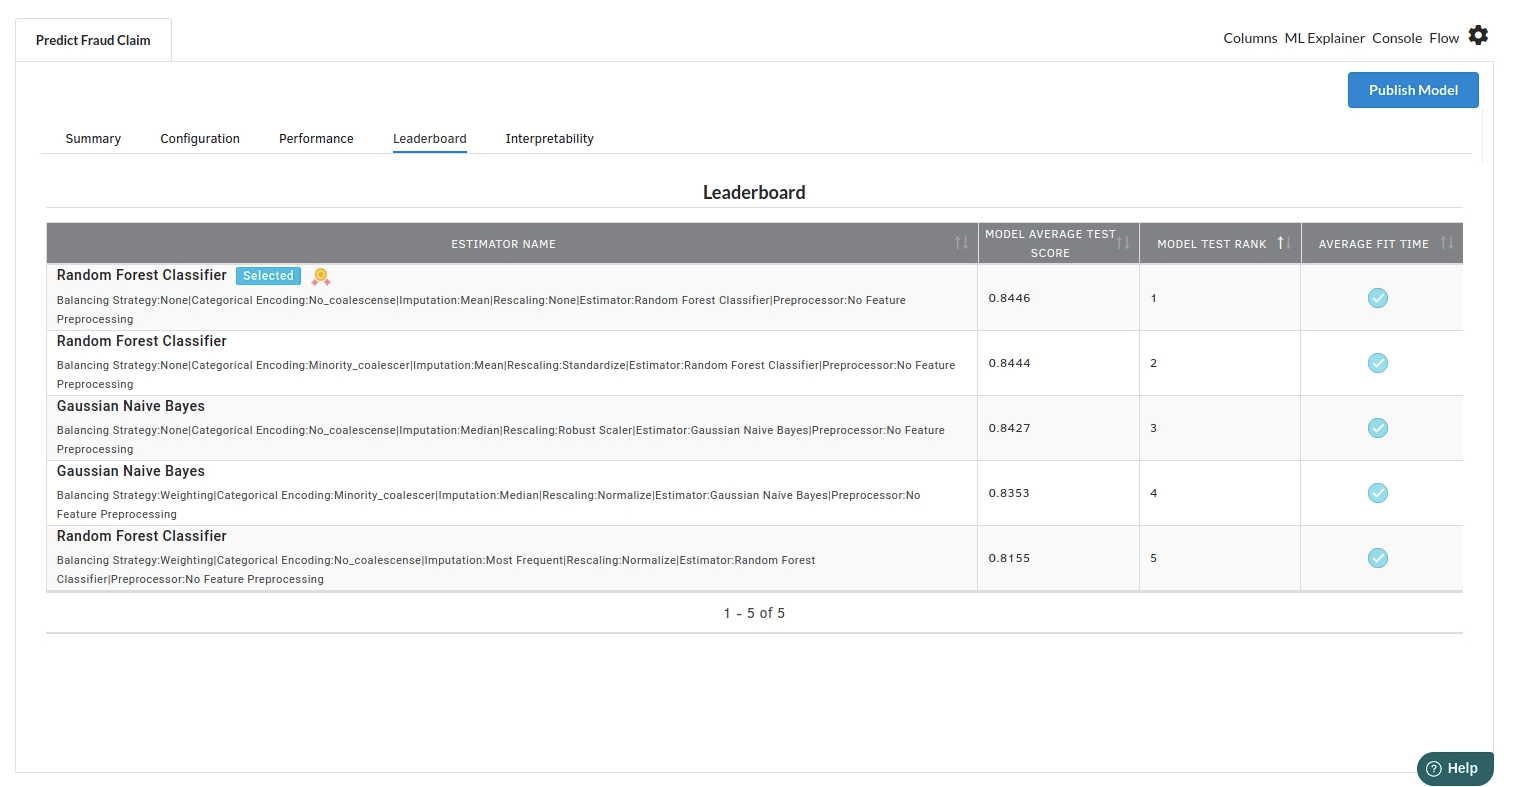
- The fourth view under Ml explainer is Leaderboard . In this view you can see the number of algorithms trained and all the feature engineering done on the algorithms used with ranking system to rank the best algorithm trained.
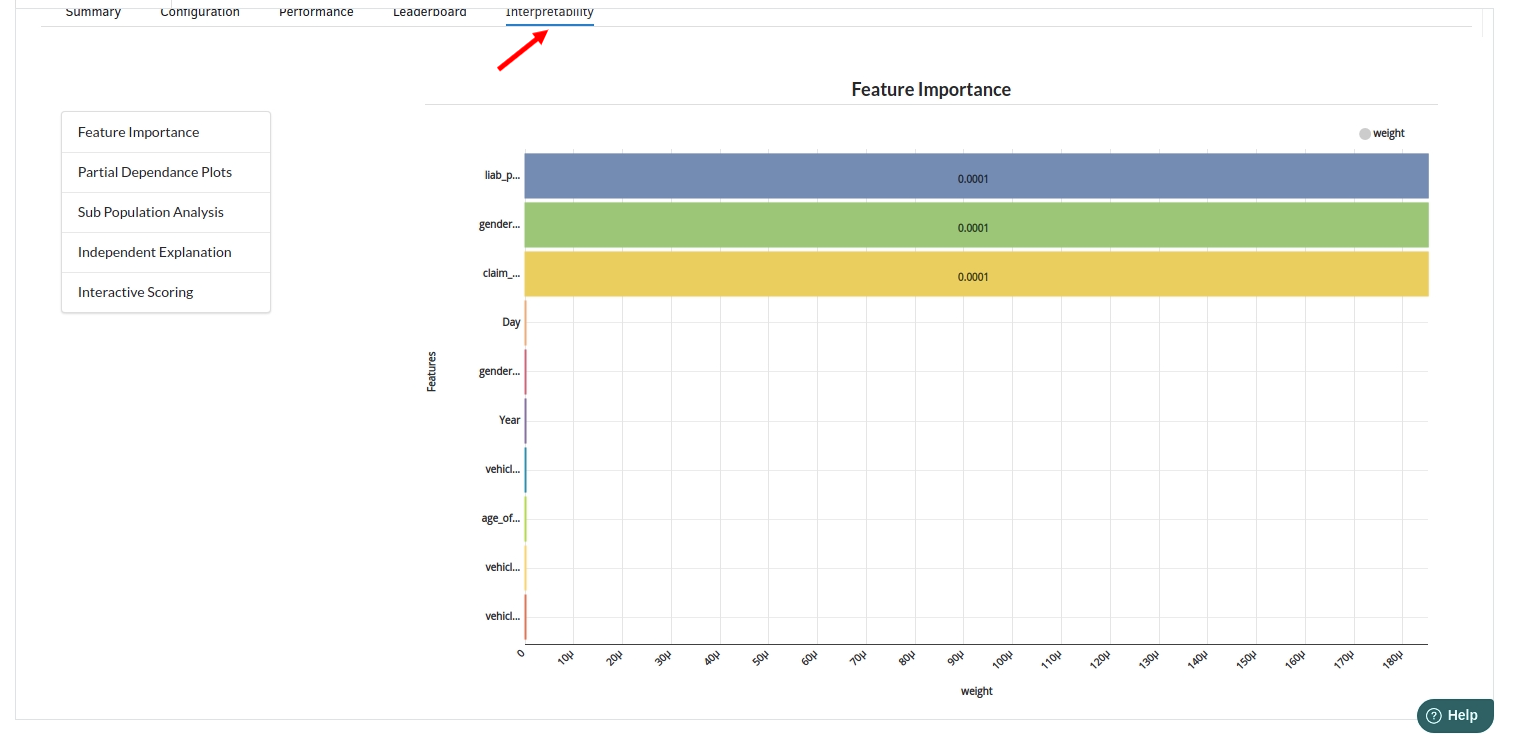
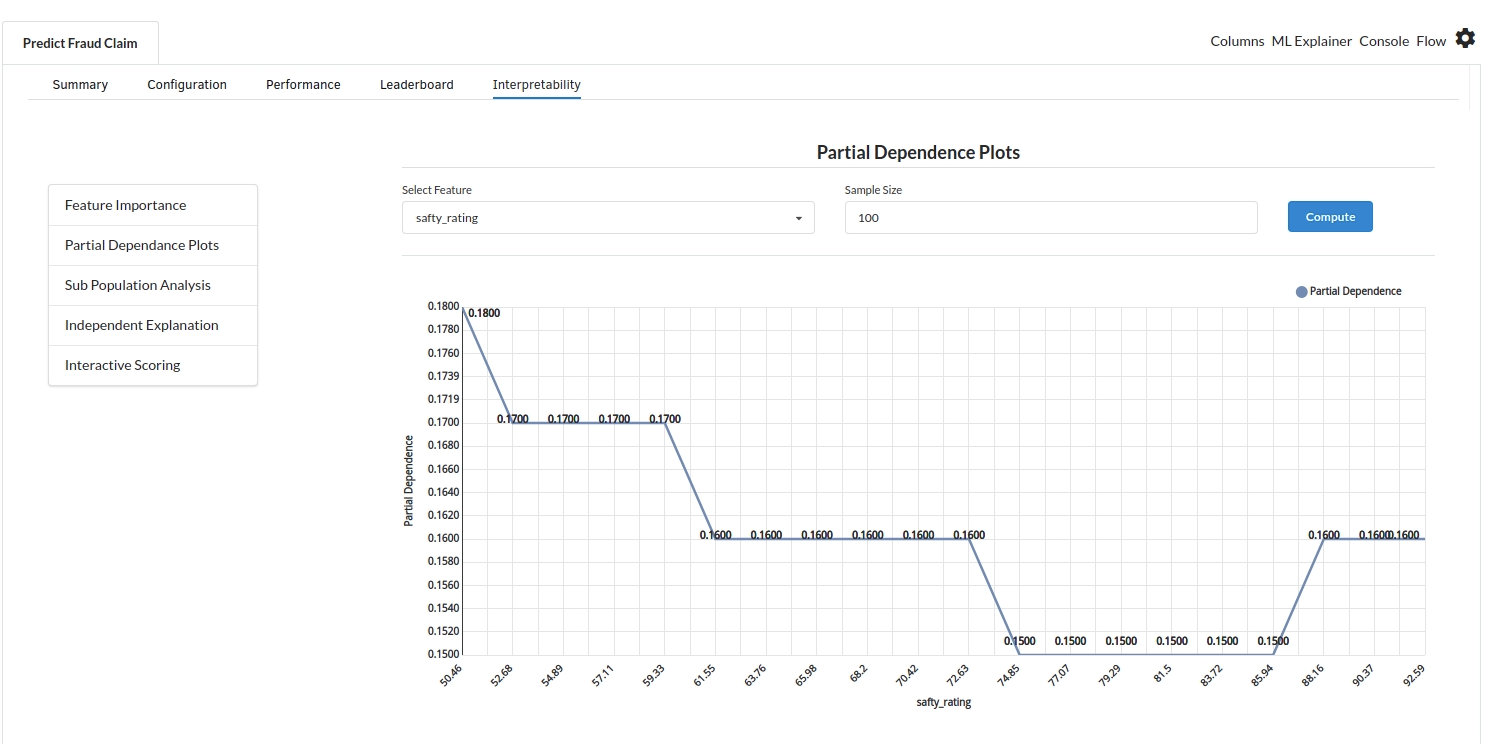
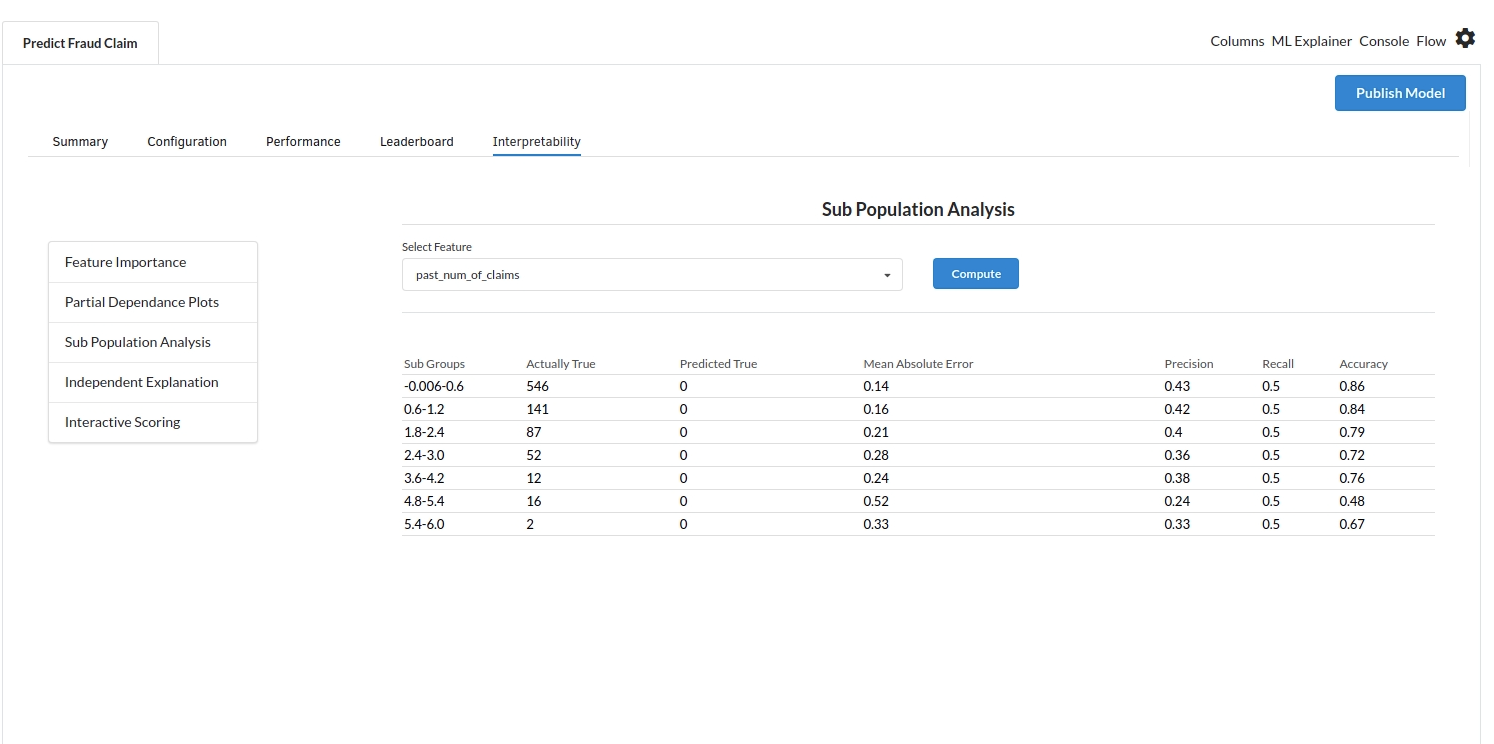
- The last view you see under ML explainer is Interpretability . In this view you will be able to interpret your model in simple terms where you will be getting results pertaining to feature importance , PDP Plots , Sub Population Analysis , Independant Explanation , Interactive Scoring . for more infomation on these results , refer to Interpretability . The Interpretability tab and the results under this tab would look like the one below.