Term Deposit Prediction

What is Term Deposit ?
A Term deposit is a deposit that a bank or a financial institurion offers with a fixed rate (often better than just opening deposit account) in which your money will be returned back at a specific maturity time. When the money is deposited, the customer understands that the money is there for the pre-determined period which usually ranges from 1 month to 5 years and the interest rate is guaranteed not to change for that nominated period of time. Typically, the money can only be withdrawn at the end of the period – or earlier with a penalty attached. Term deposits are popular with investors who prefer capital security and a set return as opposed to the fluctuations of, say, the share market. Many investors also use term deposits as a part of their investment mix.
Objective
The objective of this workflow is to understand the underlying patterns in the data and give a proper analysis as to who should a bank target more to have the customer open a bank account with them. Along with the analysis, we will also build a ML model to predict the probability of a person likely to open a term deposit account with the bank and what factors matters the most .
Business Goals
If a bank can predict if the customers they have will their campaign lead to people open a term deposit subscription in their bank then :
- The bank can have good cash flow .
- Giving loans can become easy
Relevance of Xceed
Xceed will give a NO-CODE environment for the end to end execution of this project starting with uploading of the datasets from various sources to deploying the model at the end point. Starting with exploring the data to building a model and deploying it , all of these are NO-CODE.
Data Requirements
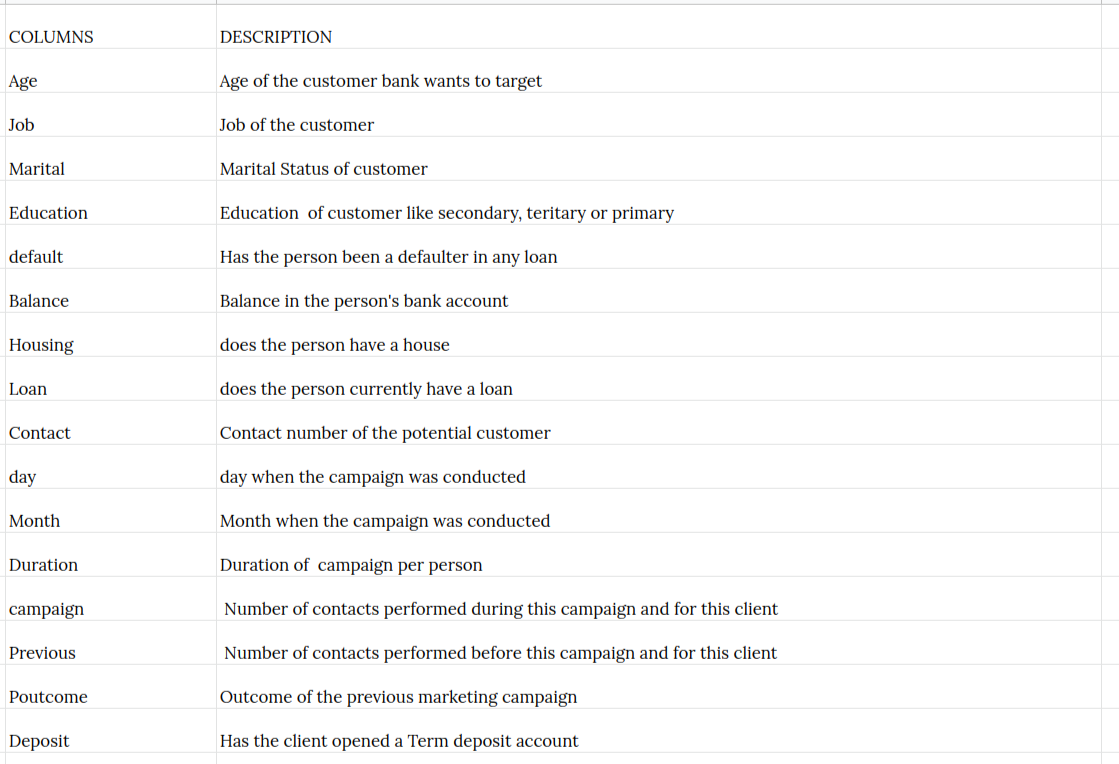
You will be needing a customer details dataset which will have information about their age, profession , education etc., which are necessary for the classification. The columns in the dataset are as below.
Output Expectations
The output expectation for this workflow is to get a clear understanding of the customer patterns such as what leads to them opening a term deposit account, Who should the bank target if they were to open another campaign and what should the duration of the campaign be. Including all these, we will also be needing a classifier model which will get the probabilty of the a person likely to open a term deposit account in the bank
Basic flow
- Upload the data to Xceed Analytics and create a dataset
- Create the Workflow for the experiment
- Perform initial exploration of data columns.
- Perform Cleanup and Tranform operations
- Build/Train a Classification Model
- Review the model output and Evaluate the model
- Deploy/Publish the model
Upload the data to Xceed Analytics and create a dataset
- Upload the automobile demo data set to Xceed Analytics fromt the Data Connections Page. For more information on Data Connections refer to Data Connections
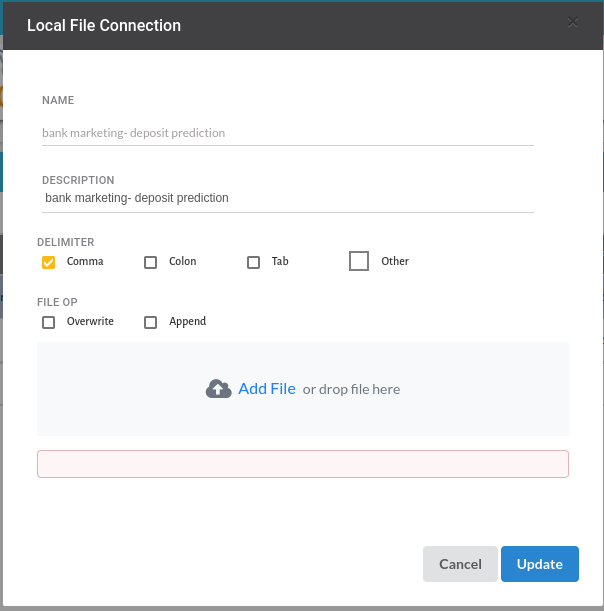
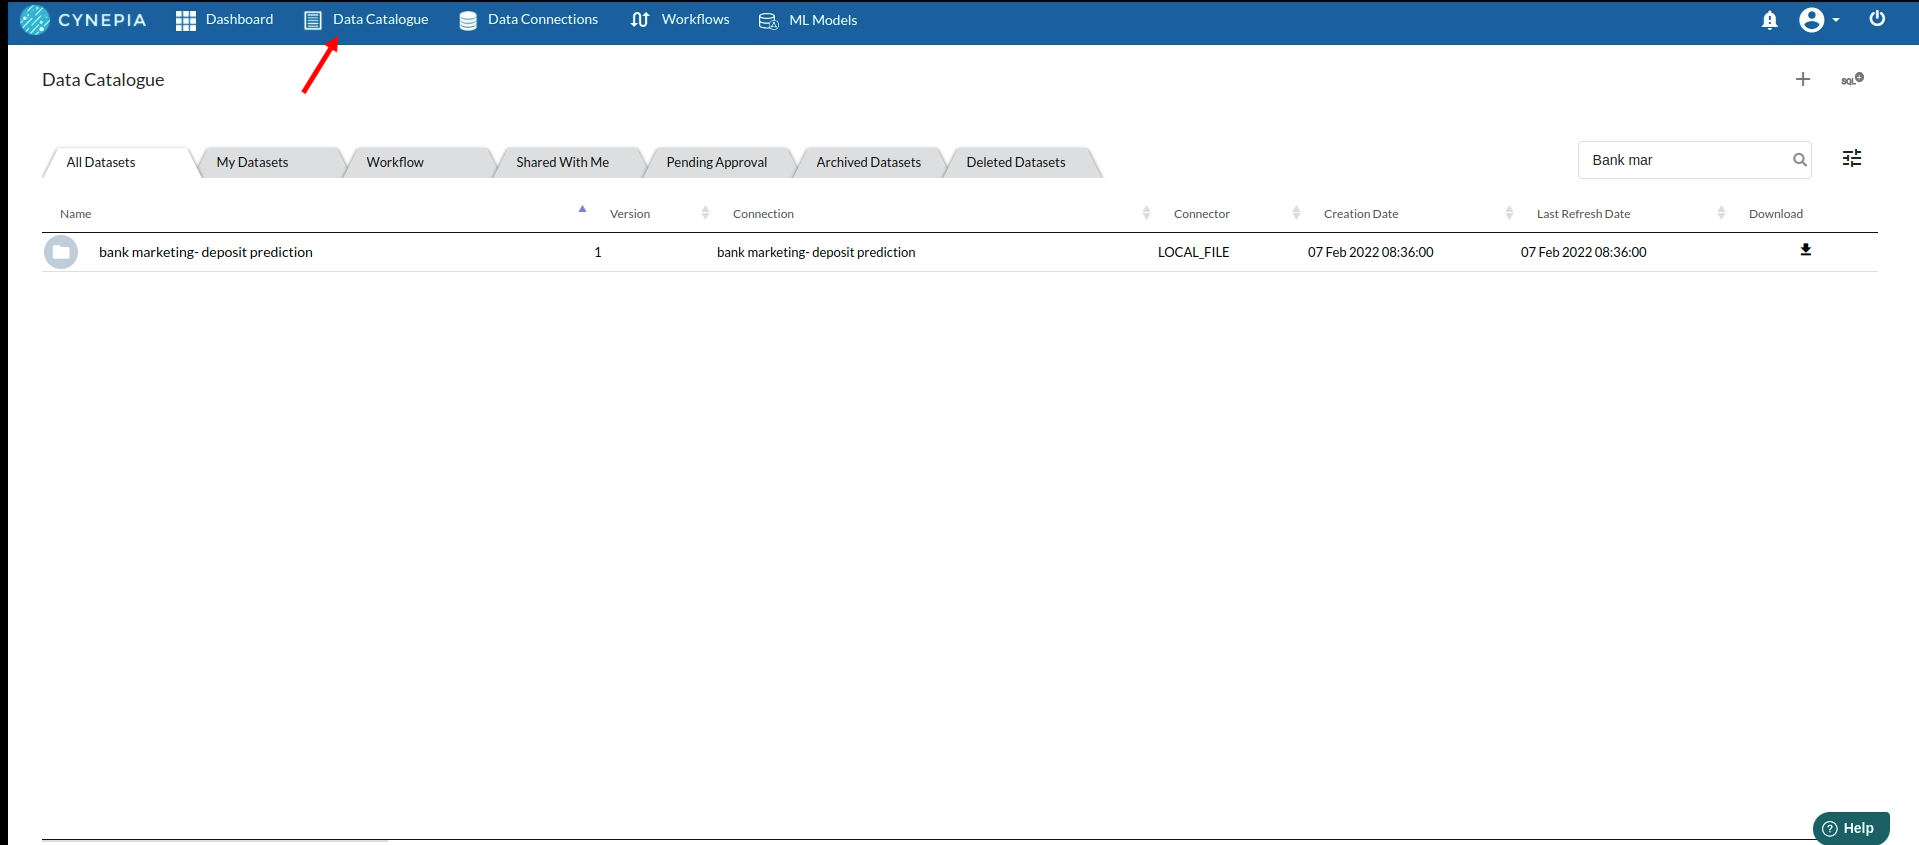
- Create a dataset under data catalogue from the uploaded datasource. For more information on how to create a dataset, refer to Data Catalogue
Create a Worfklow/Experiment
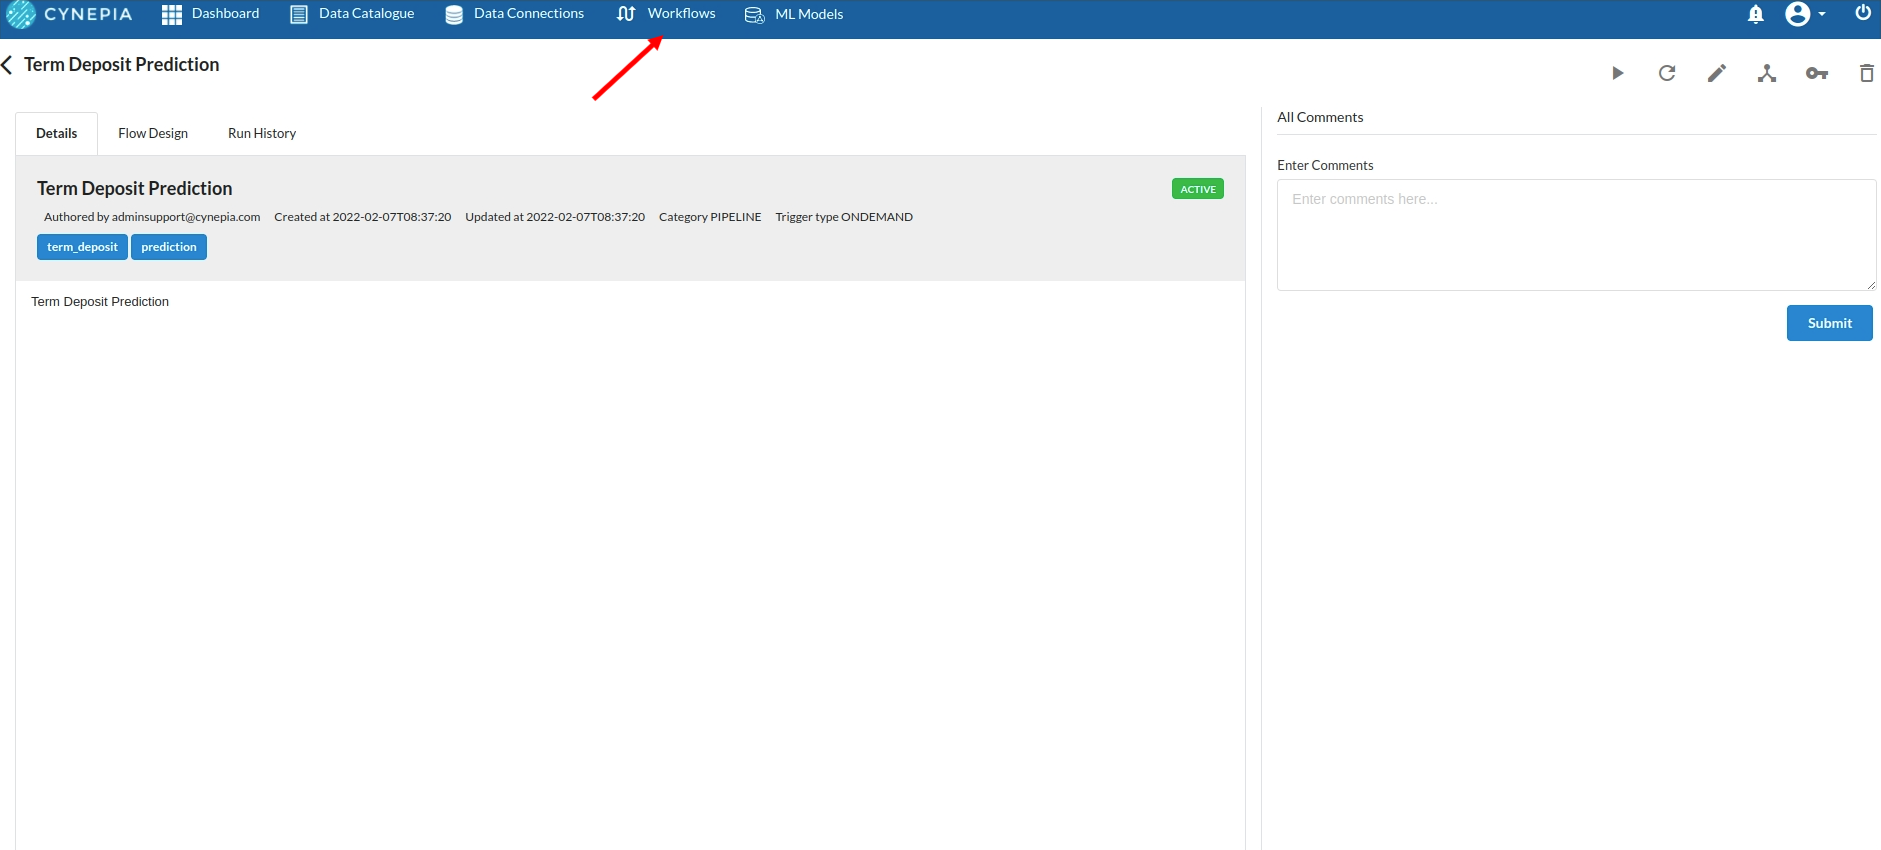
- Go to the Workflows Tab on the Navigation and Create our first Regression Experiment/Workflow. For more information on how to create a workflow, refer to Create Workflow
Perform initial exploration of data columns
Take a vague look at the columns in the output window and check the datatypes of the columns at first.
Exploration steps
- At first look at the header column and understand the distribution of all the data columns.
- for a further Univariate analysis of all the columns look at the columns section. for more information on the columns section, refer to columns
- Data Transformation: Take a look at the transformers Xceed offers and do all the feature processing and feature engineering you feel is best suitable for your assignment . For more information on the list of processor and their functinalities , refer to transfomer panel
![]()
- Correlational Matrix : Select all the columns you want from the given columns and see how they are correlating with the predictor column or even with other columns.

Pearson correlation that Xceed provides is only for the numerical columns .
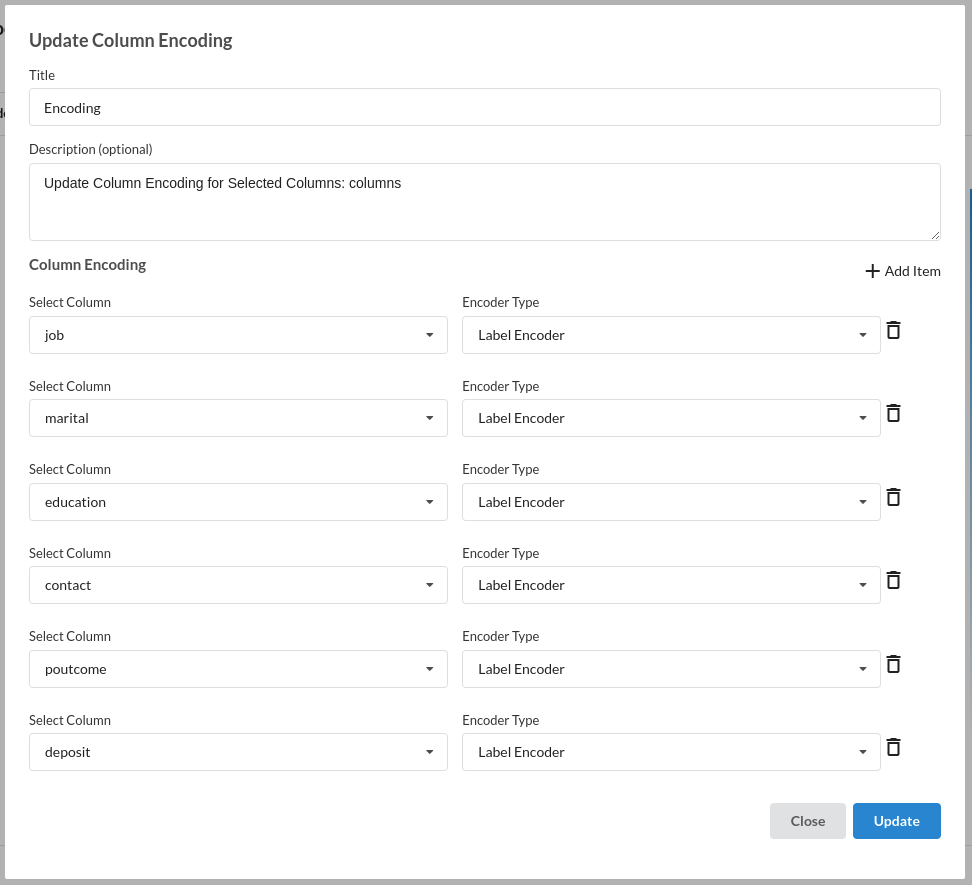
- Encoding : Turn your categorical columns in numerical format using Prepare columns processor. For more information on this processor , refer to Prepare columns
Build/Train a Classification Model
- Building a Classification model : go to Classification(Auto Pilot) and fill up all the options in the processor. for more information on this processor , refer to classification (auto pilot)
- In the basic view, choose your predictor column, set up your training ratio ,select all your input features (Independant features) and your evaluation metric
- In the algorithms view , choose the type of learner/ algorithm you want to train your data with .
- In the Runtime parameters view , choose the fill in the time you want to train on one algorithm and the number of iterations,
Review the model output and Evaluate the model
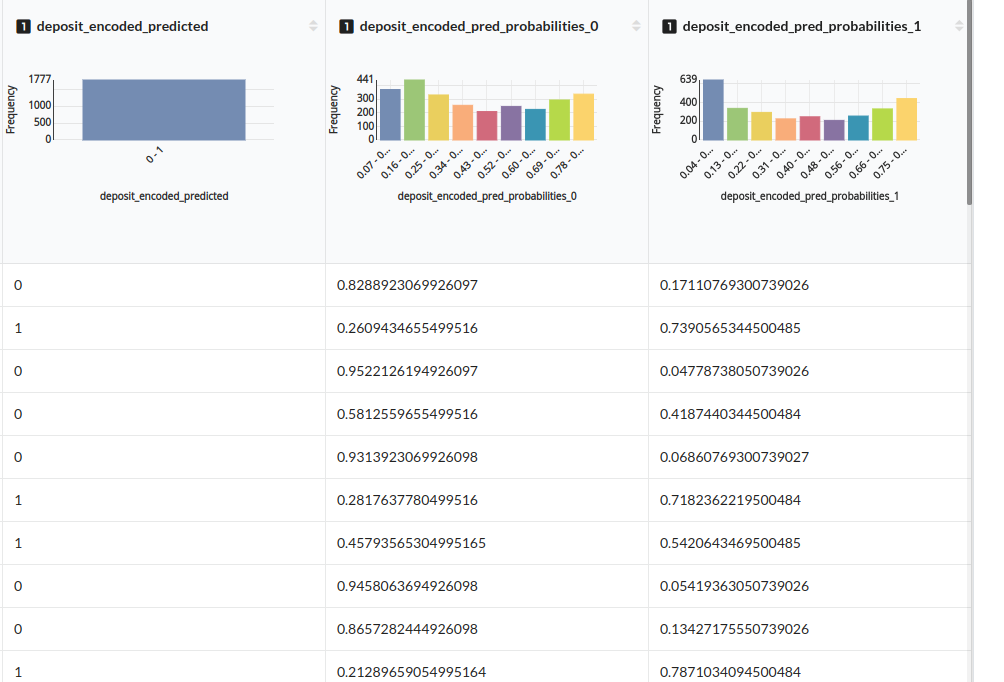
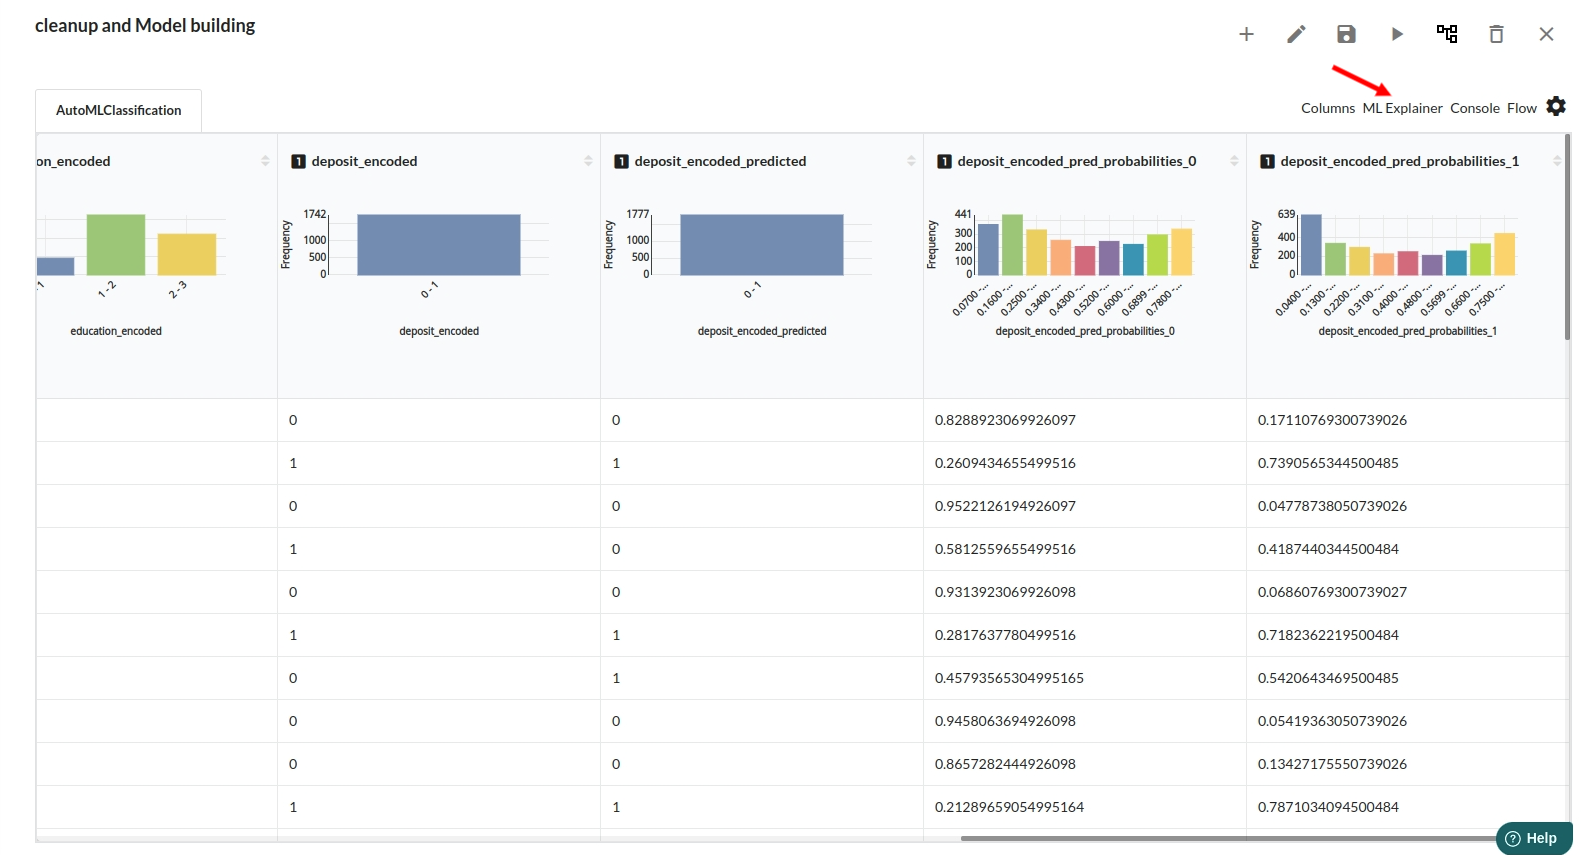
When you finish building your model you will see new columns created such as Predicted column , Class probabilities. the columns created for this workflow would look like the one below.
When you finish building your model you will see another tab in the view called Ml explainer . Click on that to evaluate your model.
- The first view you see when you click on ML explainer is the Summary view
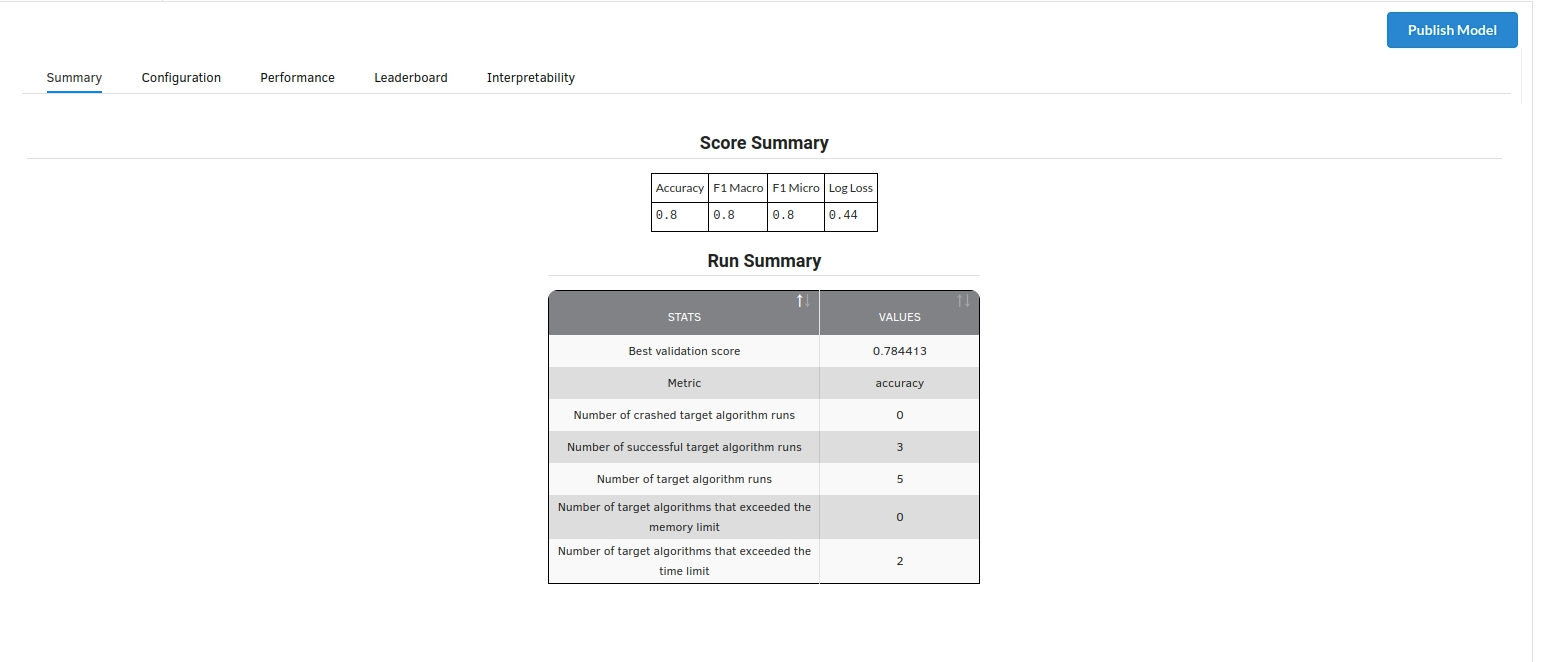
Look at the metrics score and the Run summary stats. Based on your calculations decide if Accuracy , F1 macro, F1 micro and log loss according to your expectations.if not this will be your first step to rethink the training process.
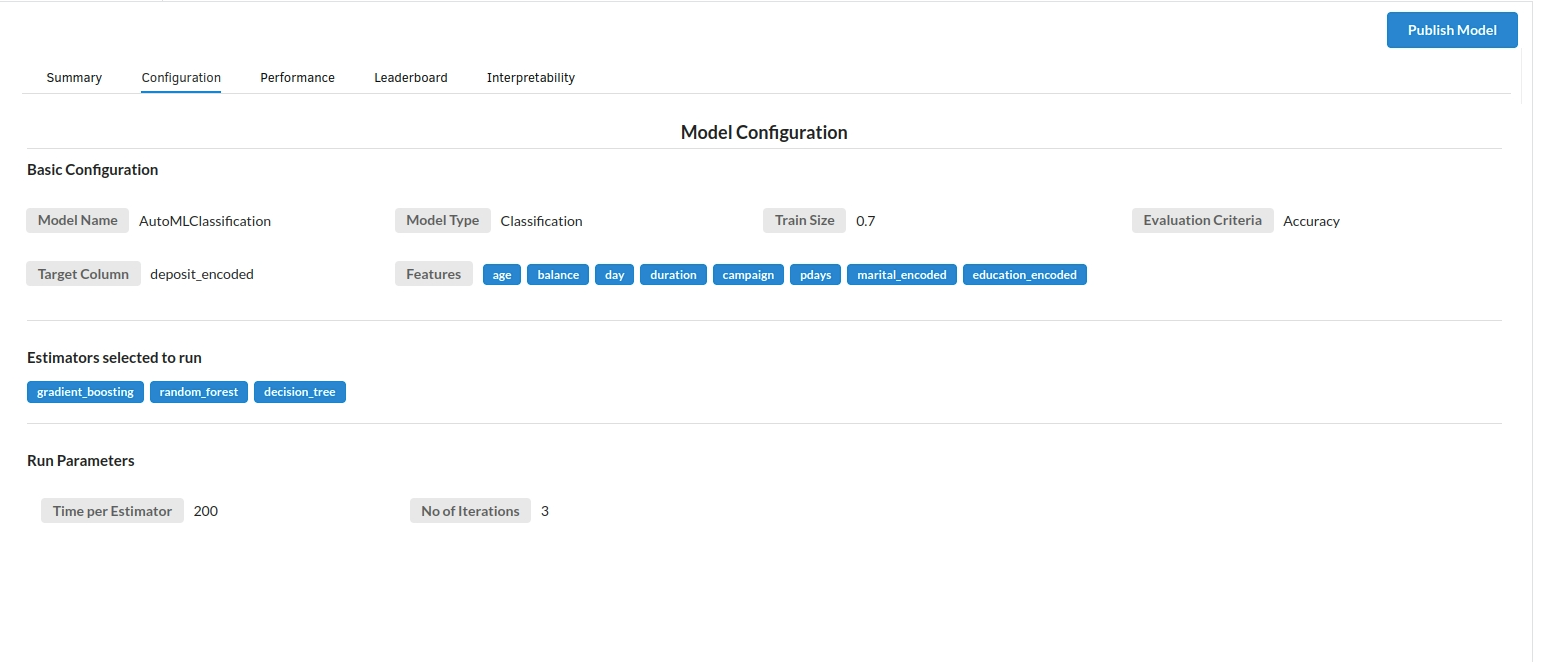
- The second view under Ml explainer is configuration view
The configuration view will give you the information about the step you filled in the Regression step . The view would look like the one below.
- The third view under Ml explainer is Performance View . You can see the Confusion Matrix , ROC Curve,Precision vs Recall and Cumulative Gain Curve charts for Classification models. Look at the built charts and decide if the charts are good enough for your model.
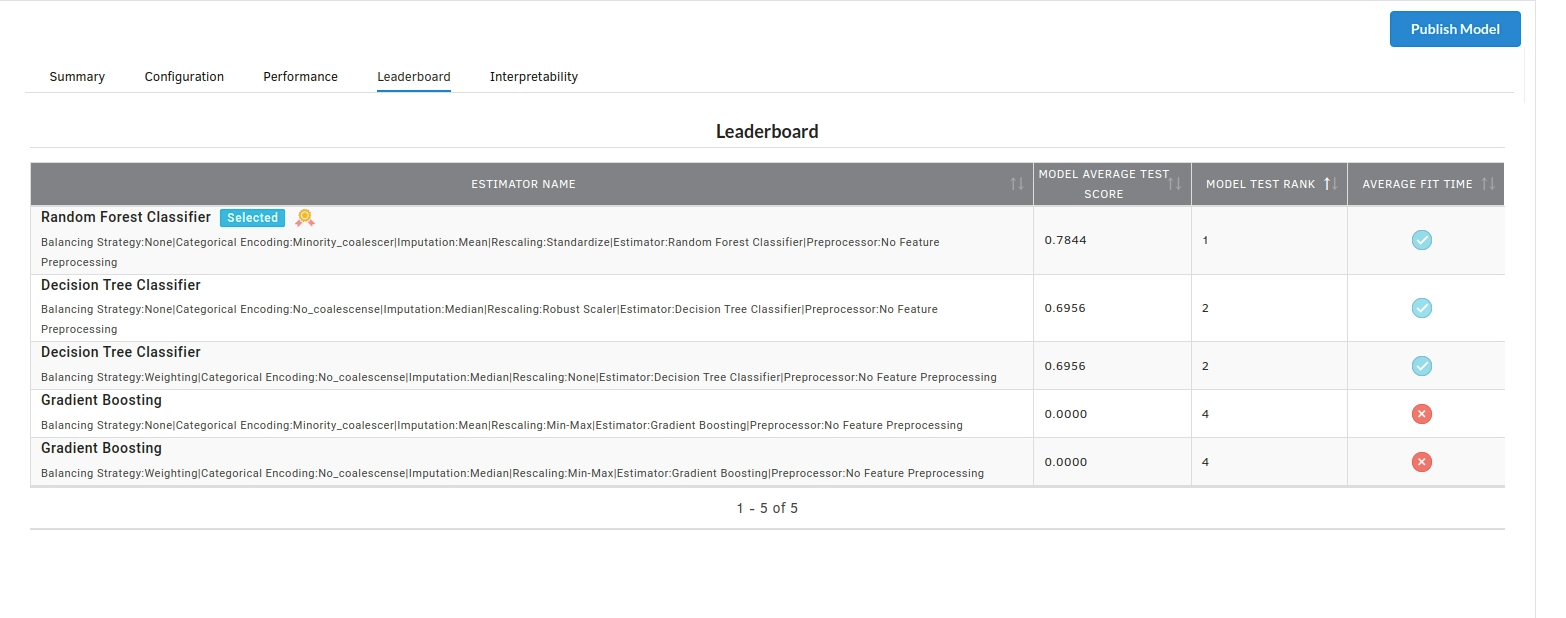
- The fourth view under Ml explainer is Leaderboard . In this view you can see the number of algorithms trained and all the feature engineering done on the algorithms used with ranking system to rank the best algorithm trained.
- The last view you see under ML explainer is Interpretability . In this view you will be able to interpret your model in simple terms where you will be getting results pertaining to feature importance , PDP Plots , Sub Population Analysis , Independant Explanation , Interactive Scoring . for more infomation on these results , refer to Interpretability . The Interpretability tab and the results under this tab would look like the one below.
- Feature Importance
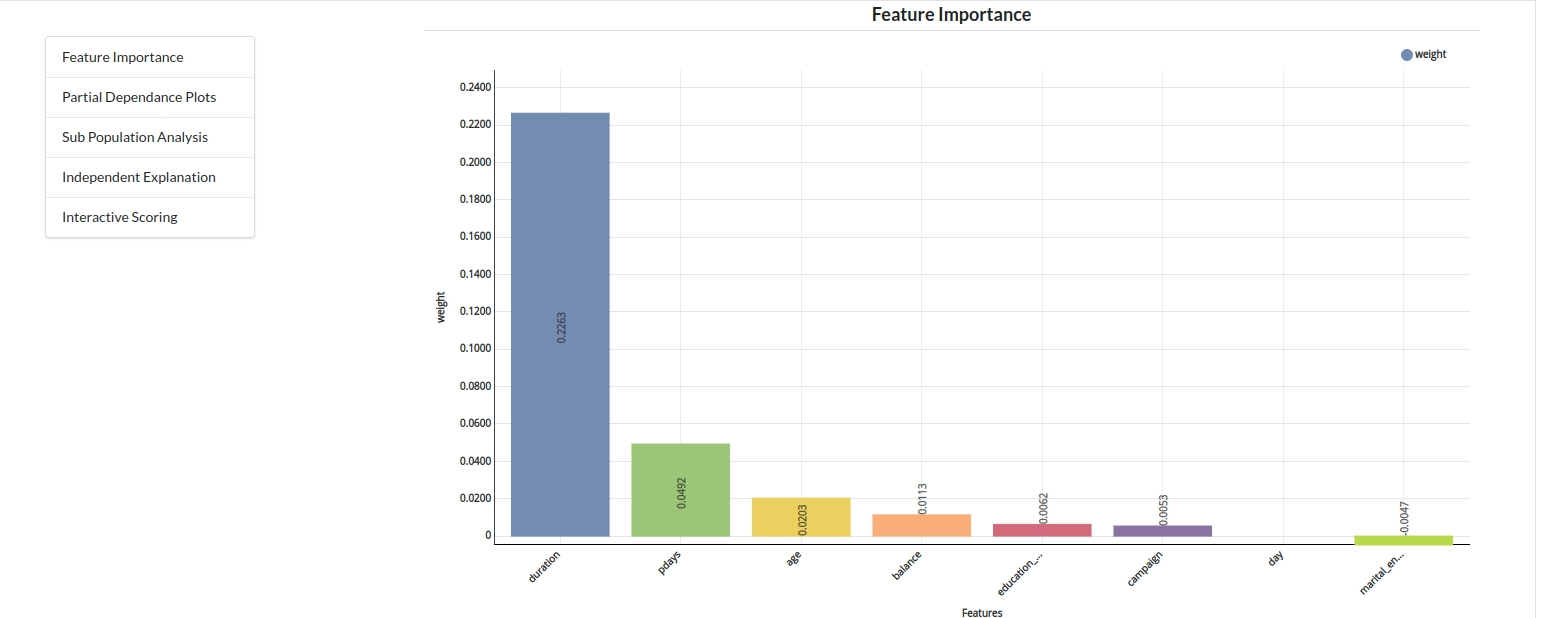
- Partial Dependance Plots
- Sub Population Analyis
-
Independant Explanation
-
Interactive Scoring