Predicting Medical Insurance premium

What is Medical Insurance ?
Health insurance or medical insurance is a type of insurance that covers the whole or a part of the risk of a person incurring medical expenses. As with other types of insurance is risk among many individuals.
Types of Medical Insurance In India
- Individual Medical Insurance Policy: Individual health insurance policy provides coverage of a specified amount to the person insured.
- Family Floater Medical Insurance Policy: Under this policy, if the insured person in a family reaches a certain age or dies, then the policy for that person will be closed and the family members will not be allowed to renew the policy.
- Pre-existing Disease Cover Policy: Under this plan, the policyholder will get a cover for all those diseases he had before purchasing the health insurance plan. It also gives coverage to all those diseases which may arise from the pre-existing disease.
- Renewability Age: All the policies provide coverage for a year only. Therefore, the policy must be purchased at an early age to get better coverage at a low premium and other additional benefits.
Objective
With the rise of Medical/health insurance poicy holders, the insurance companies have to understand how to optimize their time by not tormenting the customer to get medical check up or stay behind all the checks. If predictive model is built in order to do that for them then the whole medical insurance process will be a smooth process . The objective of this workflow is to understand the patterns in the data through univariate and correlation plots as well as some transformations and build a Machine learning model to predict the premium of the potential customers based on their age and their medical history .
Business Goals
The business goals are as below :
- More customer acquisition
- Time efficient
- less man power can be used to handle any client
Relevance of Xceed
Xceed Analytics provides a single integrated data and AI platform that reduces friction in bring data and building machine models rapidly. It further empowers everyone including Citizen Data Engineers/Scientist to bring data together and build and delivery data and ml usecases rapidly. It's Low code/No code visual designer and model builder can be leveraged to bridge the gap and expand the availability of key data science and engineering skills.
we will use NO-CODE environment for the end-to-end implementation of this project. All of these steps are built using Visual Workflow Designer, from analyzing the data to constructing a model and deploying it.
Data Requirements
To build this model we will be needing a dataset which has the information about the customer and their health history . the columns in the dataset would look like the one below.
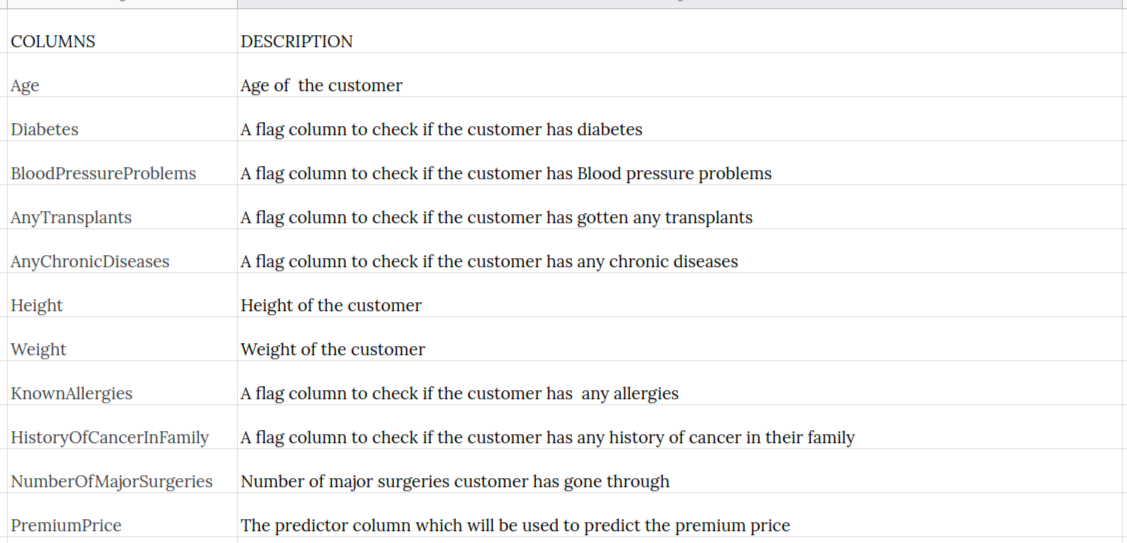
Output Expectations
The output expectation for this workflow would be to understand the data by doing univariate , bivariate and correational analysis to build a regression model and understand and validate the output using interpretable techniques used in Xceed.
Basic flow
- Upload the data to Xceed Analytics and create a dataset
- Create the Workflow for the experiment
- Perform initial exploration of data columns.
- Perform Cleanup and Transform operations
- Build/Train a regression Model
- Review the model output and Evaluate the model
- Deploy/Publish the model
Upload the data to Xceed Analytics and create a dataset
- Upload the automobile demo data set to Xceed Analytics fromt the Data Connections Page. For more information on Data Connections refer to Data Connections
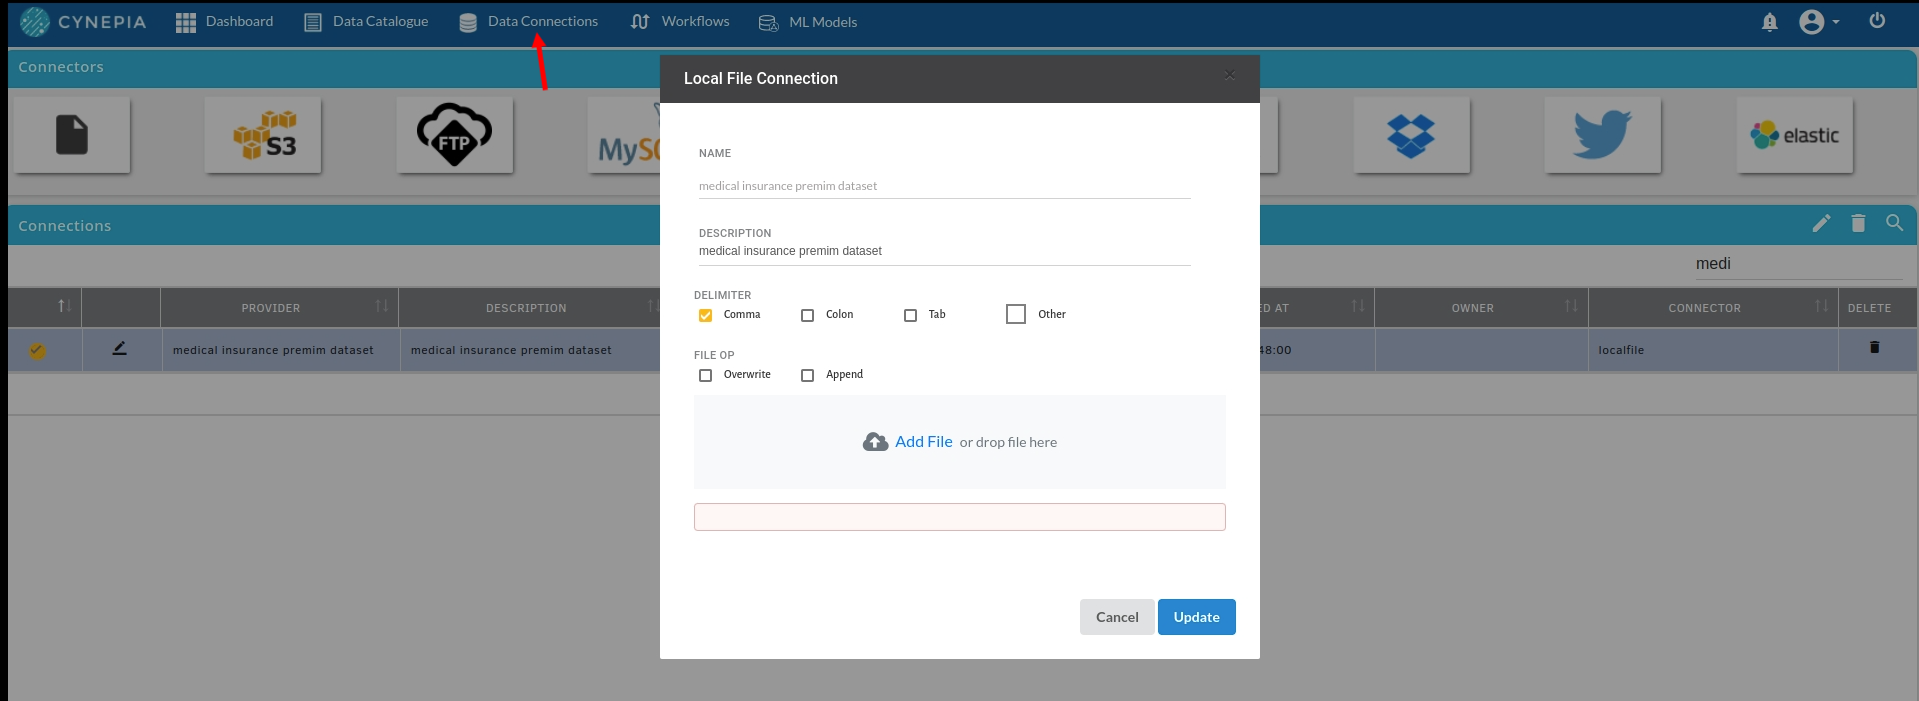
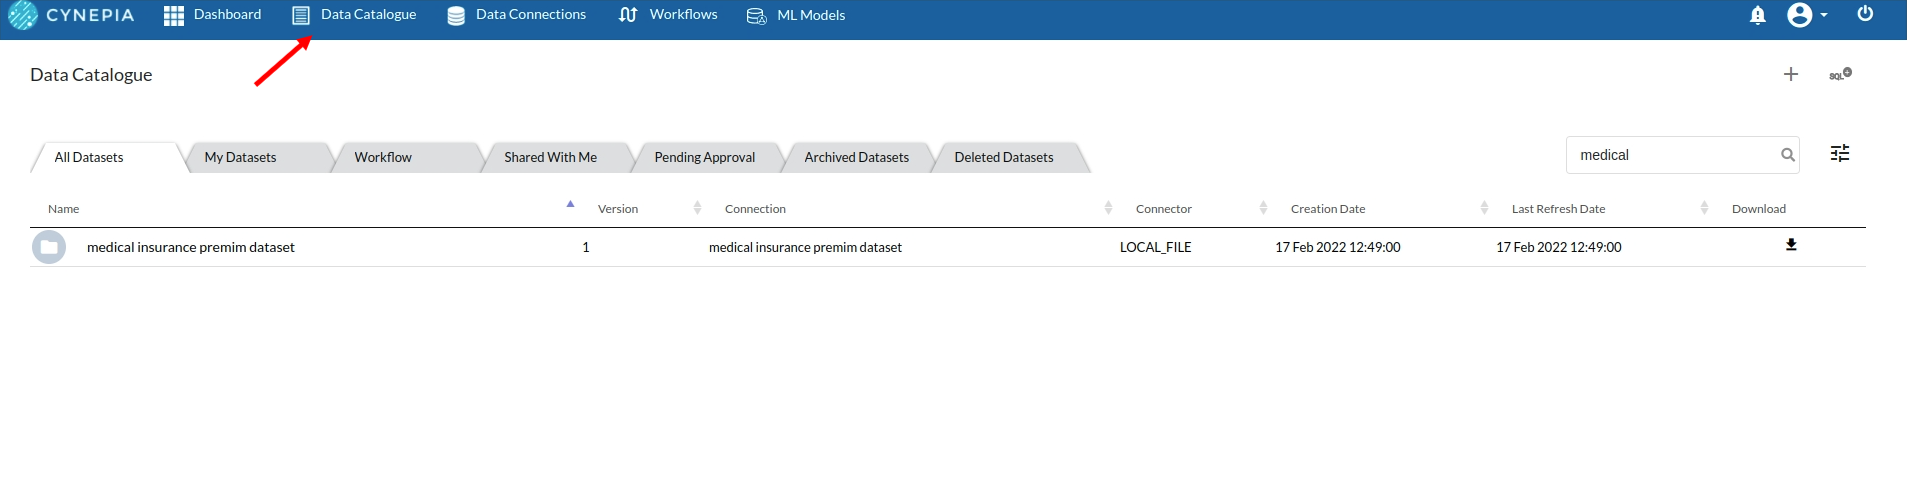
- Create a dataset under data catalogue from the uploaded datasource. For more information on how to create a dataset, refer to Data Catalogue
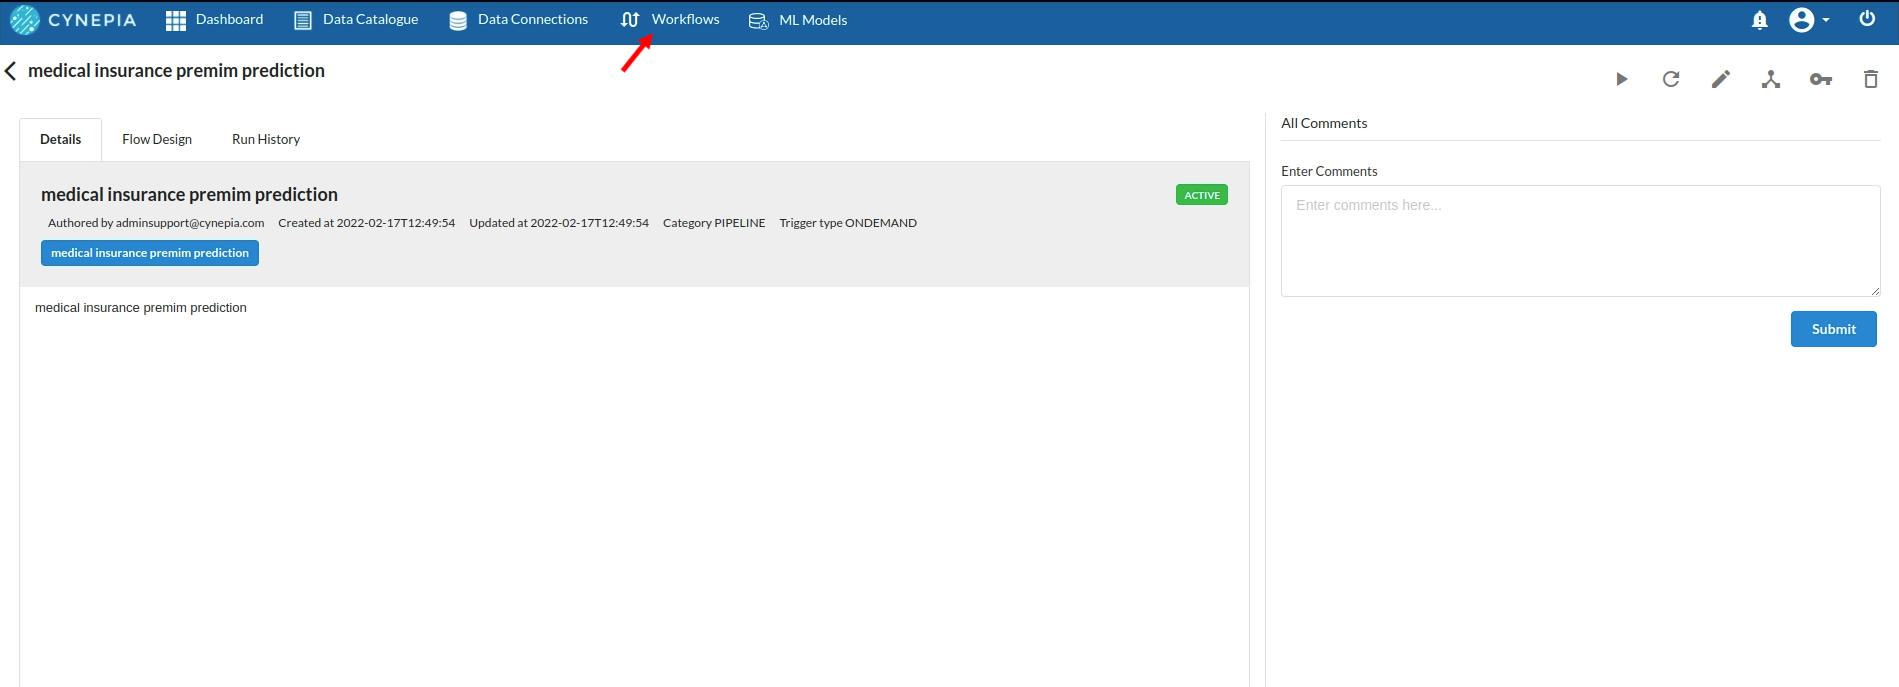
Create the Workflow for the experiment
- Go to the Workflows Tab on the Navigation and Create our first Regression Experiment/Workflow. For more information on how to create a workflow, refer to Create Workflow
Perform initial exploration of data columns
- Take a look at all the columns in the dataset . The view when you explore all the columns would look like the one below.
- The next part is to explore the histograms or in Xceed, it is a header profile to understand the distribution of the data columns. The distribution would look like the one below.
- for more univariate analysis . go to columns section in the view. The view would look like the one below. for more information on columns view ,refer to columns section
Perform Cleanup and Transform operations
With a wide range of processors, you will be able to do any kind of analysis, exploration, cleanup and transformations of the columns in your dataset. The view for getting the transformer panel would look like the one below. For more information , refer to Transformer Panel
![]()
Build/Train a regression Model
Feature Selection
before building any model it is necessary to look at all the columns' correlation and decide if a particular column is useful in any way .Go to Columns section and under multivariate analysis you will get the correlational matrix view which would look like the one below
Check the correlational between all the columns and decide which will make a good impact on the model .
Model building
The next step is to build a model . for this workflow you should be using Regression (auto pilot) processor, for more information on this processor ,refer to Regression(Auto Pilot). The amount of time that goes into writing all the code for train-test split, model selection, and column selection will be avoided here . The filled step would look like the one below.

Review the model output and Evaluate the model
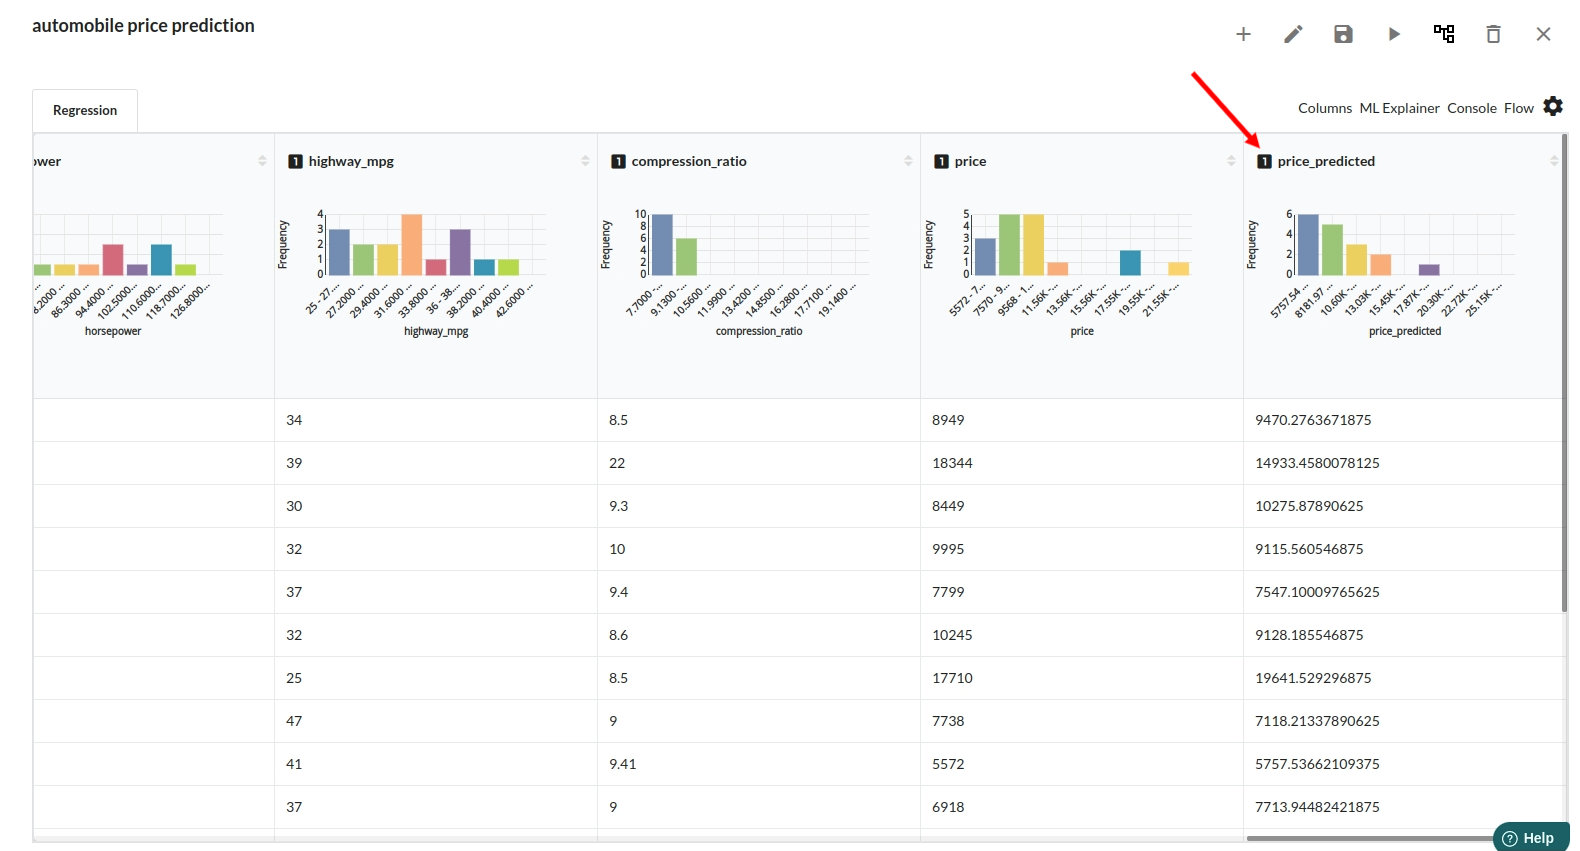
After you finish building the model, it is time to review the model output. Look at the output window to first review your predicted results .Since this is a regression problem you will get a new column in the view like the one below.
When you finish building your model you will see another tab in the view called Ml explainer . Click on that to evaluate your model.
![]()
- The first view you see when you click on ML explainer is the Summary view
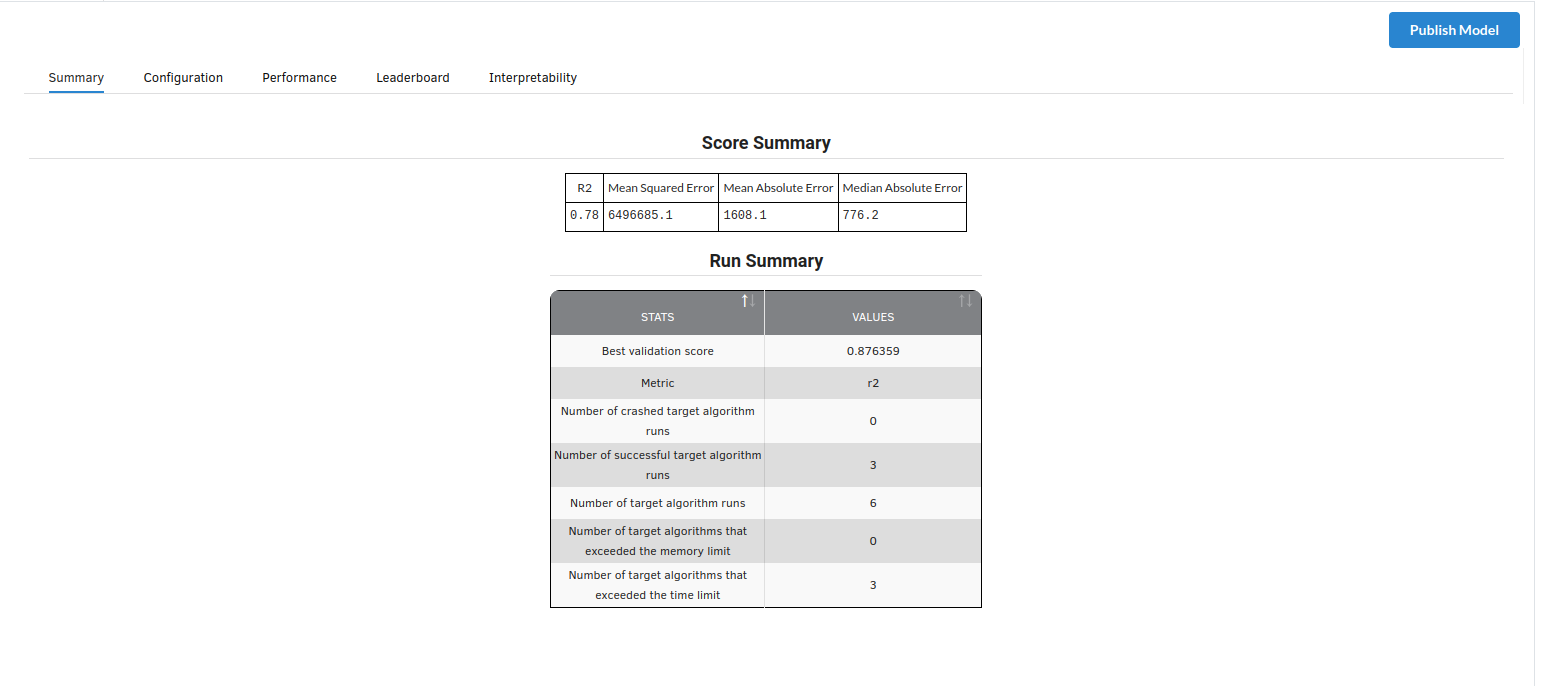
Look at the metrics score and the Run summary stats. Based on your calculations decide if the R2, mean Sqaured Error and Mean Absolute Error are according to your expecation. if not this will be your first step to rethink the training process.
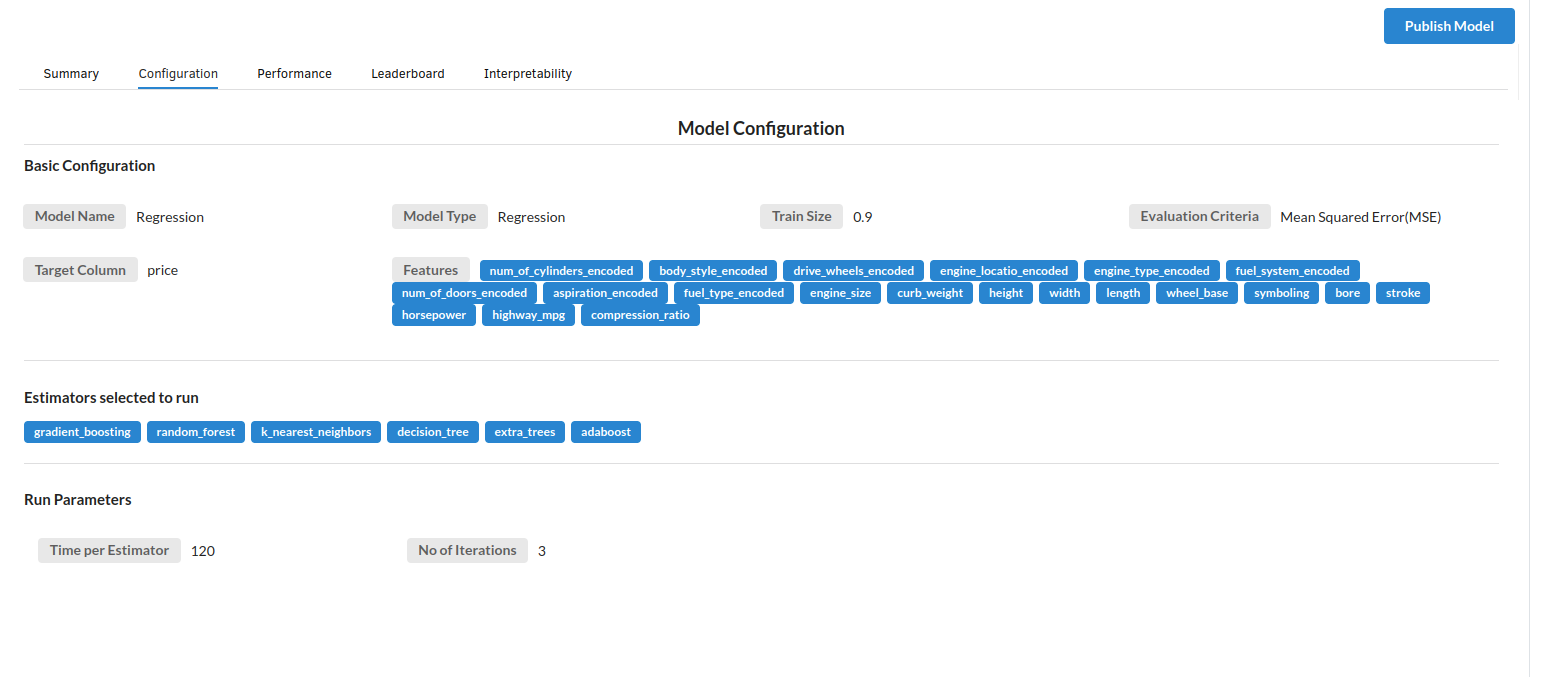
- The second view under Ml explainer is configuration view
The configuration view will give you the information about the step you filled in the Regression step . The view would look like the one below.
- The third view under Ml explainer is Performance View . You can see the actual vs predicted and the residual curve charts for regression. Look at the built charts and decide if the charts are good enough for your model. The actual vs predicted chart is a good indicator to understand how well your model was trained .
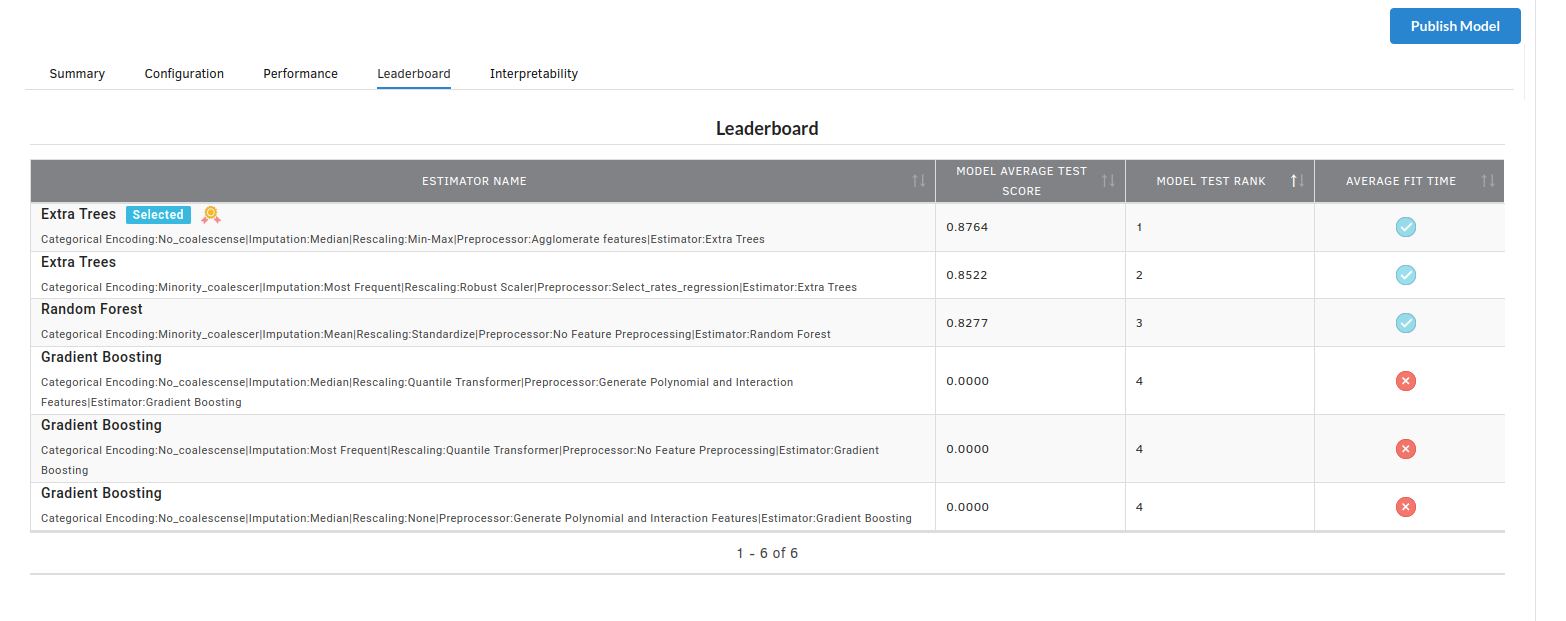
- The fourth view under Ml explainer is Leaderboard . In this view you can see the number of algorithms trained and all the feature engineering done on the algorithms used with ranking system to rank the best algorithm trained.
- The last view you see under ML explainer is Interpretability . In this view you will be able to interpret your model in simple terms where you will be getting results pertaining to feature importance , PDP Plots , Sub Population Analysis , Independant Explanation , Interactive Scoring . for more infomation on these results , refer to Interpretability . The Interpretability tab and the results under this tab would look like the one below.
- Feature Importance
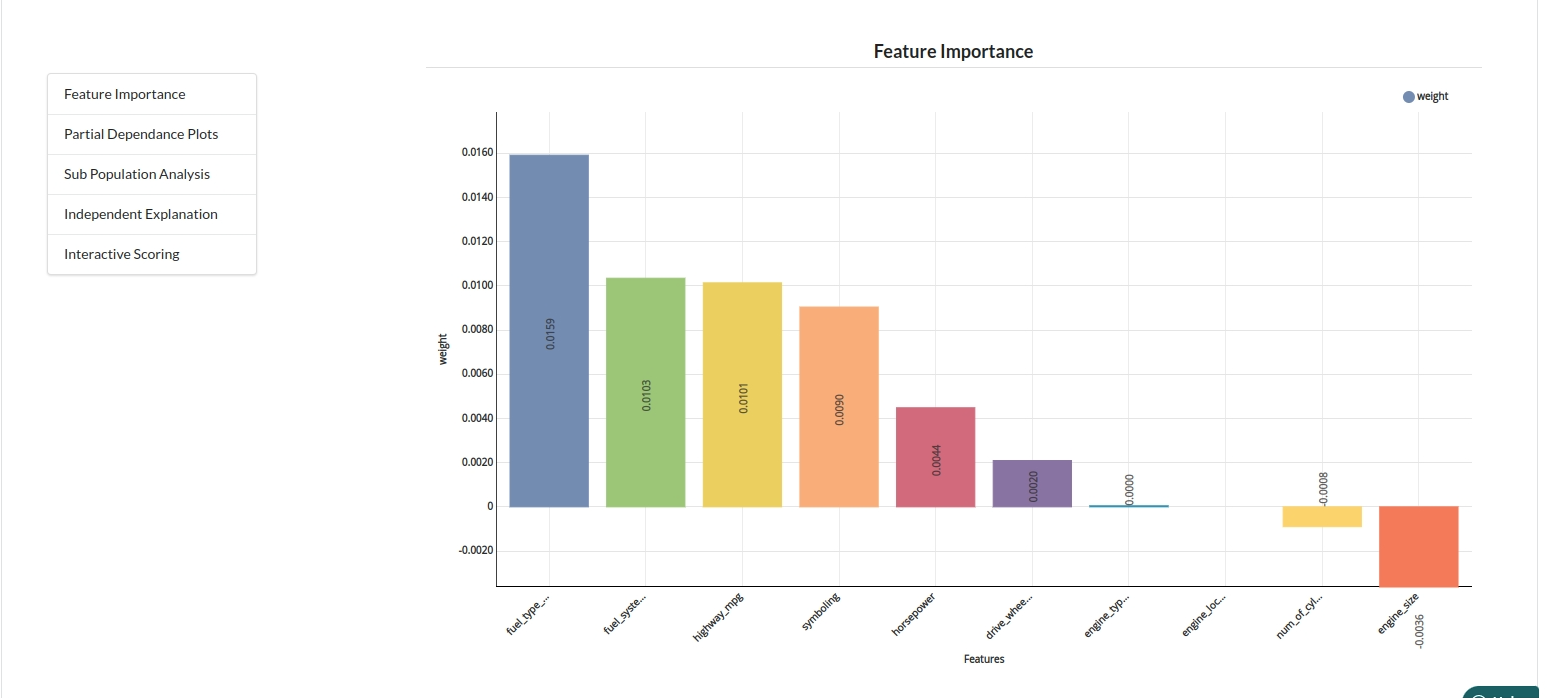
- Partial Dependance Plots

- Sub Population Analyis

-
Independant Explanation
-
Interactive Scoring