Life Insurance Risk Assessment prediction

What is Life insurance risk assessment ?
In a one-click shopping world with on-demand everything, the life insurance application process is antiquated. Customers provide extensive information to identify risk classification and eligibility, including scheduling medical exams, a process that takes an average of 30 days. The result? People are turned off. That’s why only 40% of U.S. households own individual life insurance. In any case, you would want to make it quicker and less labor intensive for new and existing customers to get a quote while maintaining privacy boundaries. By developing a predictive model that accurately classifies risk using a more automated approach, you can greatly impact public perception of the industry.
Objective
The Objective of this workflow is to clean the datasets, perform transformations , do univariate and bivariate analysis and build a machine learning model to classify the risk of the customers .
Business Goals
- By undestanding the data properly , any insurance company can make in any risk related issue properly through dashboards .
- The tedious job scheduling calls and making the customer wait for 30 days for approval is will be avoided
- Less man power to manage during the approvals sessions
- Flow of the Insurance approvals very easy if user can get a life insurance without having to work for it.
Relevance of Xceed
Xceed will give a NO-CODE environment for the end to end execution of this project starting with uploading of the datasets from various sources to deploying the model at the end point. Starting with exploring the data to building a model and deploying it , all of these are NO-CODE.
Data Requirements
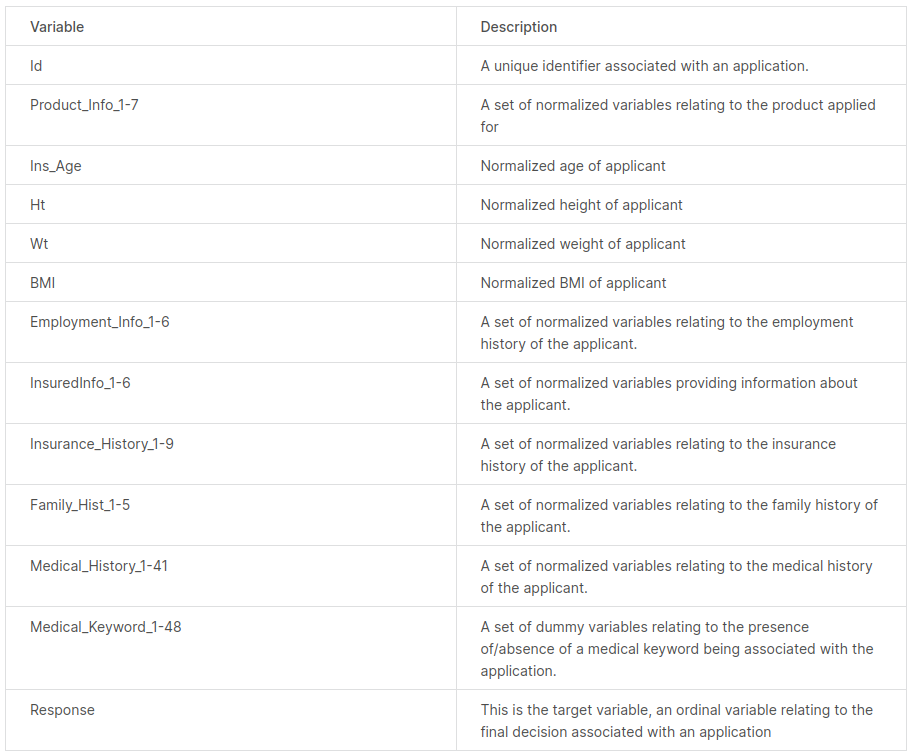
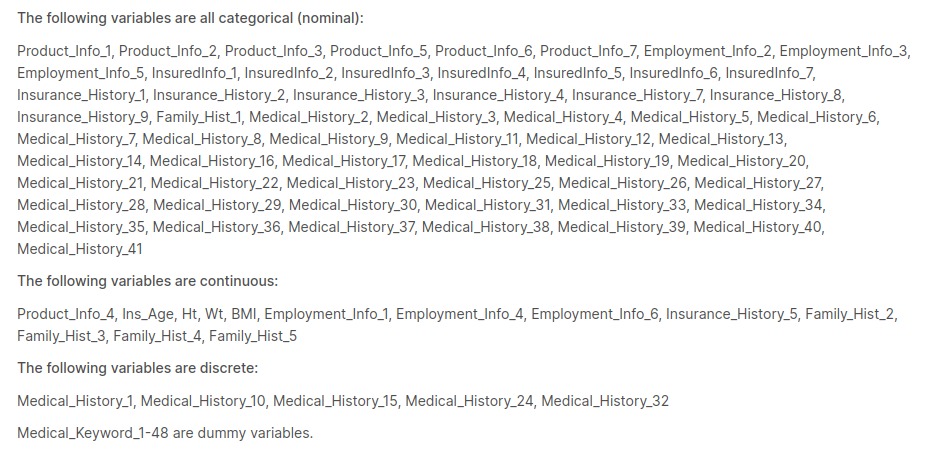
We will be needing two datasets such as train and test. the columns in these datasets are as below .
Output Expectations
The output Expecatation for this workflow would be a proper analysis of the data and a classfication Model to which is easy to understand and will let the insurance company classify the risk response of the customer.
Basic flow
- Upload the data to Xceed Analytics and create a dataset
- Create the Workflow for the experiment
- Perform initial exploration of data columns.
- Perform Cleanup and Tranform operations
- Build/Train a Classification Model
- Review the model output and Evaluate the model
- Deploy/Publish the model
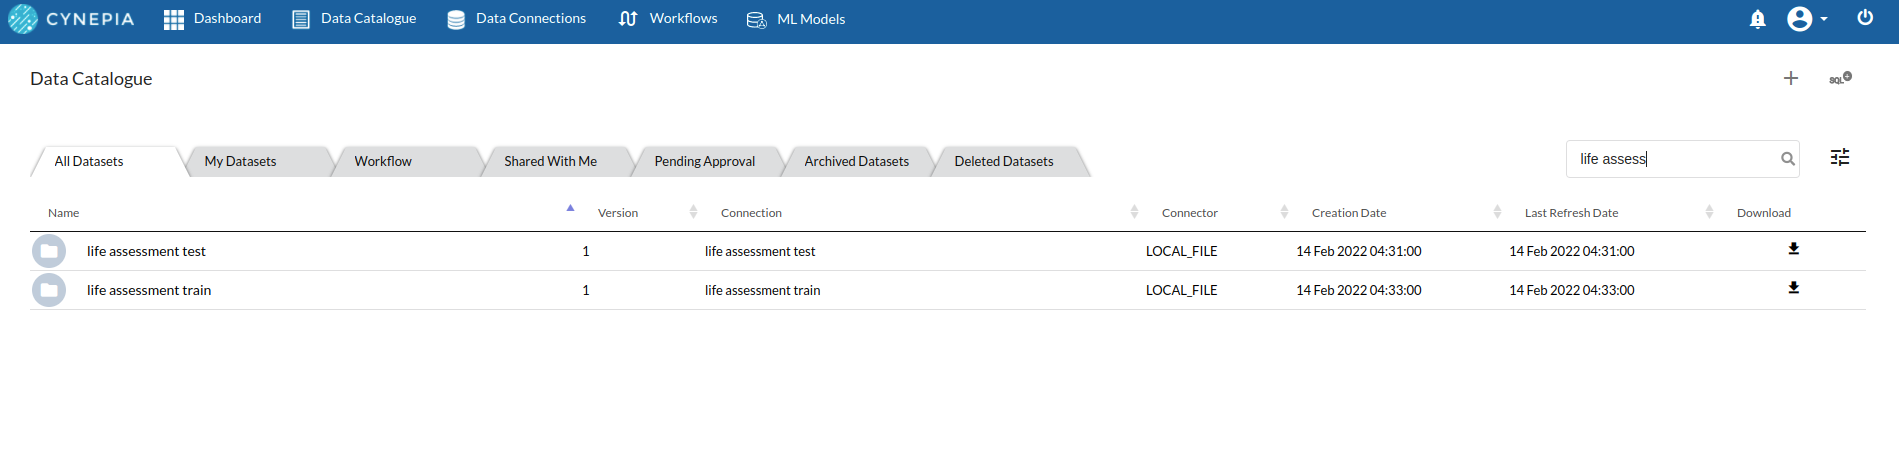
Upload the data to Xceed Analytics and create a dataset
- Upload all the datasets to Xceed Analytics fromt the Data Connections Page. For more information on Data Connections refer to Data Connections
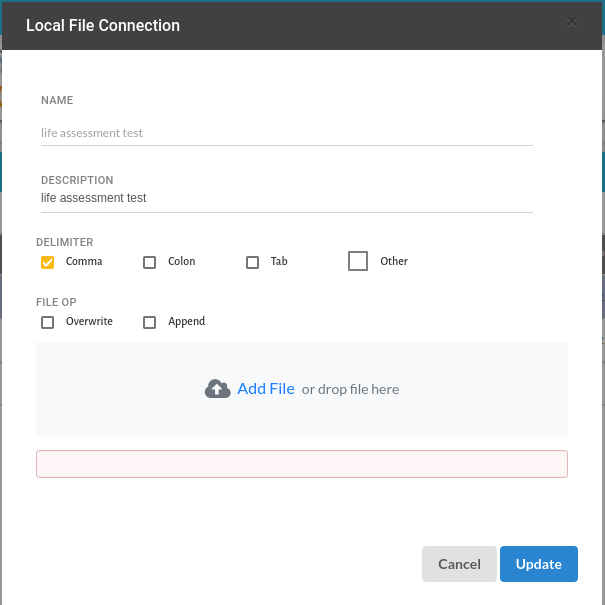
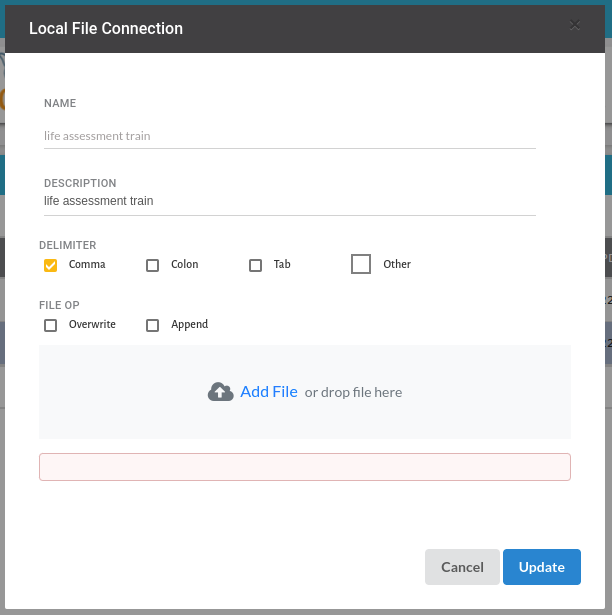
- Create datasets under data catalogue from the uploaded datasource. For more information on how to create a dataset, refer to Data Catalogue
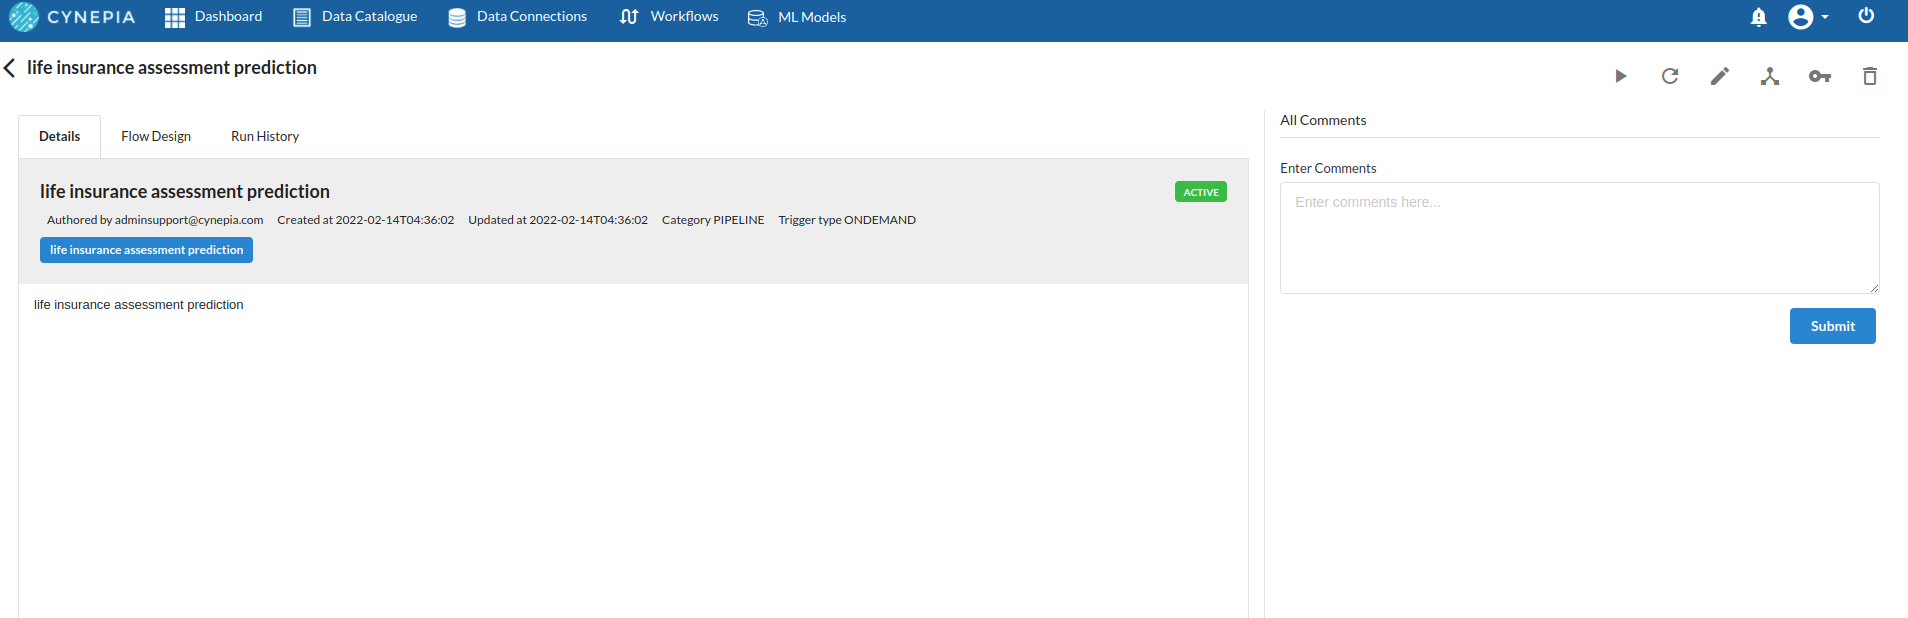
Create the Workflow for the experiment
- Go to the Workflows Tab on the Navigation and Create our first Regression Experiment/Workflow. For more information on how to create a workflow, refer to Create Workflow
Perform initial exploration of data columns
Take a look at the output view and glance at the datatypes of the columns. for more information on the output window , refer to Output Window

Take a look at the distribution of the data columns with the header profile on the top of the output view.
Go to columns section to do some univariate analysis on all the columns. for more information, refer to Columns

Perform Cleanup and Transform Operations
All the steps under cleanup and transforms with the description in the form of a step are as below
- Concat Tables :
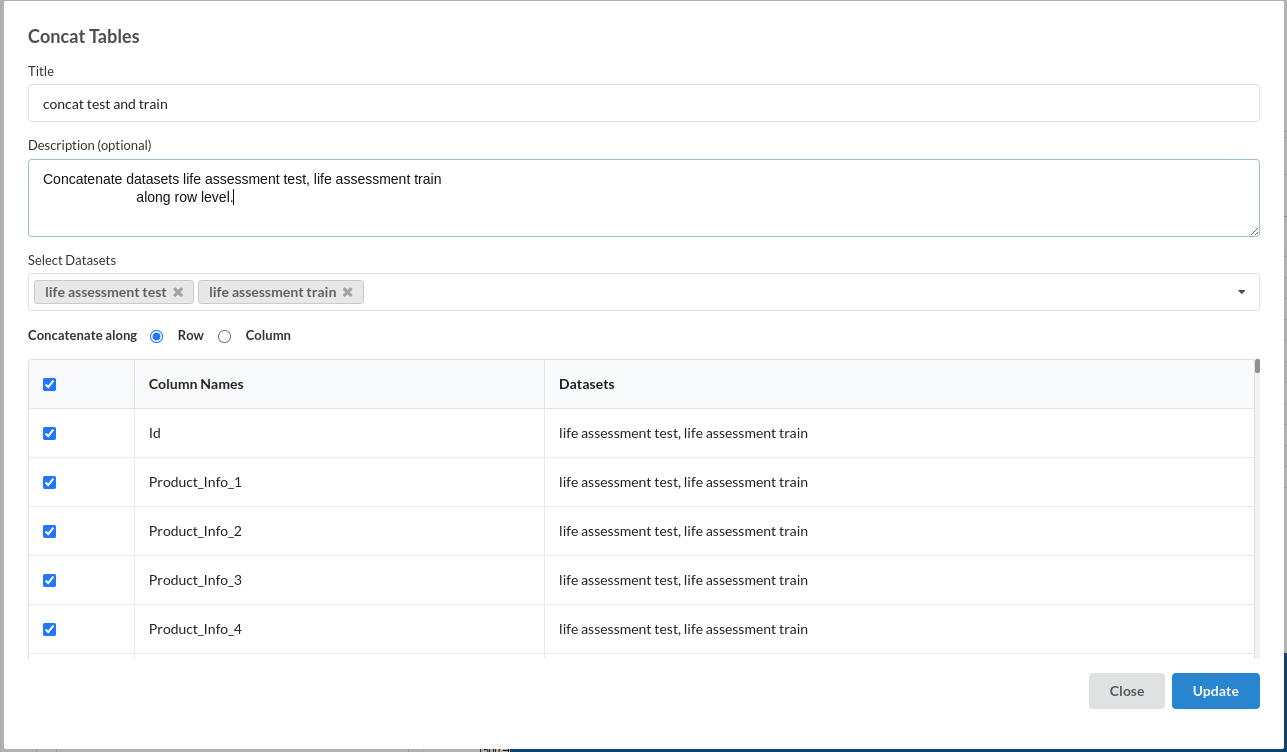
for more information on this processor,refer to Concat Tables
- Conditional Column :
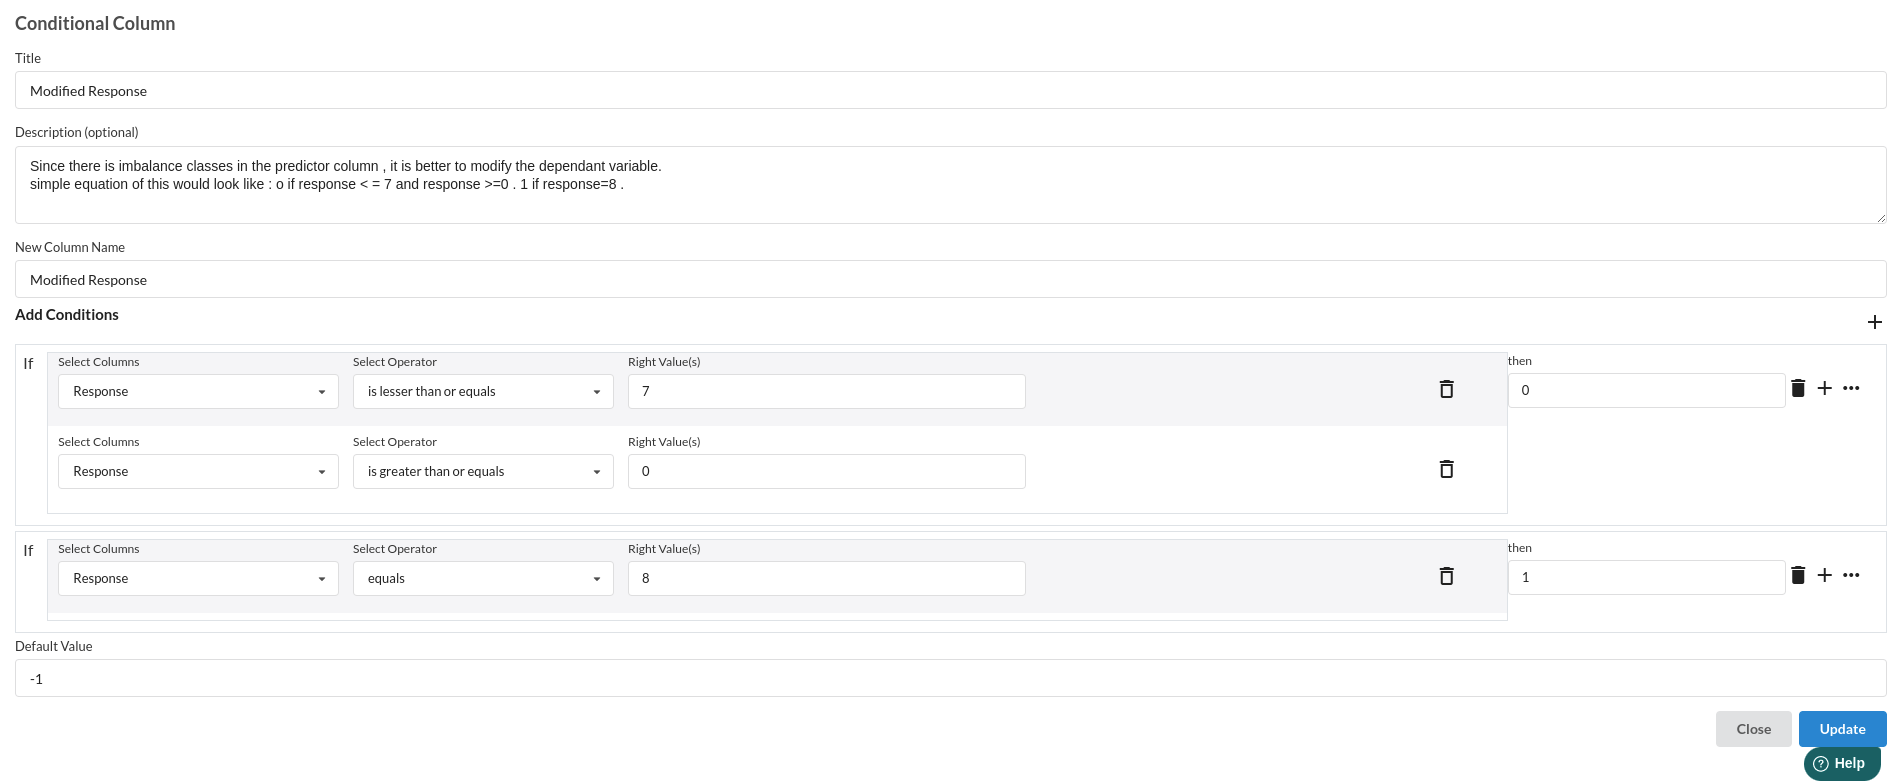
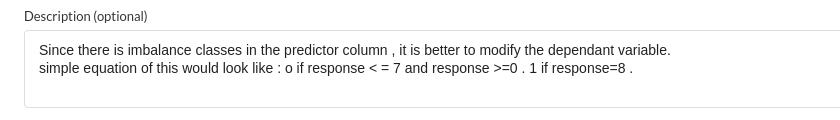
for more information on this processor,refer to Conditional Columns
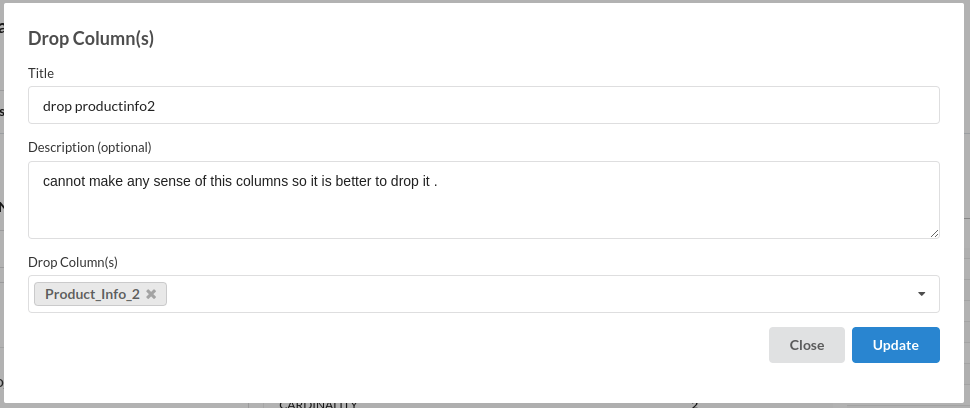
- Drop Columns :
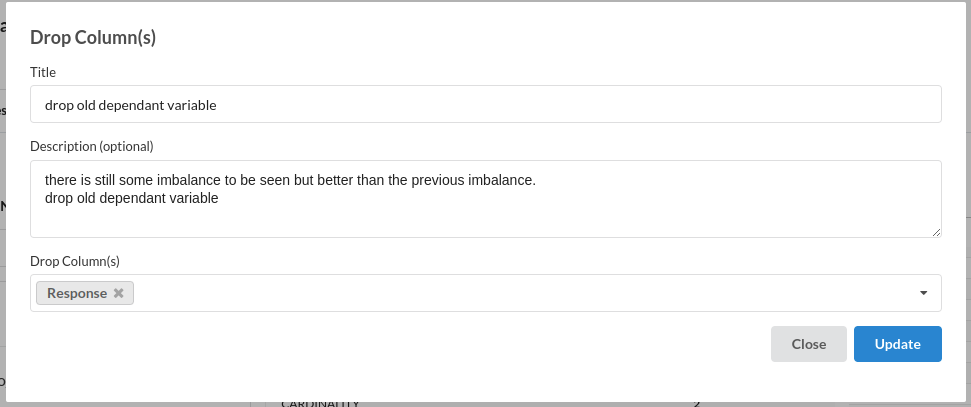
for more information on this processor,refer to Drop columns
- Drop Empty cells:
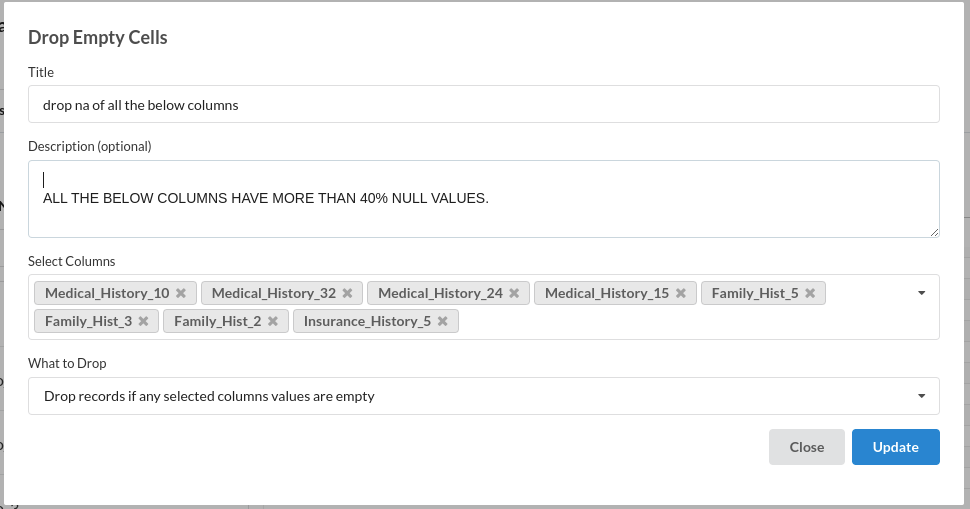
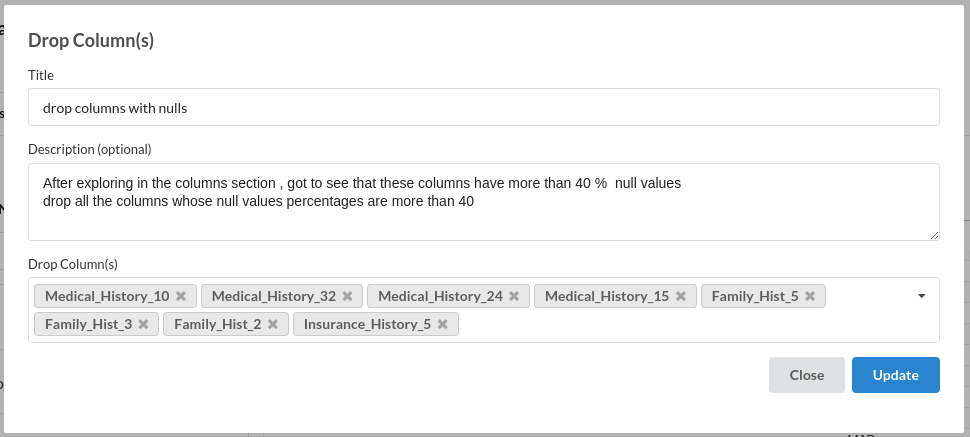
- Drop Columns :
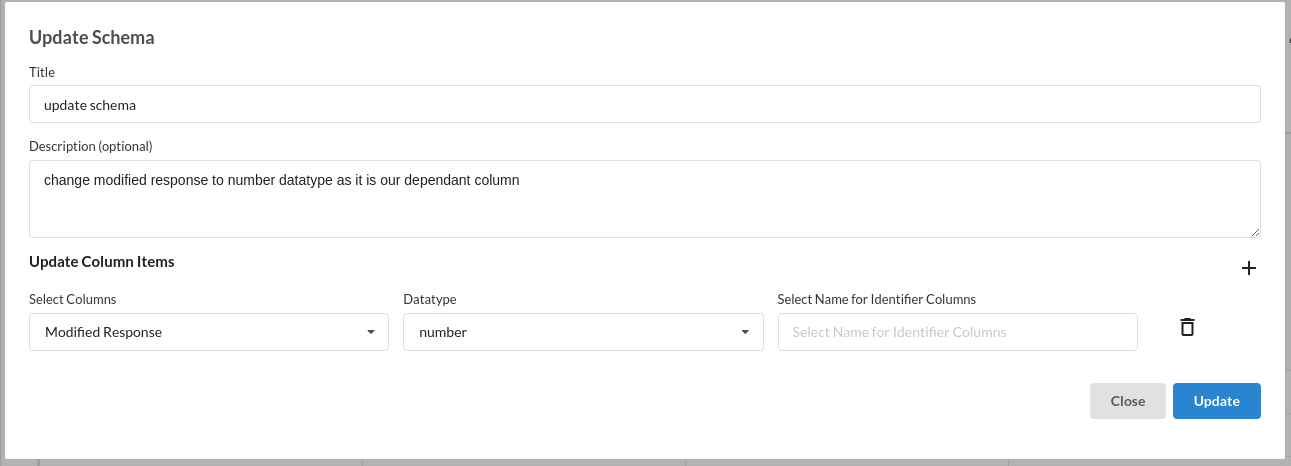
- Update Schema :
Build a Classifier Model
- Classification(Auto Pilot) :

Review the model output and Evaluate the model
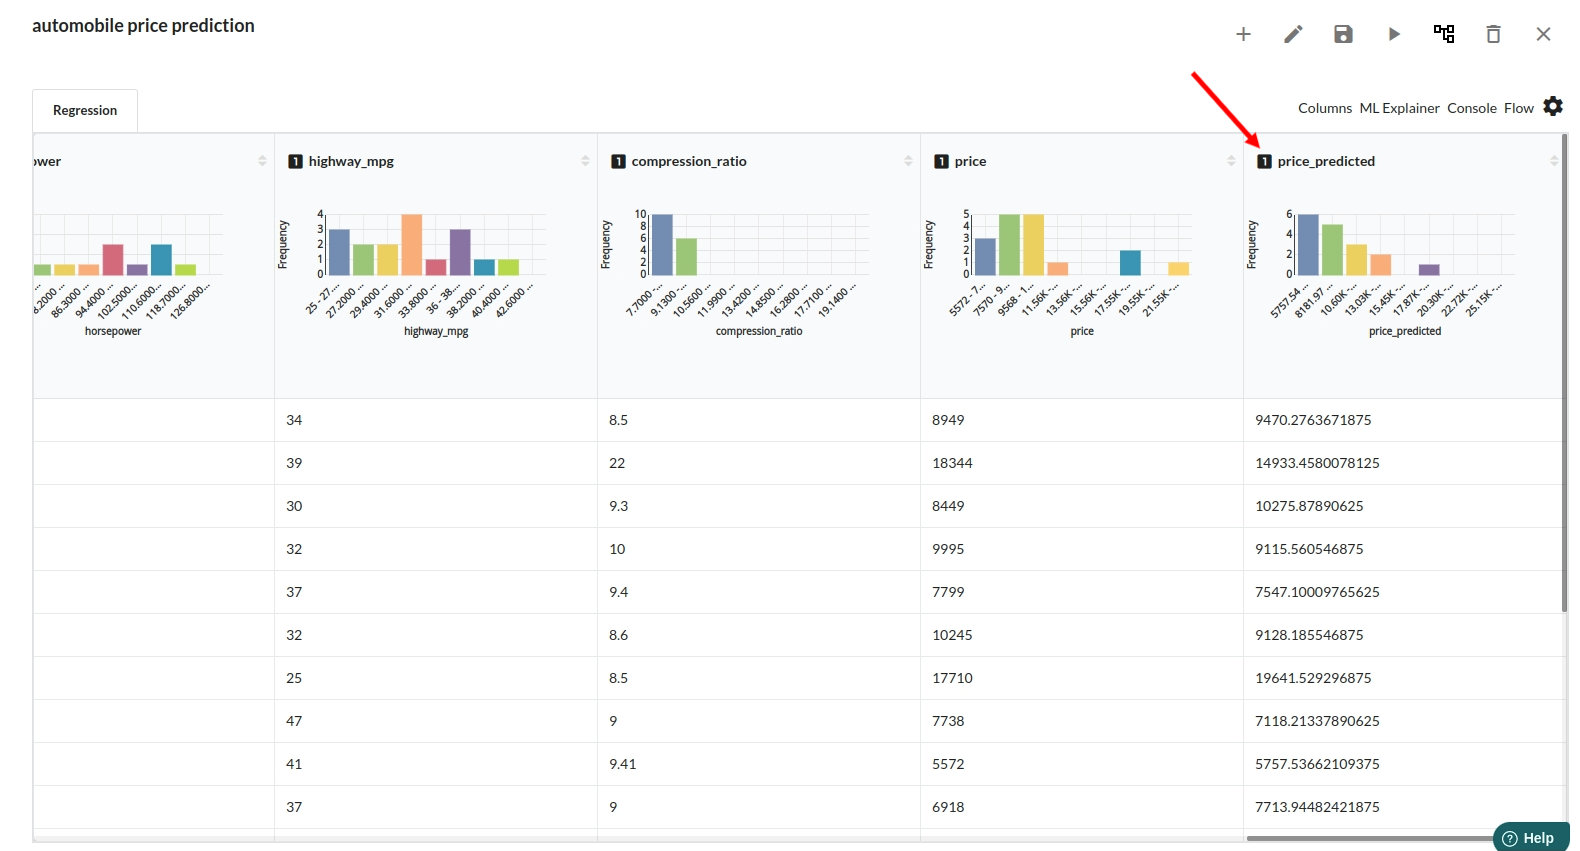
After you finish building the model, it is time to review the model output. Look at the output window to first review your predicted results .Since this is a regression problem you will get a new column in the view like the one below.
When you finish building your model you will see another tab in the view called Ml explainer . Click on that to evaluate your model.
![]()
- The first view you see when you click on ML explainer is the Summary view
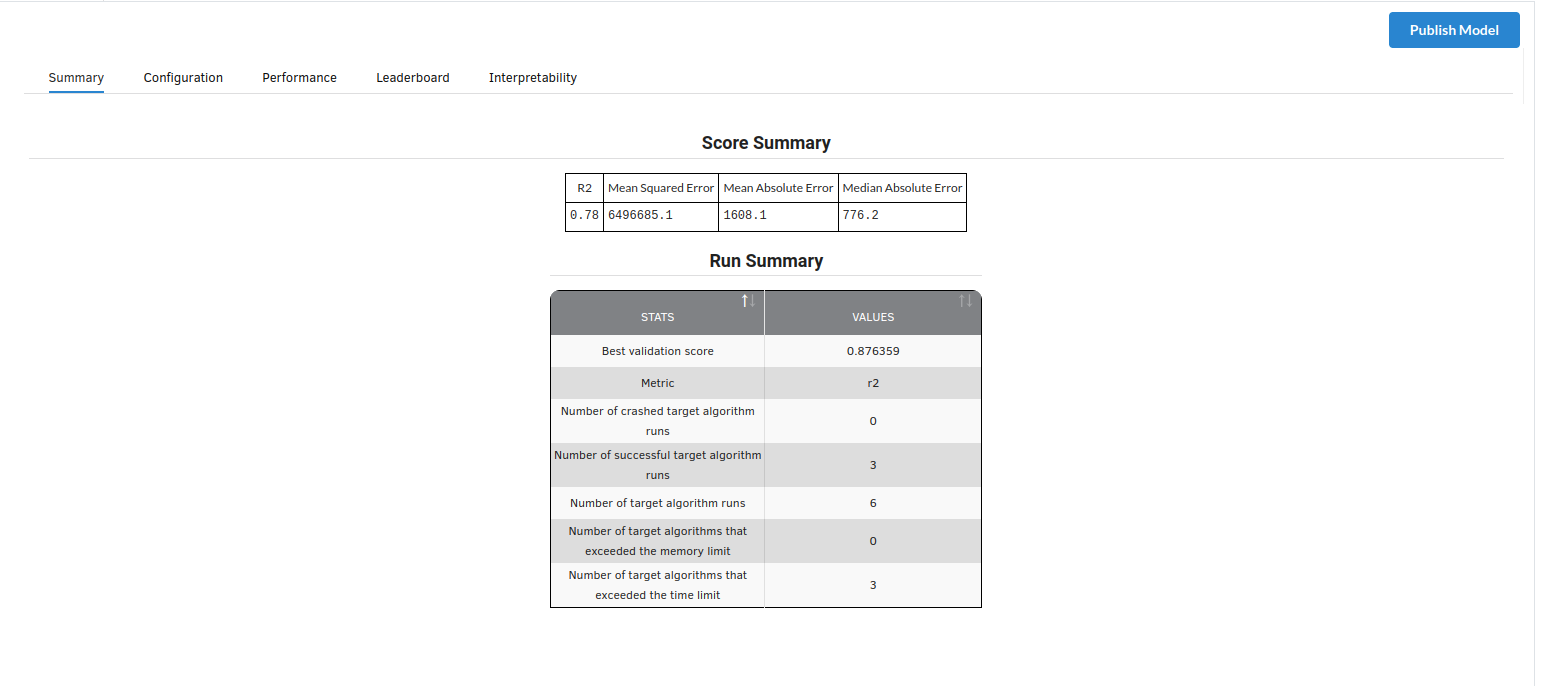
Look at the metrics score and the Run summary stats. Based on your calculations decide if the R2, mean Sqaured Error and Mean Absolute Error are according to your expecation. if not this will be your first step to rethink the training process.
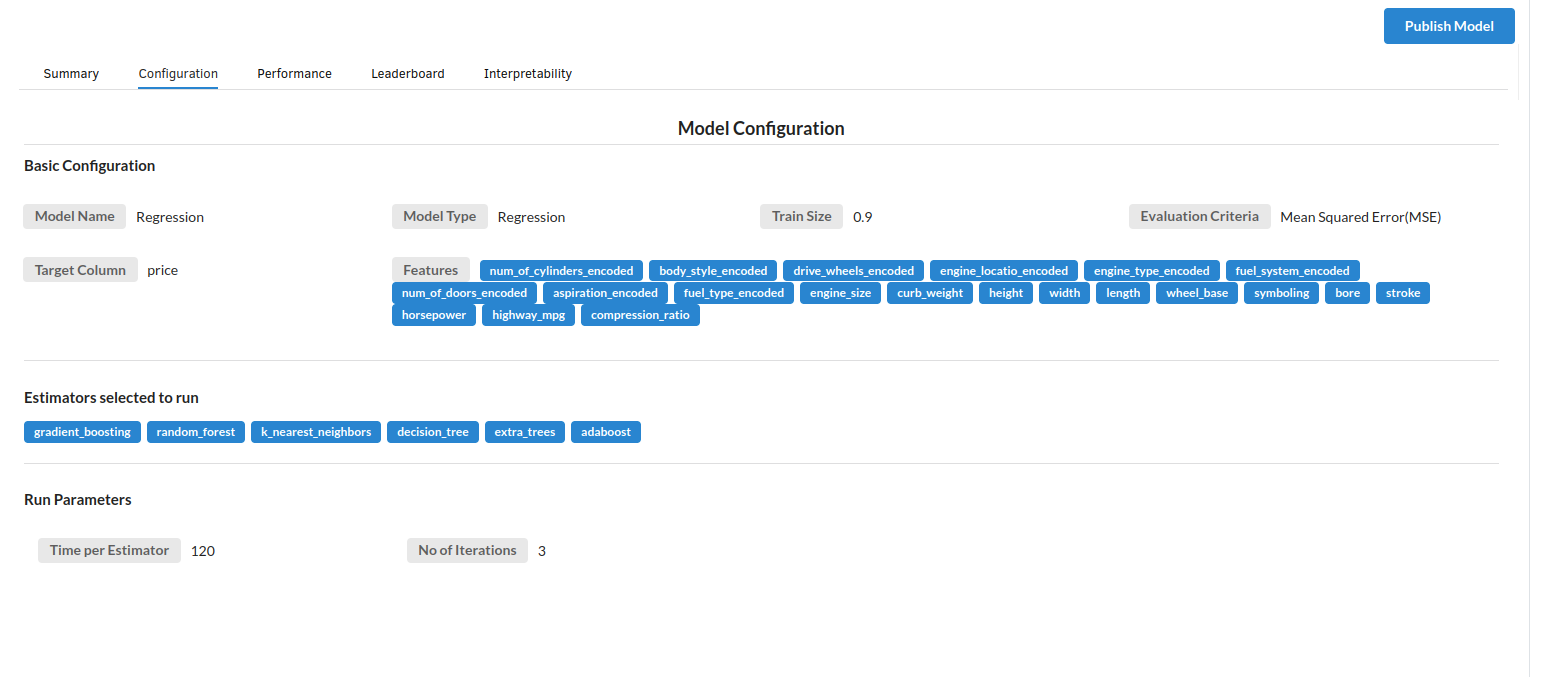
- The second view under Ml explainer is configuration view
The configuration view will give you the information about the step you filled in the Regression step . The view would look like the one below.
- The third view under Ml explainer is Performance View . You can see the actual vs predicted and the residual curve charts for regression. Look at the built charts and decide if the charts are good enough for your model. The actual vs predicted chart is a good indicator to understand how well your model was trained .
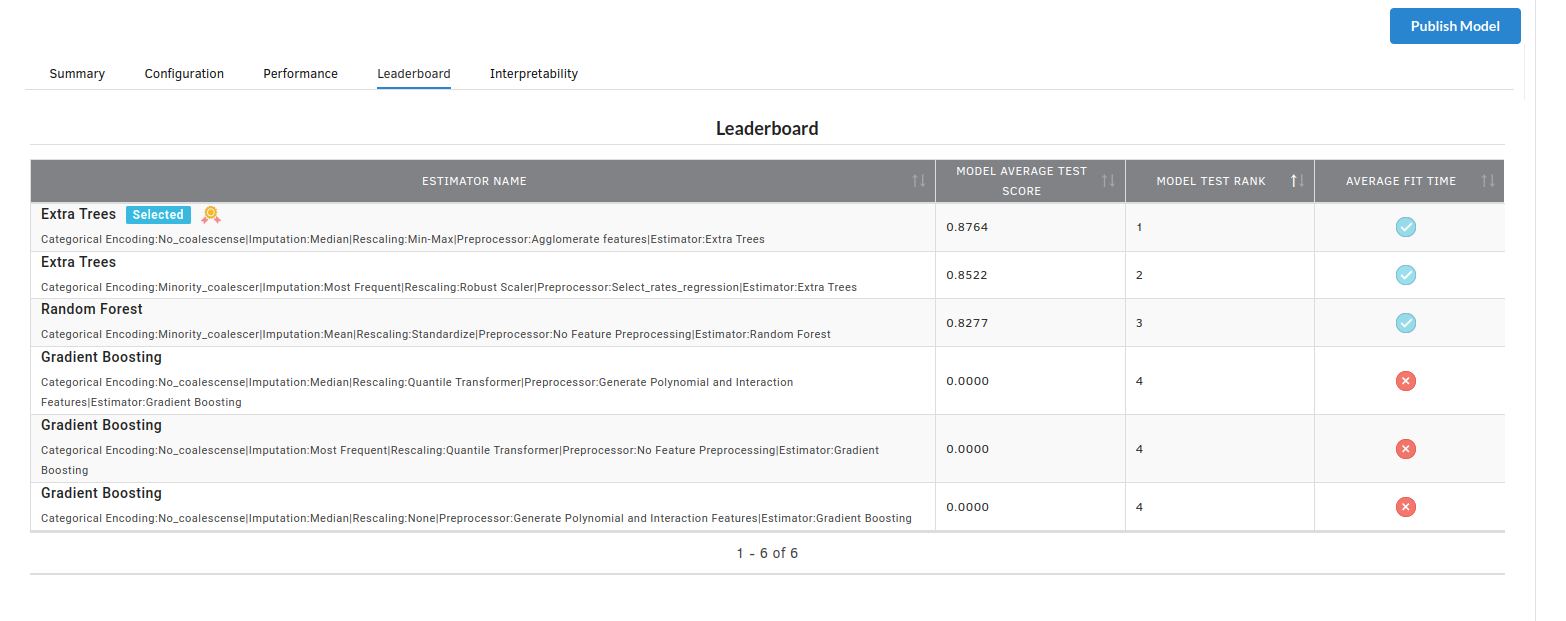
- The fourth view under Ml explainer is Leaderboard . In this view you can see the number of algorithms trained and all the feature engineering done on the algorithms used with ranking system to rank the best algorithm trained.
- The last view you see under ML explainer is Interpretability . In this view you will be able to interpret your model in simple terms where you will be getting results pertaining to feature importance , PDP Plots , Sub Population Analysis , Independant Explanation , Interactive Scoring . for more infomation on these results , refer to Interpretability . The Interpretability tab and the results under this tab would look like the one below.
- Feature Importance
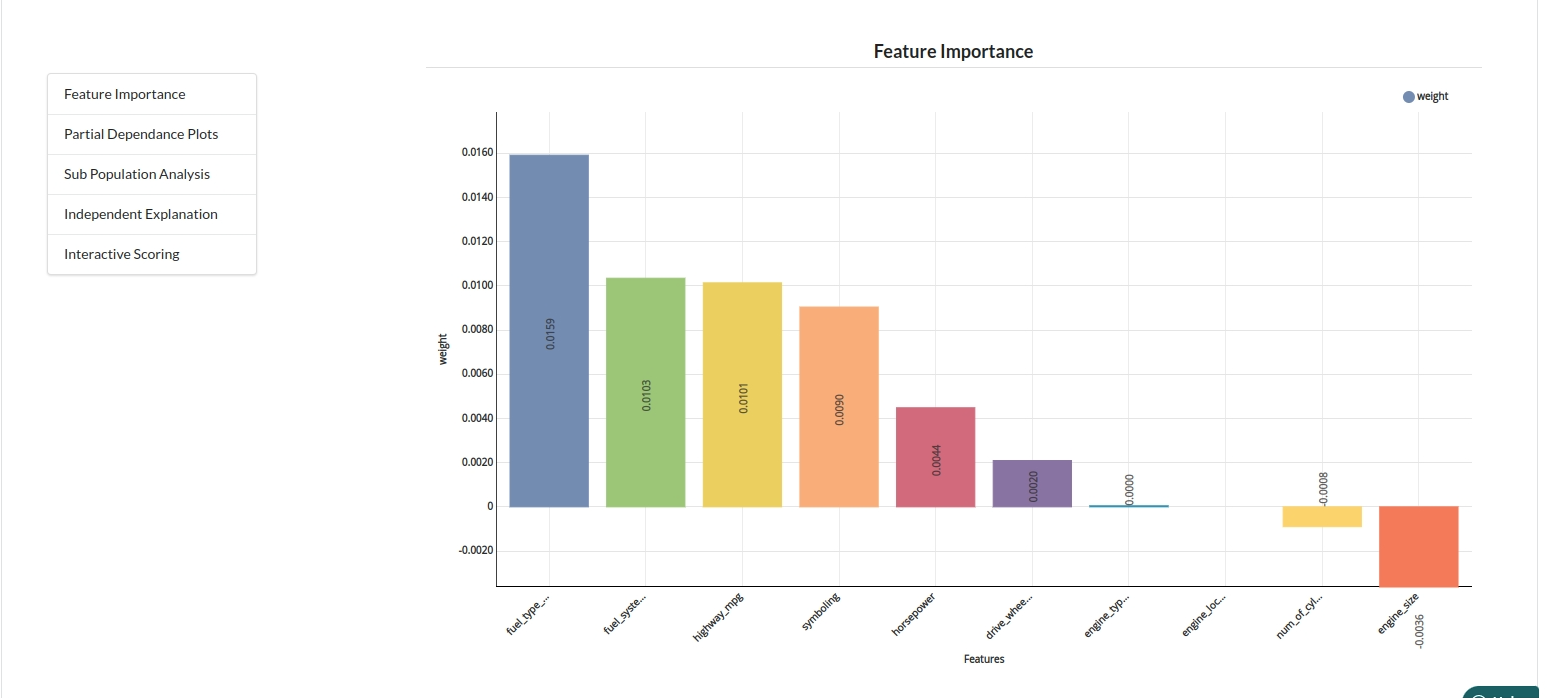
- Partial Dependance Plots

- Sub Population Analyis

-
Independant Explanation
-
Interactive Scoring