Vertical Bar
Create a Vertical Bar chart
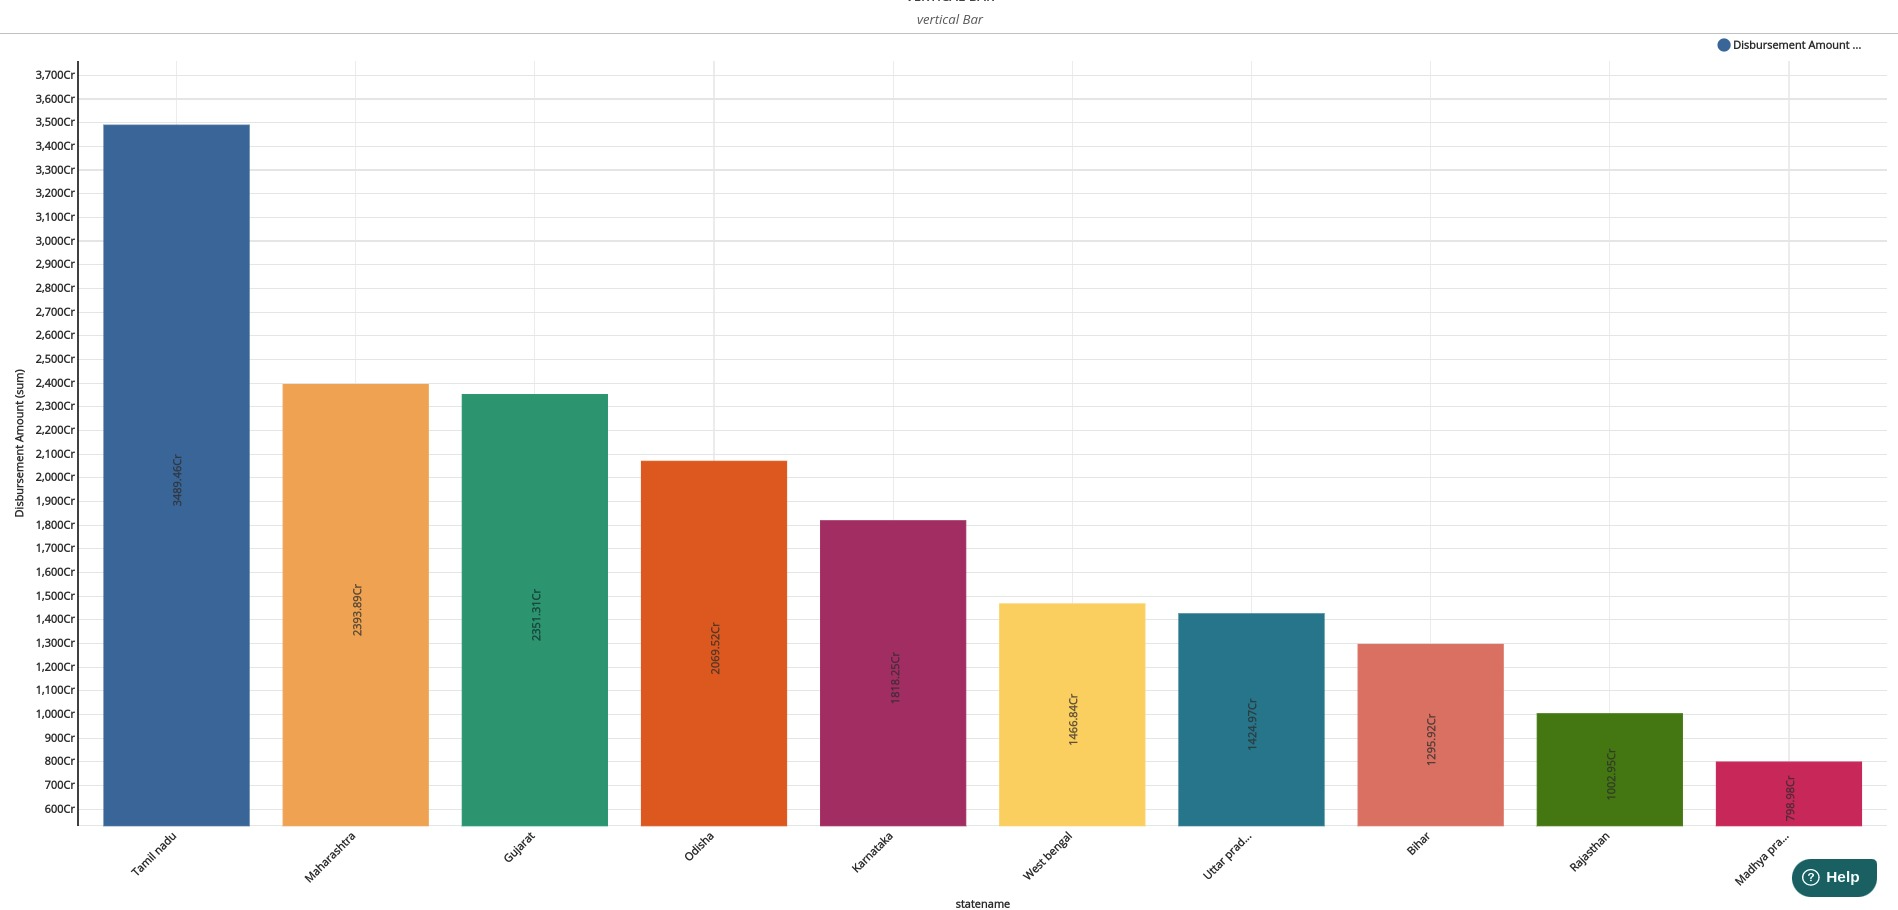
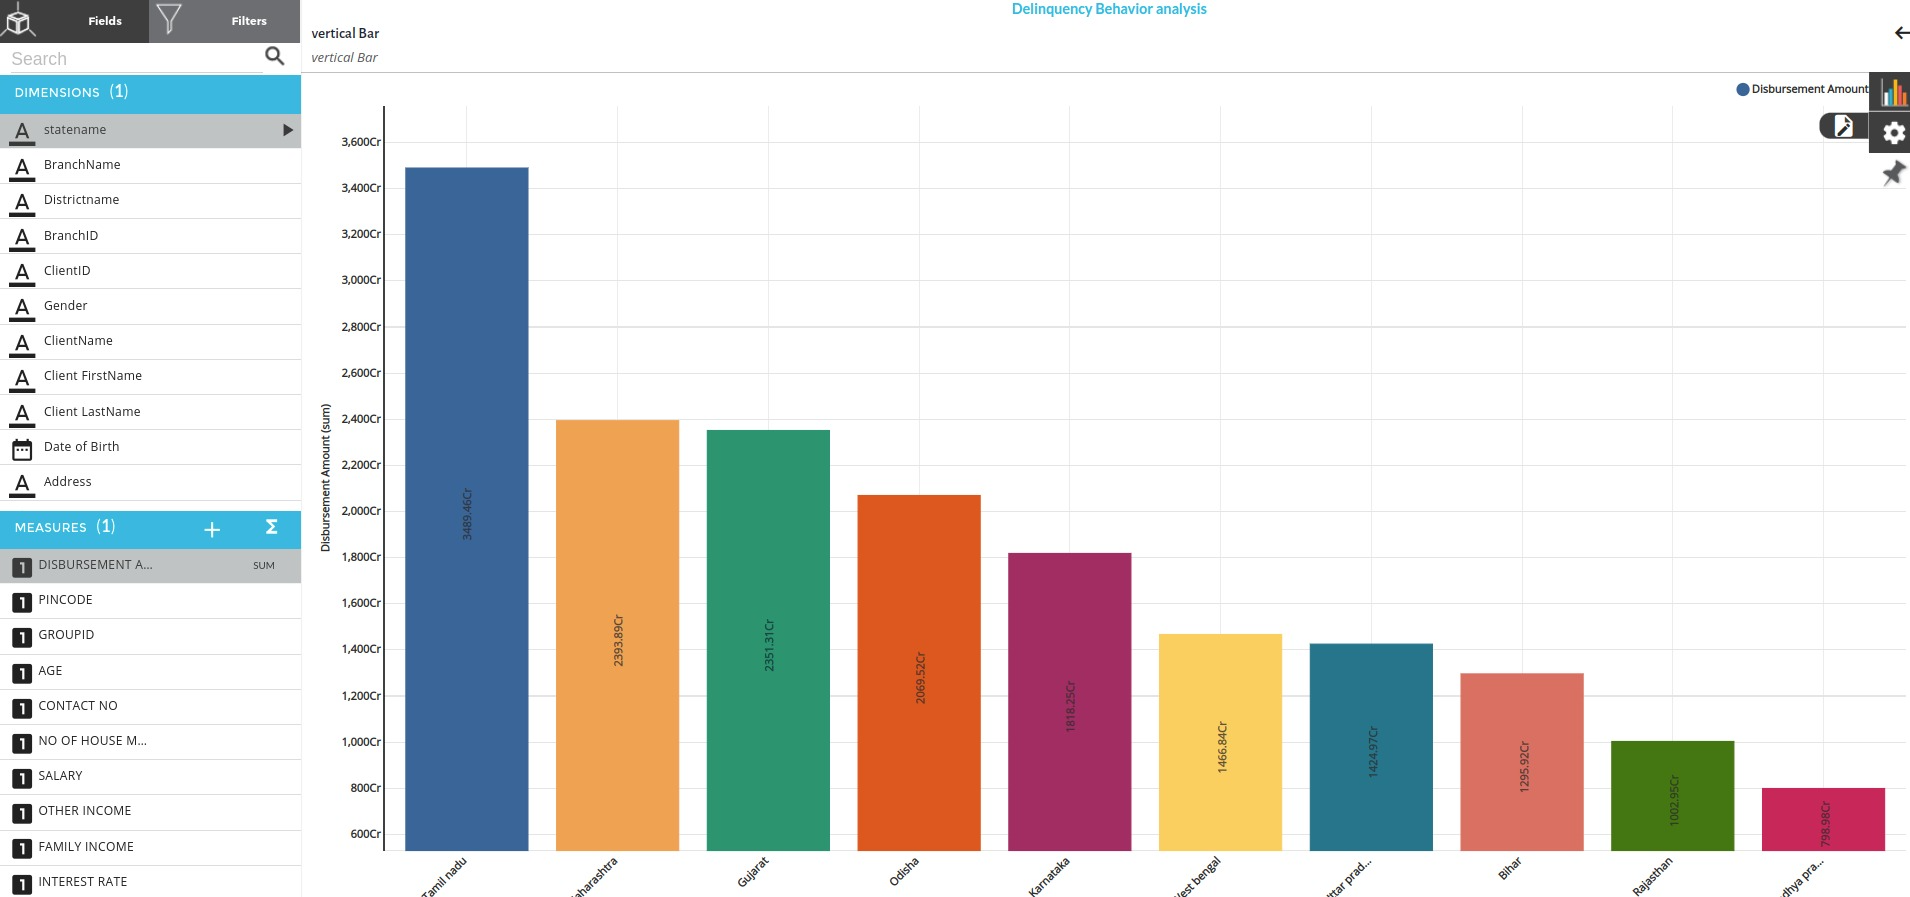
Vertical bar charts display data in a series of bars that run from the bottom to the top of the chart. Vertical bar graphs use the x-axis for labeling categories, while numeric data is measured along the y-axis.
Follow the below steps to create a Vertical Bar Chart :
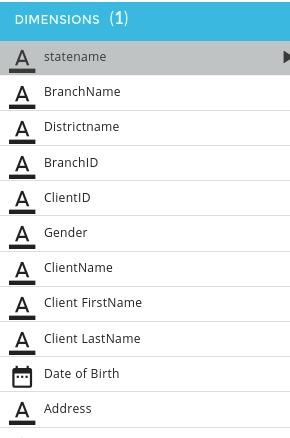
- Select a Dimension of your choice
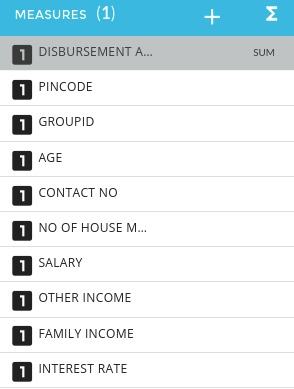
- Select a Measure of your choice and choose from the supported aggregation types
- Click on the chart icon you see on the top right of the page
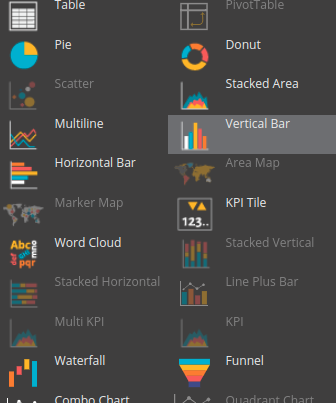
You will see a pop up which includes all the chart types supported by Xceed. Click on the Vertical Bar
- Choose the type of settings you would like from the General Settings
- Choose the type of settings you would like from the Widget Settings . Widget settings are specific to the chart styles , abbrevations and formats

- Click on Save to finish creating the table
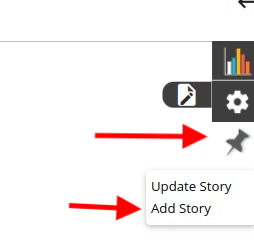
- Click on the Pin icon you see near the chart and settings icon after saving the chart. This will allow your charts to be added in the dashboard.