Genetics Disorder Prediction

Background
A genetic disorder is an illness caused in part or entirely by a deviation from the usual DNA sequence. A single gene mutation (monogenic disorder), numerous gene mutations (multifactorial inheritance disorder), a combination of gene mutations and environmental factors, or chromosome damage can all cause genetic illnesses .Some disorders, such as sickle cell disease, are caused by mutations that are inherited from one's parents and present at birth. Other diseases are caused by mutations in a gene or a collection of genes that arise over the course of a person's life. These mutations are not inherited from a parent, but rather occur at random or as a result of exposure to the environment (such as cigarette smoke). Many malignancies, as well as some kinds of neurofibromatosis, fall within this category.In order to learn more about promoting health and preventing sickness, it is necessary to understand genetic determinants and genetic abnormalities. Some genetic alterations have been linked to a higher risk of producing a child with a birth defect or developmental disability, as well as the development of diseases including cancer and heart disease.Genetics can also assist us in comprehending how medical disorders develop.
The number of genetic disease ailments has increased as a result of unsustainable population growth and a lack of proper health care, food, and shelter. Due to a lack of awareness about the importance of genetic testing, hereditary disorders are becoming increasingly widespread. Because these disorders frequently end in death in children, genetic testing during pregnancy is essential.
Objective
This usecase is an attempt to determine if a patient has genetics disorder based on their health conditions and genetics information. The main objective is to recognize and analyse the information available,test it using different classification models,evaluate and improve the best model and present the findings and discuss what needs to be done next.
Relevance of Xceed Analytics
Xceed Analytics provides a single integrated data and AI platform that reduces friction in bring data and building machine models rapidly. It further empowers everyone including Citizen Data Engineers/Scientist to bring data together and build and delivery data and ml usecases rapidly. It's Low code/No code visual designer and model builder can be leveraged to bridge the gap and expand the availability of key data science and engineering skills.
This usecase showcases how to create, train/test, and deploy a genetics disorder detection/prediction classification model. The datasets are obtained from Kaggle. Genetics disorder dataset is used for this purpose .Xceed will provide a NO-CODE environment for the end-to-end implementation of this project, starting with the uploading of datasets from numerous sources to the deployment of the model at the end point. All of these steps are built using Visual Workflow Designer, from analyzing the data to constructing a model and deploying it.
Data Requirements
The dataset that is used here includes :
- Genetics Disorder dataset : contains patient's genetics and health information.
Columns of interest in the dataset
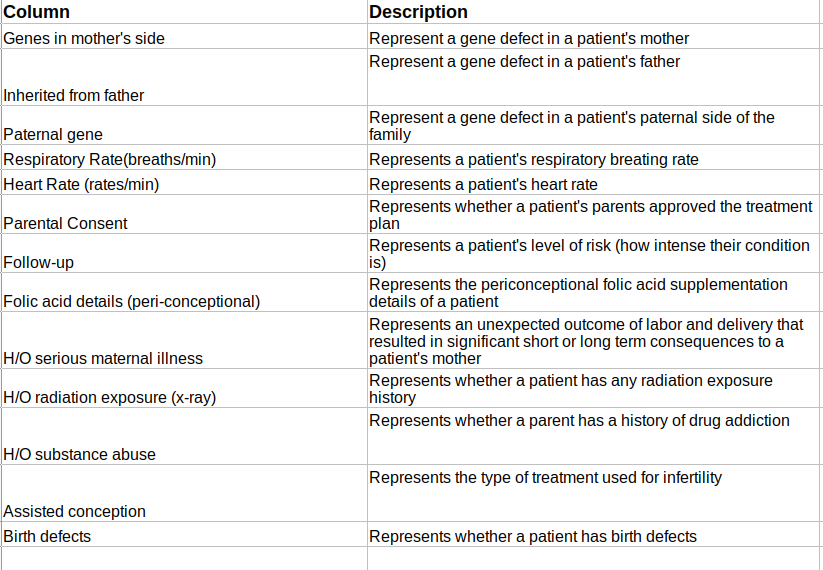
Model Objective
Understanding trends in genetics disorder from the genetics information and predicting the genetic disorder a patient is likely to have by analysing the underlying data, constructing a classification machine learning model, and implementing it after defining the model's major features.
Steps followed to develop and deploy the model
- Upload the data to Xceed Analytics and create a dataset
- Create the Workflow for the experiment
- Perform initial exploration of data columns.
- Perform Cleanup and Tranform operations
- Build/Train a classification model
- Review the model output and Evaluate the model
- Improve on the metrics which will be useful for the productionizing
- Deploy/Publish the model
Upload the data to Xceed Analytcs and Create the dataset
- From the Data Connections Page, upload the the dataset to Xceed Analytics. For more information on Data Connections refer to Data Connections
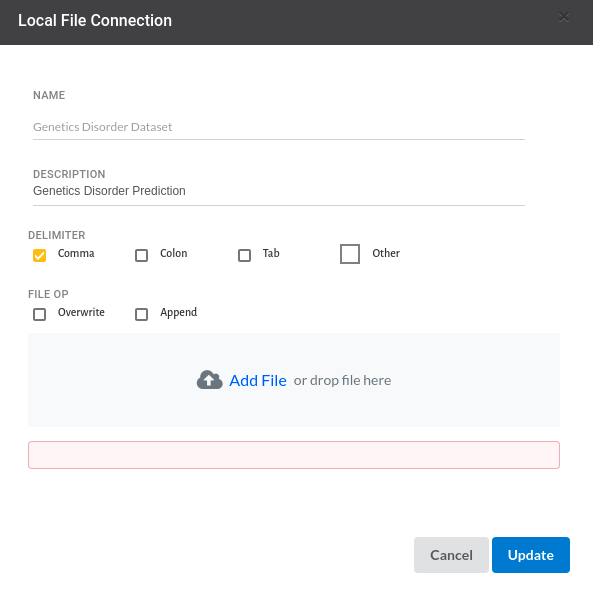
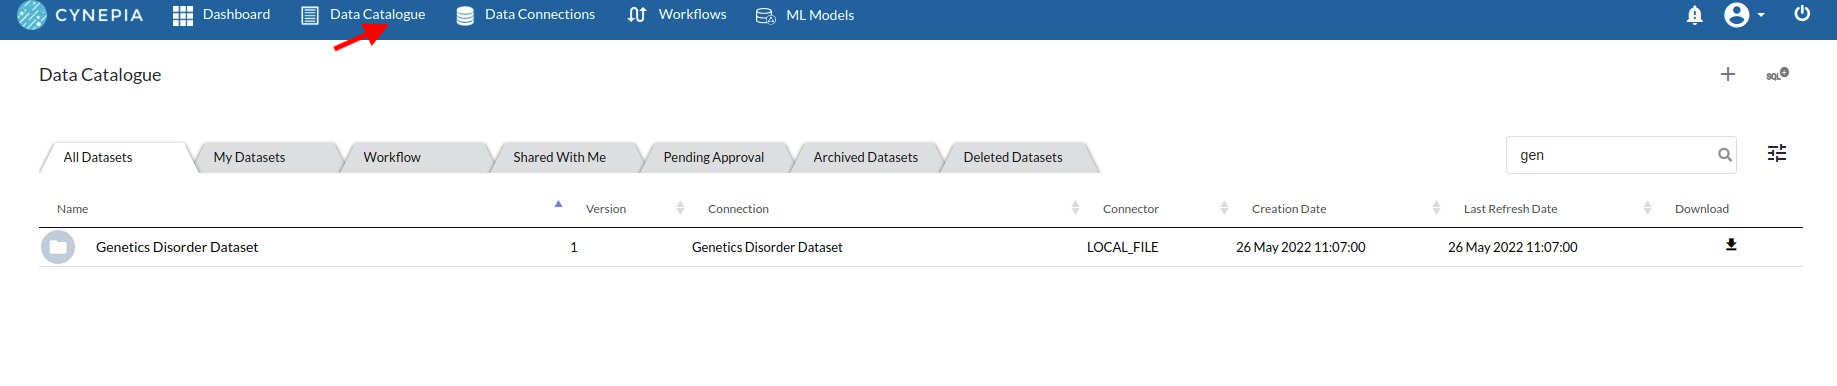
- Create a dataset for each dataset from the uploaded datasource in the data catalogue. Refer to Data Catalogue for more information on how to generate a dataset.
Create the Workflow for the experiment
- Create a Workflow by going to the Workflows Tab in the Navigation.Refer Create Workflow for more information.
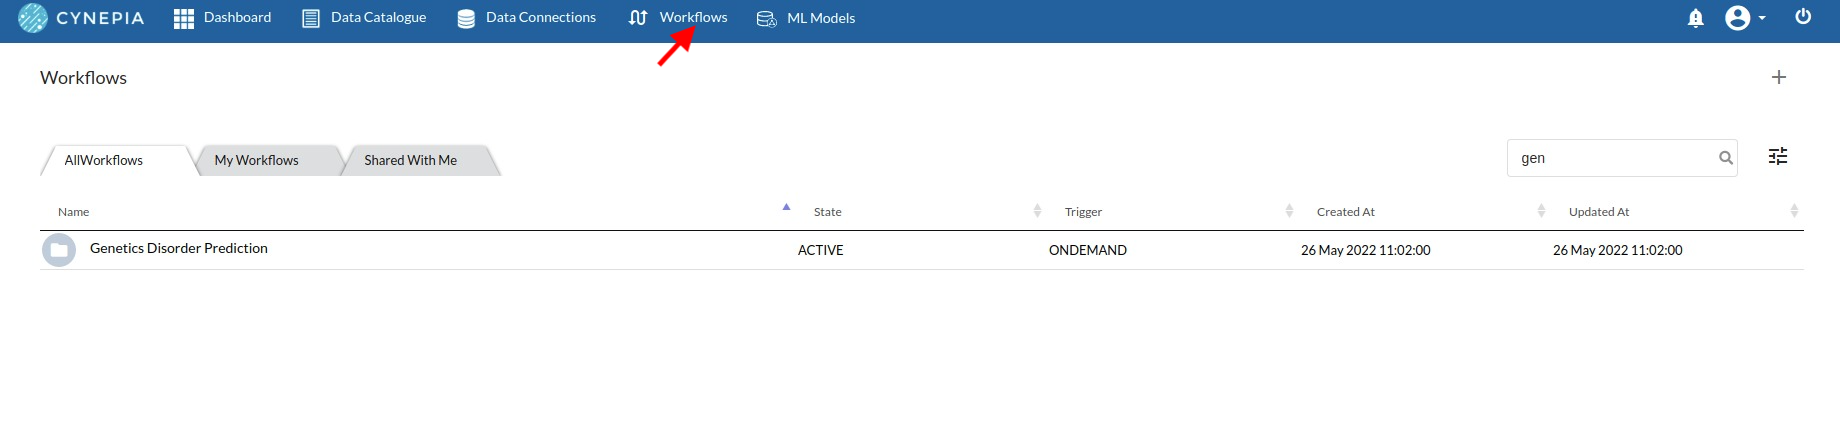
- To navigate to the workflow Details Page, double-click on the Workflow List Item and then click Design Workflow. Visit the Workflow Designer Main Page for additional information.
- By clicking on + icon you can add the Input Dataset to the step view. The input step will be added to the Step View.
Perform initial exploration of data columns.
- Examine the output view with Header Profile, paying special attention to the column datatypes. for more information refer to output window
- Column Statistics Tab (Refer to Column Statistics for more details on individual KPI)
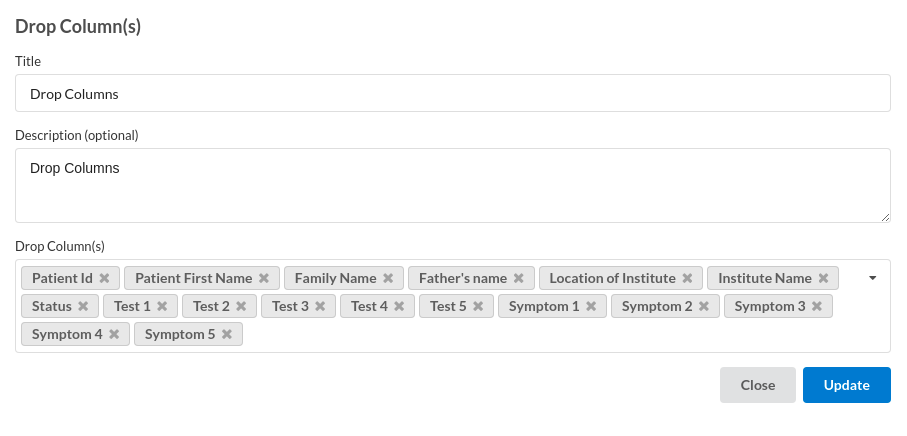
Perform Cleanup and Transform Operations
- Drop Unecessary Columns.
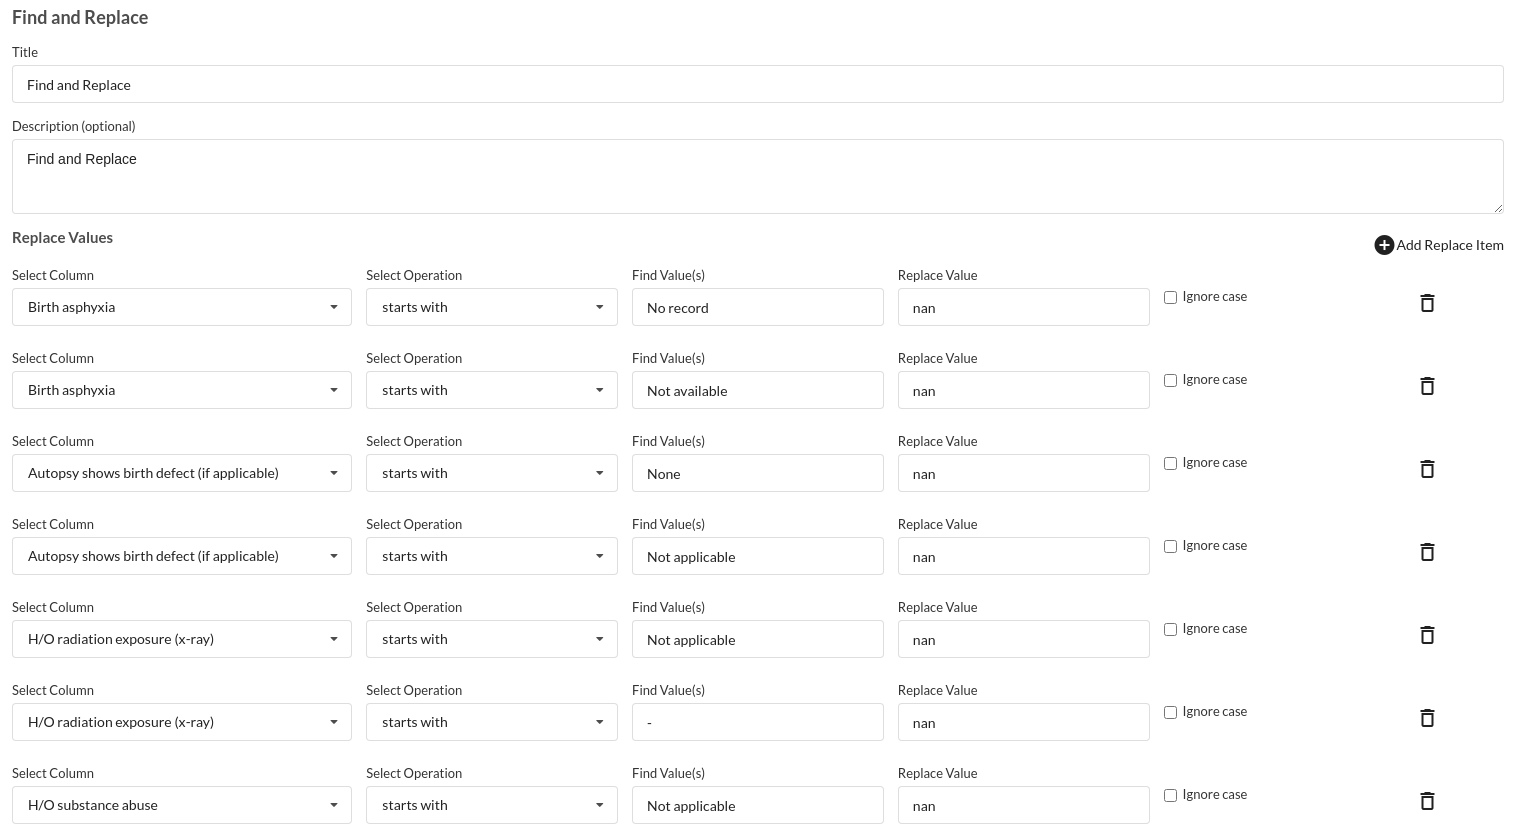
- Find and Replace Column values.
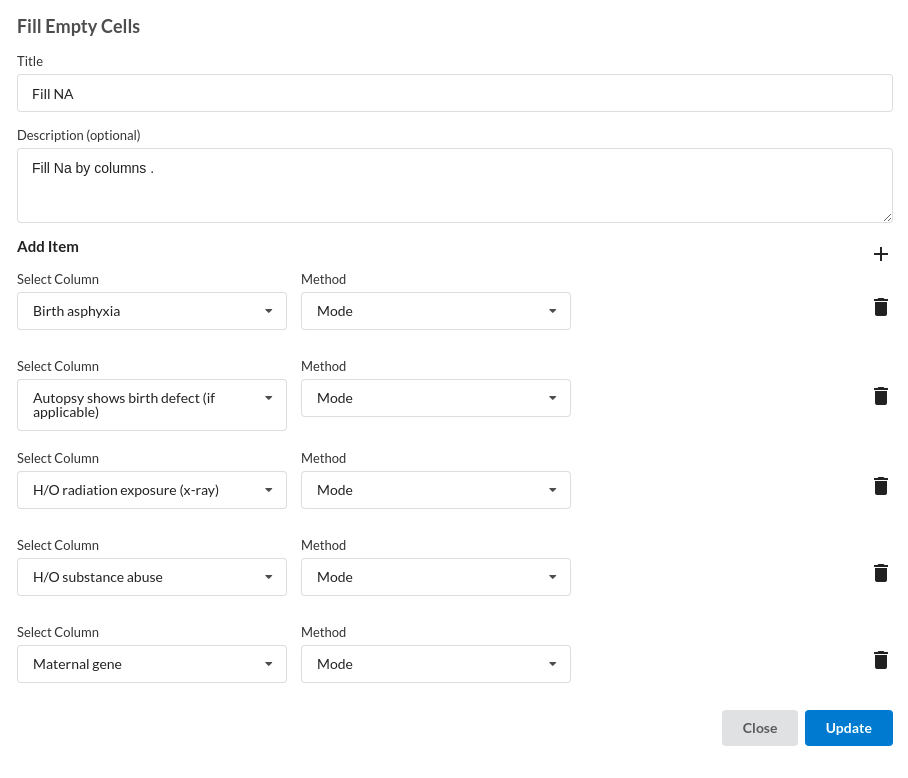
- Fill Null values.
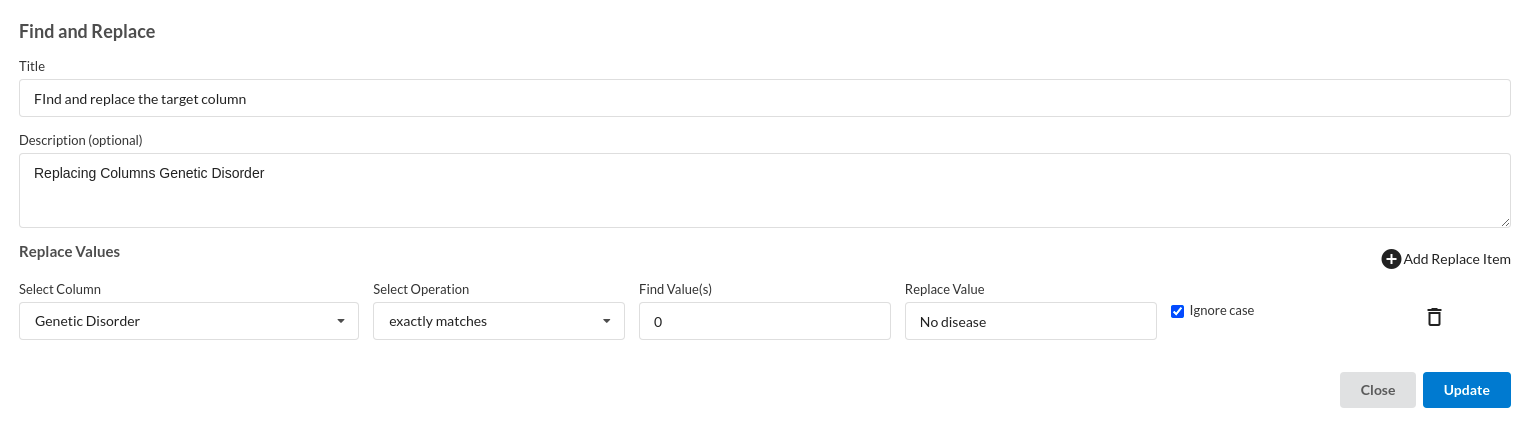
- Find and Replace target Column values
Build/Train a classification Model
- You have a dataset to work with in order to create a classification model. Some of the actions to take before developing a model are listed below.
- Feature Selection
- Feature Encoding
- Choose the algorithm and train the model.
Feature Selection
-
Go to the Column Profile View and select Multi-variate profile to construct a correlation matrix to manually identify the features of interest. The peason correlation is shown by Xceed Analytics. Select all of the columns that are strongly correlating to the target feature.
-
Some of the features to chose that can explain the target variable based on the observed correlation are:
Feature Encoding
- Take all of the categorical columns and encode them based on the frequency with which they occur. for more infomation on this processor, refer to Feature Encoding
Choose the algorithm and train the model.
- You are estimating a categorical variable- genetic disorder for the prediction model. From the Transformer View, select Classification(auto pilot) andfill in the relevant information.
Review the model output and Evaluate the model
After you finish building the model, it is time to review the model output. Look at the output window to first review your predicted results .You will get a new column in the view like the one below.
When you finish building your model you will see another tab in the view called Ml explainer . Click on that to evaluate your model.
-
The first view you see when you click on ML explainer is the Summary view
-
The second view under Ml explainer is configuration view
The configuration view will give you the information about the step you filled in the Classification step . The view would look like the one below.
The third view under Ml explainer is Performance View . You can see confusion matrix ,ROC Curve, Precision vs Recall and Cumulative Gain Curve. Look at the built charts and decide if the charts are good enough for your model. The confusion matrix is a good indicator to understand how well your model was trained.
-
The fourth view under Ml explainer is Leaderboard . In this view you can see the number of algorithms trained and all the feature engineering done on the algorithms used with ranking system to rank the best algorithm trained.
-
The last view you see under ML explainer is Interpretability . In this view you will be able to interpret your model in simple terms where you will be getting results pertaining to feature importance , PDP Plots , Sub Population Analysis , Independant Explanation , Interactive Scoring . for more infomation on these results , refer to Interpretability . The Interpretability tab and the results under this tab would look like the one below.