Model Interpretability

For any company to create an ML usecase , collect the right data , build a model ,validate and deploy it takes a lot of effort and human hours. during these steps the one part we forget is model explainability or interpretability which is necessary to anyone who is either learning machine learning or even working in an organisation.
Interpretability is not about details of how to make a model perform better but only with the details of how the model performed, what was it that it took to perform the way it did and explain it in a layman’s terms. One of the main reason as to why most models fail is because models can’t be explained to a business users in a easier way . Before getting into the details let us understand few terms as to what is interpretability , Importance and Scope of it
Interpretability
”Why” a customer was labeled as fraudulant? “Why” did the model predict that this employee would leave the organization ? It is quite normal to have these questions while undestanding any ML model. If a machine learning model can create relationship between these then it is interpretable .Though nothing makes sense it is worth exploring.
Interpretability means that the cause and effect can be determined.
Most of the supervised algorithms like Decision Trees, Regression and Classification can be interpretable but there is a gray area where algorithms like Random Forest,Neural Network and Convulutional Neural Networks are a little difficult to interpret.
Importance of Interpretability
-
Interpretability is different for both the DataScientists/ML engineers and Business users. This is where the trendy names like interpretability and explainability comes in the pictures. If an Engineer can interpret the model perfectly then he/she can explain the same to the business user and they can do the same while using the model predictions.
-
A business user is not concerned about the metrics or the performance of the model but an engineer is very into it and we will go through both the ways where it is useful . It is really not easy to trust the model the way it is built or trained . Incomplete information like accuracy makes very less sense. As mentioned, Interpretablity is different for both business user and ML engineers. As an example, take a small instance of credit fraud. Suppose Priyank used his credit card while travelling and the transaction he did was considered fraudulant and his card was blocked . The next thing he does is to call the customer service rep and ask why was his card blocked and the rep is following the prediction that is coming to his screen . If the rep just says his screen shows the transaction was fraudulant then I don’t think Priyank would be very happy about it . Instead if there is an explaination as to why was the transaction classified as fraudulant then it would really helpful. Such as , Priyank does not usually travel a lot so the one transaction he did was considered fraudulant so next time he add a travel alert he travels. In this Instance the rep was the business user and he was not weighted down with terms like logloss, F1 score, Instead he was only given the reason .
Scope of Interpretability
-
Understanding how the algorthm works : If you use decision tree for the model then you should know how many splits did you configure, what was the information gain after each split,entropy and which was the decision node. for any Engineer to explain the model to any user the algorithmic understanding is very much necessary.
-
Global Interpretability: This level of Interpretability is about how the model makes decisions or to say it technically , you will look at feature importance chart,plot partial dependance plots.
-
Local Interpretability for single and multiple Instances: These ask the question “WHY” . why did this record considered fradulant? what was the reason a particular feature contributed the most in this batch of prediction and this is where we use SHAP for single instance and sub population analysis for batch of instances.
Methods or techniques to Interpret any model
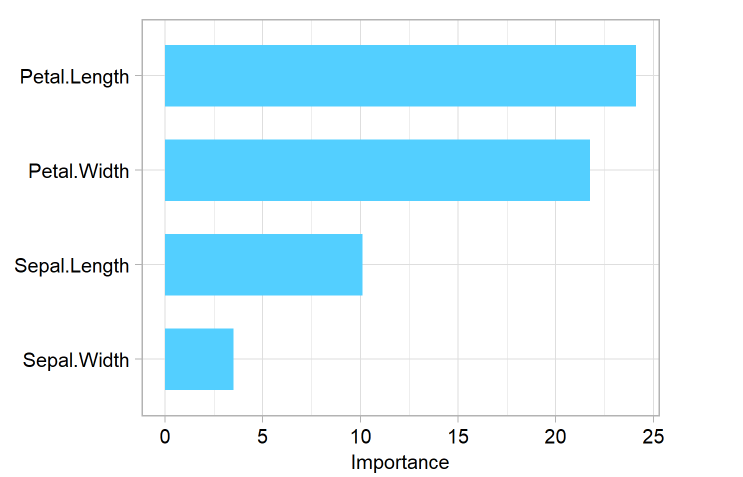
Feature Importance
This refers to techniques that calculate a score for all the input features for a given model. The score simply represents the “Importance” or “Impact” that feature has on the given model.Higher the score means that the specific feature will have a larger effect on the model.
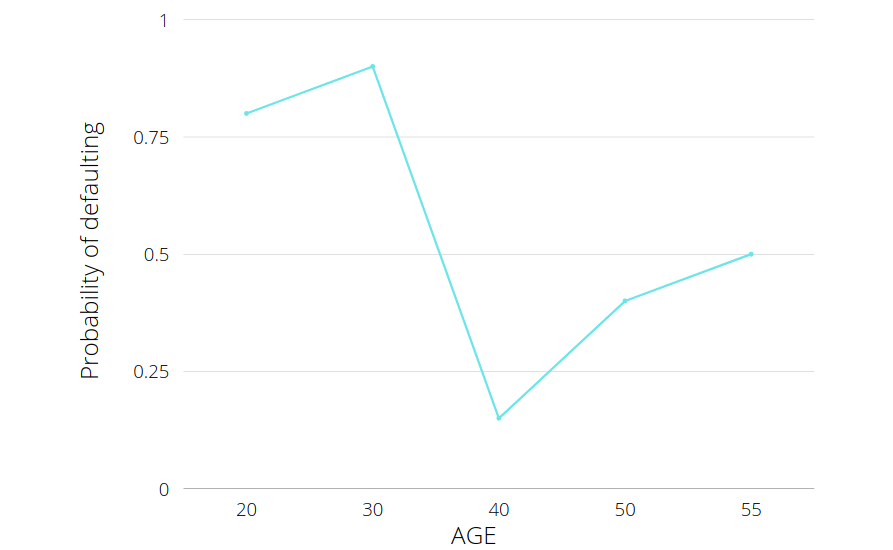
Partial Dependence Plots
Partial Dependance plots are a really useful method to analyse a single column's impact on the model. for example , You are building a loan defaulter model and you want to check the age groups that are most likely to ddefault and your first choice should be Partial Dependance plots. it is easy to PDP plots. In the Y-axis you get the probablity of the loan defaulter and the X-axis you will plot the age
Sub-population Analysis
Sub-population analysis a tabular format of actual vs predicted for any selected column. This is an Xceed implemented feature. For example , Suppose you are building a automobile car prediction model and want to check the predicted values for different engine sizes . Sub-population analysis helps you do that. Looking at the view , it helps you understand if the predicted values are matching the actual values and if they are matching very accurately then it means the model is biased for those values.