Classification Methods

What are classification tasks?
According to wikipedia , Classification is defined as "Identifying which of a set of categories (sub-populations) an observation (or observations) belongs to". Examples are assigning a given email to the "spam" or "non-spam" class, and assigning a diagnosis to a given patient based on observed characteristics of the patient (sex, blood pressure, presence or absence of certain symptoms, etc.)" Classification algorithms used in machine learning utilize input training data for the purpose of predicting the likelihood or probability that the data that follows will fall into one of the predetermined categories. One of the most common applications of classification is for filtering emails into “spam” or “non-spam”, as used by today’s top email service providers.
Usecases in classification
-
Customer behavior prediction: Customers can be classified into different categories based on their buying patterns, web store browsing patterns etc. For example, classification models can be used to determine whether a customer is likely to purchase more items or not. If the classification model predicts a greater likelihood that they are about to make more purchases, then you might want to send them promotional offers and discounts accordingly. Or if it has been determined that they will probably fall off of their purchasing habits soon, maybe save them for later by making their information readily available.
-
Spam filtering: An algorithm is trained to recognize spam email by learning the characteristics of what constitutes spam vs non-spam email. The classification model could be a function that maps from an email text to a spam classification (or non-spam classification). Algorithms such as Naive Bayes and Support Vector Machines can be used for classification. Once the classification model is trained, it can then be used to filter new incoming emails as spam or non-spam. The picture below represents the Spam classification model depicted as Spam classifier.
Algorithms/Estimators used in Classification
There are a total of 28 algorithms used for supervised classification tasks under sklearn. The whole of the data science and ML space would agree on very few algorithms that are production worthy . The real meaning of production worthy here is that when you want to deploy a model you need to know the underlying mechanisms of the algorithm that you use . Most of the algorithms in classification are quite easy to understand but there are few which need a little less technicality . The below list are the estimators which are widely used in the industry and have had good impact.
- K-Nearest Neighbours
- Decision Tree
- Logistic Regression
- Support Vector Machine
- Extra Trees
- Random Forest
- Gradient Boosting
Estimators supported in Xceed ML
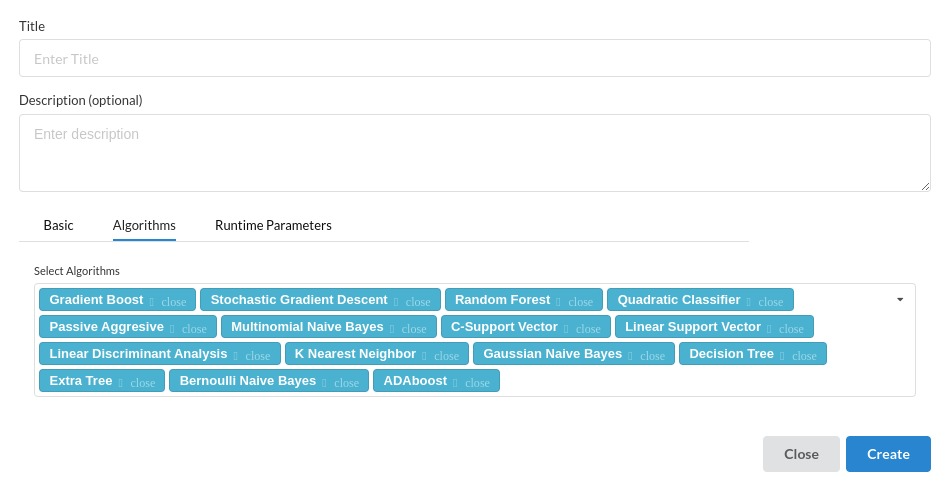
Given the number of estimators that are famously used, Xceed supports a little more than that and can be used effortlessly without any in depth knowledge of the algorithms because the concept remains the same in most of the algorithms
The below picture is a view listing all classification estimators Xceed supports
Evaluating a Classification Model
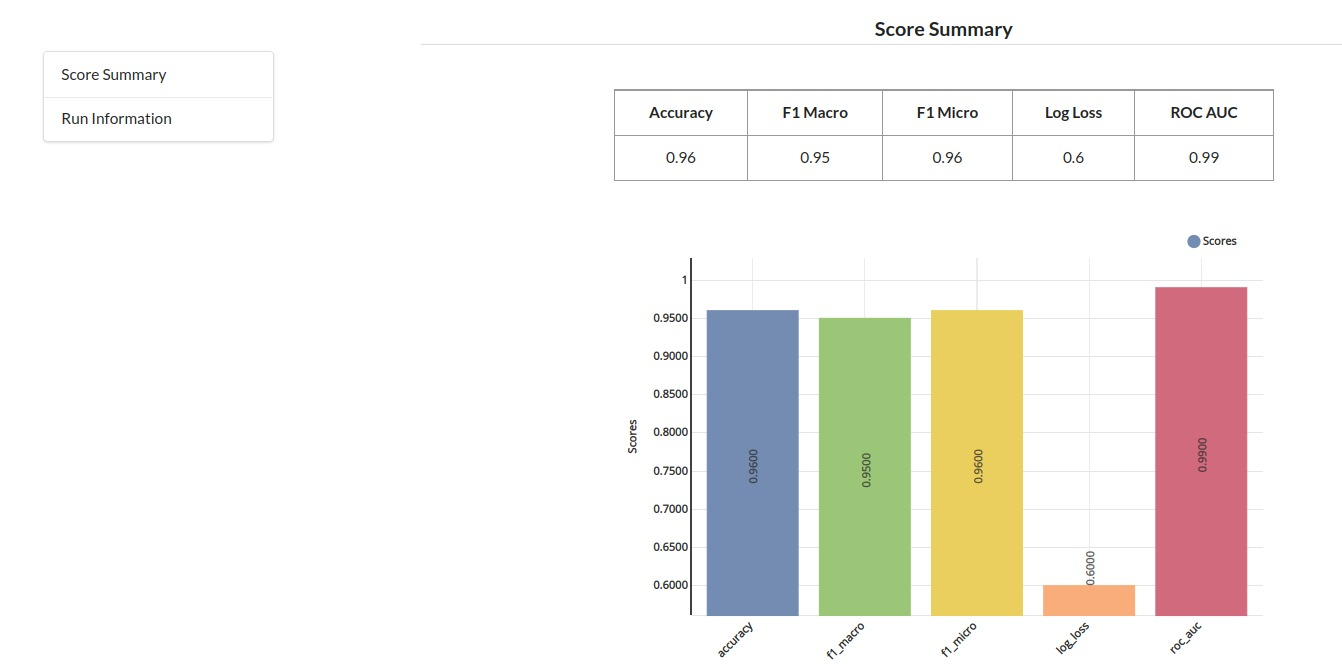
Accuracy
Accuracy simply measures how often the classifier correctly predicts. We can define accuracy as the ratio of the number of correct predictions and the total number of predictions.
Log loss
Log Loss can be used when the output of the classifier is a numeric probability instead of a class label. Log loss measures the unpredictability of the extra noise that comes from using a predictor as opposed to the true labels.
F1 macro
Macro F1-score (short for macro-averaged F1 score) is used to assess the quality of problems with multiple binary labels or multiple classes. If you are looking to select a model based on a balance between precision and recall, don't miss out on assessing your F1-scores
F1 micro
Micro F1-score (short for micro-averaged F1 score) is used to assess the quality of multi-label binary problems. It measures the F1-score of the aggregated contributions of all classes
ROC_AUC
A receiver operating characteristic (ROC), or simply ROC curve, is a graphical plot which illustrates the performance of a binary classifier system as its discrimination threshold is varied.
Xceed supports all of these evaluation criterias under ML explainer Tab
Explaining a Classification Model
After the model creation and checking all the evaluation criterias you need to come to the explainability/interpretability part of the process where there are two important charts are used all over the data space .
Confusion Matrix
A confusion matrix is a tabular summary of the number of correct and incorrect predictions made by a classifier. It can be used to evaluate the performance of a classification model through the calculation of performance metrics like accuracy, precision, recall, and F1-score
ROC Curve
The ROC is created by plotting the FPR (false positive rate) vs the TPR (true positive rate) at various thresholds settings.
Precision Vs Recall
A precision-recall curve shows the relationship between precision (= positive predictive value) and recall (= sensitivity) for every possible cut-off.
Cumulative Gain Curve
The cumulative gains curve is an evaluation curve that assesses the performance of the model and compares the results with the random pick. It shows the percentage of targets reached when considering a certain percentage of the population with the highest probability to be target according to the model
Xceed supports all of these explainable methods under ML explainer Tab
